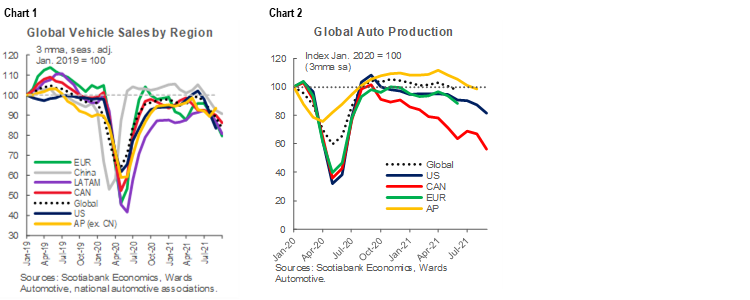
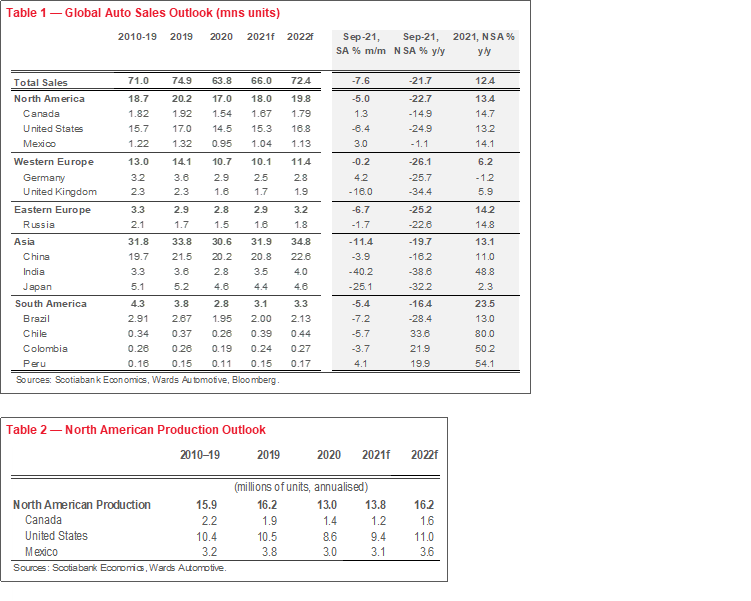
- Global auto sales deteriorated for a fifth consecutive month in September with a -7.6% m/m (sa) contraction as limited inventory around the world impacted sales. Global sales were down by -22% y/y (nsa) for the month.
- Auto sales contracted in most major markets including the US, China, Japan, and the UK (-6% m/m, -4% m/m, -25% m/m, and -16% m/m, respectively). Exceptionally, German auto sales picked up by 4% m/m (sa) in September, but remained in seriously negative territory on a year-over-year basis (-26% y/y).
- Global vehicle production still shows no sign of pivoting. Further production curtailments were announced on a rolling basis over the course of September (and to present) as vehicle makers have a limited line of sight on semiconductor chip deliveries. September auto production was down -10% m/m (sa) in North America.
- With the impacts of the Delta variant still working through South Asian chip production, it is likely overly optimistic to expect a significant turn-around in fourth-quarter auto production even though some forecasters have this penciled in.
- Our best-guess is that auto production stabilizes in November and December with the much-anticipated rebound beginning only in early 2022. As we continue to note, auto production capacity constraints limit how quickly the sector can capitalize on mounting pent-up demand.
- We expect more balanced supply-demand conditions would only materialize into 2023. By extension, this suggests new (and used) vehicle price pressures would persist over this horizon, albeit with some potentially stabilizing factors including base effects and diminishing model-pricing biases with greater selection.
- There is still enormous uncertainty to this outlook that extends well-beyond the chip shortage as other material shortages, shipping bottlenecks, and labour constraints have the potential to (further) delay the recovery for the global auto sector.
GLOBAL AUTO SALES IN BRIEF
Global auto sales declined for a fifth consecutive month with a -7.6% m/m (sa) slowdown in September (chart 1). The deceleration is roughly on par with August’s -7.8% m/m (sa) pullback. On an annualised basis, sales sat at a very weak 57 mn units in September after trending closer to 72 mn vehicles for most of the first half of the year. On a year-over-year basis, the decline was -22% (nsa). Sales retrenchments were near-universal around the world as the semiconductor chip shortage has impacted production across all regions (chart 2). Asia Pacific auto sales led the dip with a -11% m/m (sa) contraction on the back of very weak Japanese auto purchases (-25% m/m, sa) as the region is the latest to be impacted by the chip shortage that saw Japanese auto production plunge by -17% m/m (sa) in August (latest available). The pace of the decline in North American auto sales let up modestly (-5% m/m, sa versus -11% m/m, sa in August) as American purchases slowed by -6% m/m (sa) against modestly positive turns in Canada and Mexico. European auto sales were largely flat as Germany posted a 4% m/m (sa) improvement against the UK’s sharp -16% m/m deterioration. Latin America experienced a -5% m/m (sa) contraction with only Peru posting an improvement in September auto sales.
See Box 1 in the Annex for a more detailed view of global auto sales in September. Also see a more fulsome discussion of the semiconductor chip shortage here.
AUTO PRODUCTION STILL PUMMELLING SALES
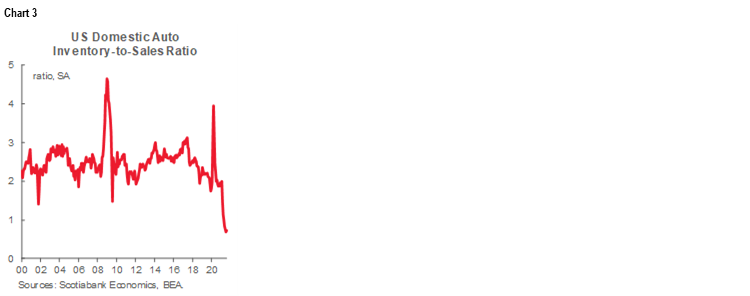
Global auto sales posted its worst month this September since the pandemic first pummeled purchases in the spring of 2020. This time, however, it is not lack of demand, rather a shortage of vehicles. Dealer lots around the world remain sparse. The US inventory-to-sales ratio deteriorated modestly again in September, with inventory declining by -12% m/m (sa) (chart 3). Vehicles on American lots dipped below an unprecedented one million, which clearly limits sales. This is near-universal across markets; for example, Chinese inventory also remains in record-tight territory through September with minimal signs of improvement in its Vehicle Inventory Alert Index.
Auto production has yet to pivot. Production data is lagged in most countries but a quick tour de table of several key markets suggests global auto production likely continued to decline in September. North American auto production was down by -10% m/m (sa)—and a whopping -42% m/m in Canada—in September according to Wards Automotive Group. Japanese auto production pulled back by -17% m/m (sa) in August. European markets are too lagged to provide much insight, but are no doubt in decline. A modest improvement in Chinese auto production (2% m/m, sa) in September offers only false hope for the global recovery given its greater control over chip supply.
Though final numbers are not yet in, auto production in October will likely disappoint. The Delta variant continued to dampen South Asian chip production over the course of the month according to chip makers, while North American chip production in September (chart 4) was still struggling to recover earlier gains that likely hurt domestic auto production through October. AutoForecast Solutions reports that automakers cut North American production plans by another 150 k vehicles in the first three weeks of the month alone. All this to say, October has not shaped up to be the pivot-point for auto production.

RECOVERY AROUND THE CORNER?
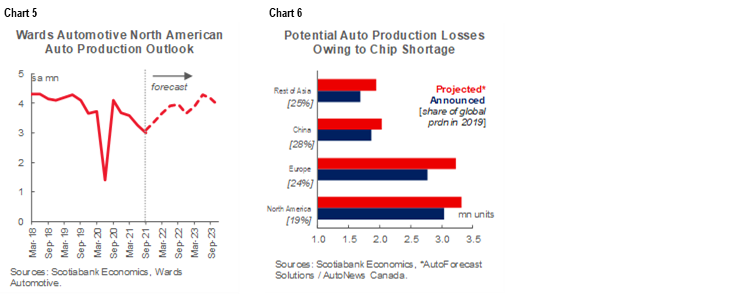
Wards Automotive Group still pencils in a fourth-quarter recovery of 8% q/q (sa). This follows the near-8% q/q (sa) decline in the third quarter (end of September) (chart 5). But its outlook is likely optimistic as it tracks automakers’ production plans which continue to be revised down on a weekly basis. AutoForecast Solutions, which puts judgement on stated plans, puts a much larger number on lost production: it now forecasts 3.3 mn fewer vehicles in North America and 10.9 mn fewer globally this year (chart 6).
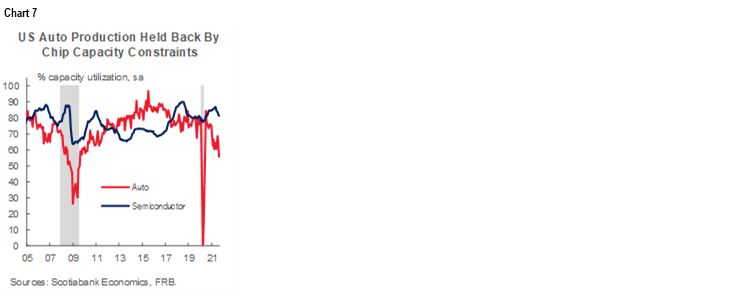
A reasonable placeholder is that auto production will stabilize—albeit at low levels—in the final months of this year. The much-awaited rebound bump is likely pushed out to the new year and would unfold gradually over several quarters. The gap between chip production capacity (operating at near-capacity) versus auto production in the US (well-below) is still stark, suggesting limits to how quickly supply can catch up (chart 7).
PRICE PRESSURES TO CONTINUE
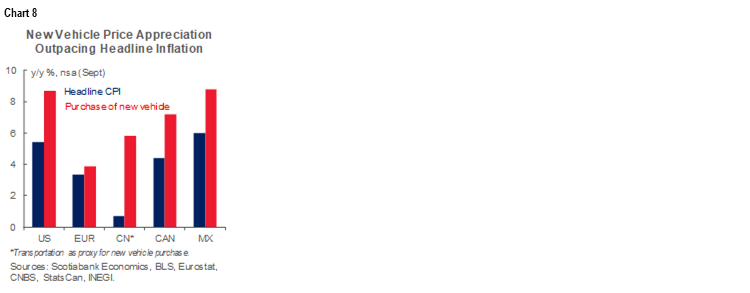
Not surprisingly, new vehicle prices continue to remain elevated. According to J.D. Power, average transaction prices for new vehicles in the US were tracking to almost 19% higher this September versus September 2020—though the sticker price for consumers is lower as stronger trade-in values and lower financing costs are offsetting some of the new vehicle price appreciation. This continues to feed inflationary pressures as new vehicle price appreciation in the US reached new heights in September (+8.7% y/y, nsa). Again, this is not unique to the US market with new vehicle prices putting pressure on inflation prints around the world as new vehicles typically represent 5–7% of price baskets in advanced economies (chart 8).
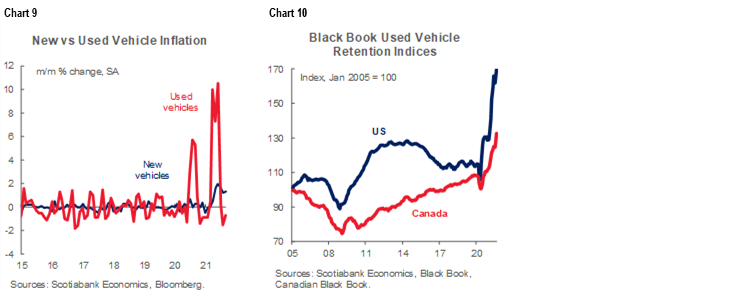
Limited inventory in the new vehicle segment is impacting used vehicles. Given the prolonged nature of the new-vehicle inventory recovery, used car markets are similarly likely to remain supply-constrained through 2022 and into 2023. Black Book reports that used vehicle inventory in the US was down by -17% since the beginning of the year, while retail prices were up by 29% as of late October. Both retail and wholesale prices have been trending stronger over the Fall, according the same source, and this is showing up in still-escalating retention indices in the US and Canada (chart 9). On a month-over-month basis, however, used vehicle price appreciation has largely stabilized in the US (chart 10)—likely as consumers are sidelined by elevated prices and limited inventory—but with new vehicle prices still mounting, we are unlikely to see much softening in the near term until inventory improves materially.
Price pressures for new and used vehicles are likely to persist over the coming quarters given the slower recovery in vehicle production and limited inventory. New-model roll-outs in 2022 could be another upside risk to the extent automakers pass along increased manufacturing costs through pricing (not just through incentive channels). This is consistent with recent forecast revisions by Scotiabank Economics last week with inflation forecasts revised higher over the horizon in Canada and the US, in part owing to more persistent supply constraints and bottlenecks. Nevertheless, auto prices should largely stabilize on a month-over-month basis, softening towards the end of 2022.
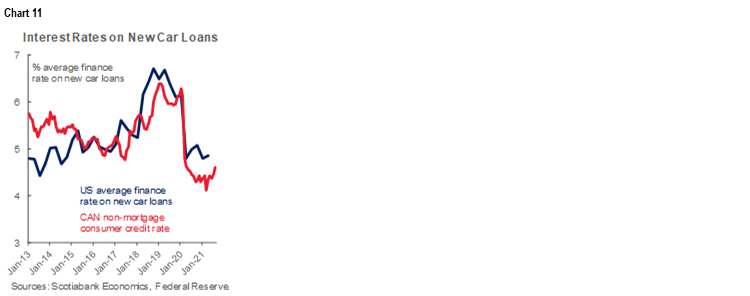
There are a variety of other (potentially) emerging headwinds to the cost of vehicle ownership. Central banks have recently turned more hawkish in guidance on the overnight rate path with hikes starting in mid- and late-2022 in Canada and the US, respectively. Markets are already pricing in this tightening along with inflation risk. The effect on the cost of vehicles is so far relatively muted with still-low financing in both markets (chart 11), but should add to pressures over the medium term given rate outlooks. New model roll-outs in 2022 could see a higher pass-through of manufacturing costs to consumers, but higher model selection should offset this given the higher-end production bias throughout 2021. In addition, gasoline prices are now well-past pre-pandemic levels and continue to rise.
FINISHING ON A MORE POSITIVE NOTE
The magnitude of pent-up demand suggests that the auto sales cycle will extend through 2023 even as the economic cycle matures in most major markets. Last month’s report here discusses pent-up demand in further detail, but it is likely in the order of 2 mn vehicles in North America alone that could be pushed out to 2022 and 2023 into an environment of already-solid consumer demand. On top of the usual economic drivers (e.g., continued job recoveries, unwinding of savings as confidence strengthens, and higher vaccination levels), renewing depleted fleet stocks and replacing aging vehicle stocks should underpin demand over the medium term.
BOX 1: TRENDS IN REGIONAL AUTO SALES
Global auto sales pulled back again in September by -7.6% m/m (sa) for a fifth consecutive month of decline. On an annualised basis, sales sat just shy of an anemic 57 mn units in September after trending closer to 72 mn vehicles over the first half of the year. On a year-over-year basis, the decline was -22% (nsa). Not surprisingly, the global semiconductor chip shortage continues to weigh on the global auto sales recovery. The outbreaks of the Delta variant around the world continue to impact supply chains. The recovery in auto production has consequently been pushed out yet again as manufacturers announce further curtailments on a rolling basis into the near future.
Asia Pacific auto production has been the last to be hit by chip shortage. Notably, Japanese auto production contracted by -17% m/m (sa) in August (latest available), which curtailed September sales (-25% m/m, sa)) along with COVID-19-related restrictions. Chinese auto sales slowed again by -4% m/m (sa), albeit slightly less-bad than August’s contraction of -7% m/m (sa). Indian auto sales contracted sharply by -40% m/m (sa), with the Asia Pacific region as a whole declining by -11% m/m (sa).
The descent in North American auto sales let up only modestly in September (-5% m/m, sa versus -11% m/m, sa in August). US sales declined by -6.4% m/m, sa at a very weak annualised sales rate of 12.2 mn vehicles. Very low inventories are curbing otherwise relatively strong demand-side factors as discussed here.) Wards Automotive is predicting a turn-around in October sales for the US, but with inventory less than one million vehicles heading into October and further production curtailments over the course of October, it seems it would be a feat to carry off an improvement. There is wide variability in monthly sales figures for Canada with automakers no longer reporting on a monthly basis—Wards Automotive reported a 1% m/m improvement in sales versus DesRosiers Automotive Consultants Inc. reporting a -4.3% m/m (sa) decline in September—but the trend-decline is evident. Preliminary data suggests October sales will post another decline.
Western European auto sales stabilized in September but masked differences across countries. The 4% m/m (sa) improvement in German auto sales likely speaks more to the double-digit declines in the two prior months as sales were still down by -26% y/y. France and Spain also experienced similar bounce-backs (2% m/m and 12% m/m, respectively), while UK auto sales pulled back by a notable -16% m/m (sa), compounding August’s -11% m/m (sa) deterioration.
Latin American auto sales declined for a third consecutive month in September (-5% m/m, sa), albeit at a slower pace than August (-10% m/m, sa). Brazil led the regional slowdown on a volume basis with -7% m/m, offset by a 3% m/m (sa) improvement in Mexico vehicle sales. Chile and Colombia also experienced further slowdowns in September (-6% m/m and -4% m/m, respectively) with only Peru pulling off its second consecutive month of increasing sales (4% m/m).
DISCLAIMER
This report has been prepared by Scotiabank Economics as a resource for the clients of Scotiabank. Opinions, estimates and projections contained herein are our own as of the date hereof and are subject to change without notice. The information and opinions contained herein have been compiled or arrived at from sources believed reliable but no representation or warranty, express or implied, is made as to their accuracy or completeness. Neither Scotiabank nor any of its officers, directors, partners, employees or affiliates accepts any liability whatsoever for any direct or consequential loss arising from any use of this report or its contents.
These reports are provided to you for informational purposes only. This report is not, and is not constructed as, an offer to sell or solicitation of any offer to buy any financial instrument, nor shall this report be construed as an opinion as to whether you should enter into any swap or trading strategy involving a swap or any other transaction. The information contained in this report is not intended to be, and does not constitute, a recommendation of a swap or trading strategy involving a swap within the meaning of U.S. Commodity Futures Trading Commission Regulation 23.434 and Appendix A thereto. This material is not intended to be individually tailored to your needs or characteristics and should not be viewed as a “call to action” or suggestion that you enter into a swap or trading strategy involving a swap or any other transaction. Scotiabank may engage in transactions in a manner inconsistent with the views discussed this report and may have positions, or be in the process of acquiring or disposing of positions, referred to in this report.
Scotiabank, its affiliates and any of their respective officers, directors and employees may from time to time take positions in currencies, act as managers, co-managers or underwriters of a public offering or act as principals or agents, deal in, own or act as market makers or advisors, brokers or commercial and/or investment bankers in relation to securities or related derivatives. As a result of these actions, Scotiabank may receive remuneration. All Scotiabank products and services are subject to the terms of applicable agreements and local regulations. Officers, directors and employees of Scotiabank and its affiliates may serve as directors of corporations.
Any securities discussed in this report may not be suitable for all investors. Scotiabank recommends that investors independently evaluate any issuer and security discussed in this report, and consult with any advisors they deem necessary prior to making any investment.
This report and all information, opinions and conclusions contained in it are protected by copyright. This information may not be reproduced without the prior express written consent of Scotiabank.
™ Trademark of The Bank of Nova Scotia. Used under license, where applicable.
Scotiabank, together with “Global Banking and Markets”, is a marketing name for the global corporate and investment banking and capital markets businesses of The Bank of Nova Scotia and certain of its affiliates in the countries where they operate, including; Scotiabank Europe plc; Scotiabank (Ireland) Designated Activity Company; Scotiabank Inverlat S.A., Institución de Banca Múltiple, Grupo Financiero Scotiabank Inverlat, Scotia Inverlat Casa de Bolsa, S.A. de C.V., Grupo Financiero Scotiabank Inverlat, Scotia Inverlat Derivados S.A. de C.V. – all members of the Scotiabank group and authorized users of the Scotiabank mark. The Bank of Nova Scotia is incorporated in Canada with limited liability and is authorised and regulated by the Office of the Superintendent of Financial Institutions Canada. The Bank of Nova Scotia is authorized by the UK Prudential Regulation Authority and is subject to regulation by the UK Financial Conduct Authority and limited regulation by the UK Prudential Regulation Authority. Details about the extent of The Bank of Nova Scotia's regulation by the UK Prudential Regulation Authority are available from us on request. Scotiabank Europe plc is authorized by the UK Prudential Regulation Authority and regulated by the UK Financial Conduct Authority and the UK Prudential Regulation Authority.
Scotiabank Inverlat, S.A., Scotia Inverlat Casa de Bolsa, S.A. de C.V, Grupo Financiero Scotiabank Inverlat, and Scotia Inverlat Derivados, S.A. de C.V., are each authorized and regulated by the Mexican financial authorities.
Not all products and services are offered in all jurisdictions. Services described are available in jurisdictions where permitted by law.