- Canada’s economy did indeed rebound in Q4…
- ...with understated growth due to strikes aplenty
- The postal strike drove the weakest November on record for cross-border shipments
- Growth matching potential stopped the small output gap from widening further
- The path forward faces huge uncertainties…
- ...making backward-looking data of little use…
- ...and so markets ignored it, focusing upon the tariff threat instead
- Canadian GDP, m/m % change, November, SA:
- Actual: -0.2
- Scotia: 0.0
- Consensus: -0.1
- Prior: 0.3
- December ‘flash’ estimate: 0.2
The Canadian economy’s acceleration in Q4 would have been greater if not for transportation bottlenecks caused by the direct and indirect effects of widespread strikes. And yet with bigger threats lurking ahead it may not matter one iota. To the latter point, what is driving USDCAD and the yield curve this morning is tomorrow’s tariff threat.
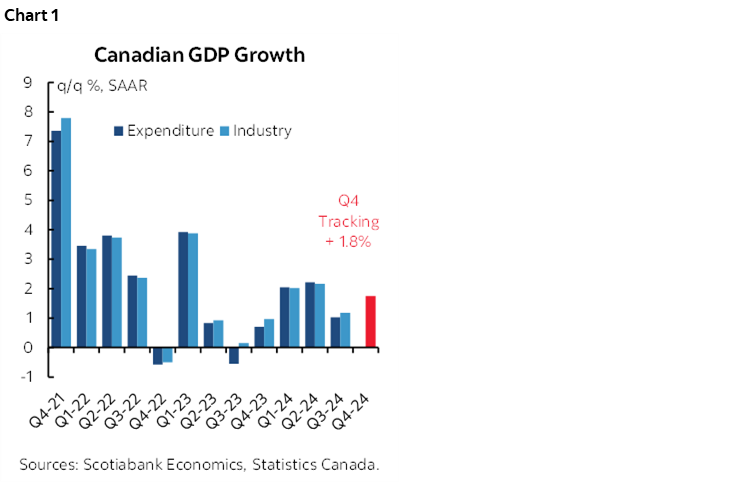
Before getting to that, the 1.8% q/q SAAR GDP growth in Q4 that is now being tracked with the monthly production-side accounts is nothing to spit at. It’s not great, but it’s roughly at the potential growth rate of the economy, that is, the noninflationary speed limit to growth. That means that the economy was no longer adding to net slack in Q4. That amount of slack was modest to begin with as the BoC’s estimate of the output gap up to Q3 was just –0.9%. In a base case scenario, you wouldn’t hang you hat on that to merit an aggressive set of further rate cuts. The path for easing depends critically upon tariffs and is highly uncertain.
What drove this is that GDP was guided to be up 0.2% m/m SA in December after a –0.2% dip in November that was one-tenth weaker than Statcan’s initial ‘flash’ November guidance that was provided a month ago.
Using the monthly GDP estimates reveals 1.8% q/q SAAR growth in Q4 but it also indicates no momentum into Q1. That puts the full emphasis upon monitoring data as it arrives in Q1.
Statcan’s guidance on December’s 0.2% rise absent sector details is strictly verbal:
“Increases in retail trade, manufacturing and construction were partially offset by decreases in transportation and warehousing, real estate and rental and leasing and wholesale trade.”
Nut check at least some of the negativity on Canada to date notwithstanding problems ahead. I'm firm on that. Many were saying a recession would be obvious, and yet where's the recession? It’s not in chart 1. I leaned against that narrative in favour of a gradual improvement in growth which we’re getting in a base case narrative absent tariffs that would be an accelerating story.
Greater challenges lurk ahead. Exactly how much greater and how to quantify them is deeply uncertain in terms of the net trade offs of trade policy, tighter immigration policy, lagging effects of past easing, lagging effects of the past surge of immigration, and how fiscal policy responds.
Blame strikes for much of Canadian November GDP
Chart 2 shows the weighted contributions to the dip in GDP in November.
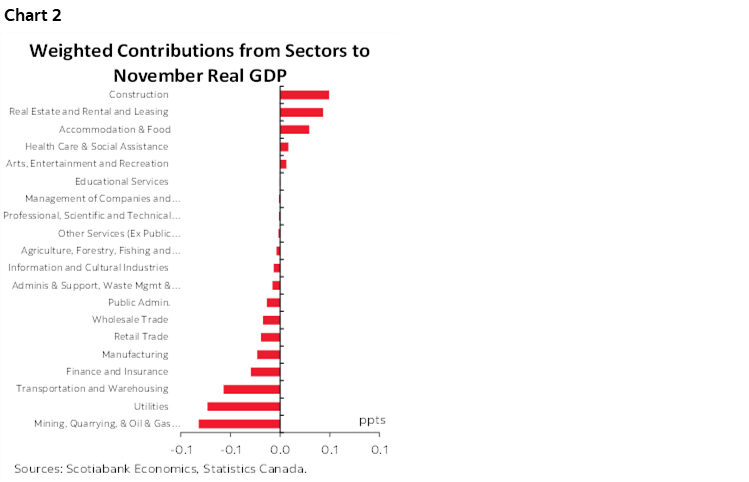
The transportation and warehousing sector knocked 0.1% m/m off November GDP in weighted terms. Posties were on strike, and there were also work stoppages in rail that hit that sector's output by 30% and water transportation (-4.6%) with other strikes at the Port of Montreal and a BC port lockout to contend with.
And that's just the direct effect. The indirect effect of disruptive strikes in postal, rail and port services rippled through the rest of the economy. That’s hard to estimate how much, but intuitively these disruptions would have contributed to the softness in other sectors that couldn't move product, couldn't order and send gifts in the mail, couldn't secure inventories etc.
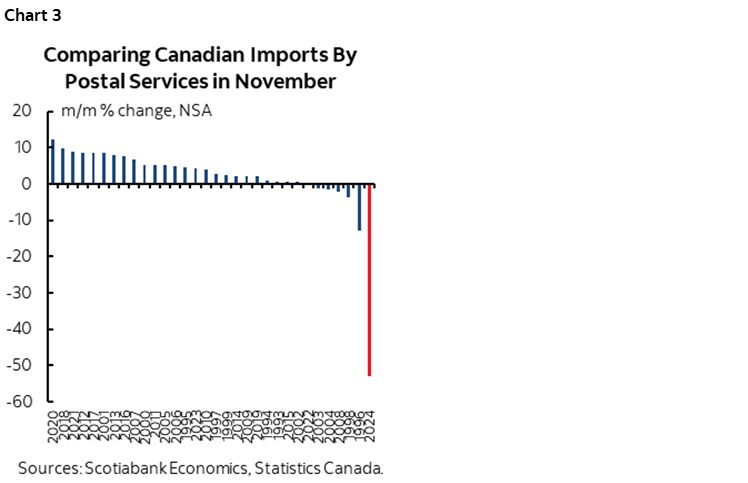
One indication of the impact of just the postal strike is that it ground cross-border spending by consumers and businesses through postal and courier services to an absolute halt. Import data captures goods coming into the country through postal and courier services, like if you shop online in the US or elsewhere in the world and have it sent to a Canadian address. This activity plunged. November 2024 posted a massive decline that was the weakest month of November for such activity on record. It is seasonally unadjusted data (NSA) and so that’s why the chart compares like months of November in history. This type of spending is not captured by the retail sales numbers that only reflect domestic purchases which is why we need to look at the import data.
My spitballing guesstimate is that if not for these strikes and their indirect effects, GDP would have been roughly flat in November. That would have posed a higher jumping off point into December, but the strike effects persisted into that month as well. Controlling for the combined effects of the strikes could mean Q4 GDP growth was over 2%.
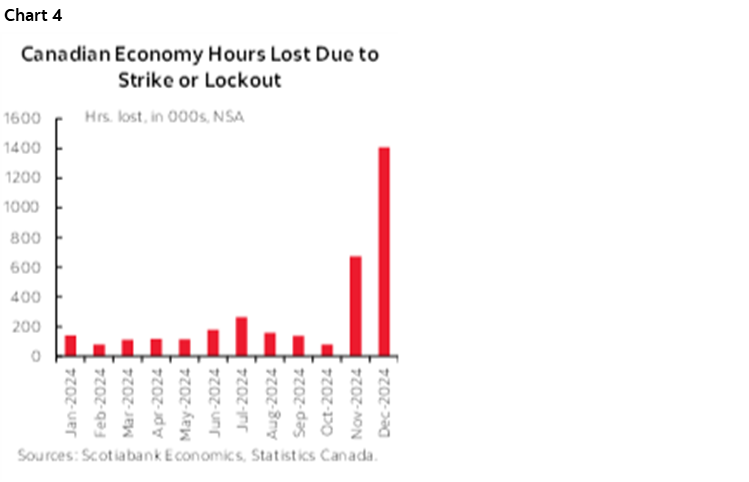
Welcome to Canada. Strikes aplenty. Surging lost hours due to strikes (chart 4). So be careful with the GDP figures. Lost hours to strikes mean folks not producing, not moving goods while they're on the picket lines or at home netflixing all day. GDP is hours worked times labour productivity and so lost hours are another way of illustrating the strike effect.
There is an interesting aside about arts/entertainment/recreation GDP. Statcan is saying it was up 0.8% m/m in November, but it's low 0.8% weight in GDP had no effect in terms of weighted contributions to growth. The sector's rise in November was a Taylor Swift effect, but held back a bit according to Statcan by lower than usual NHL attendance that month. Hockey fans choosing instead to be Swifties? Who knew?! Anytime I’ve been to a Leafs game.
DISCLAIMER
This report has been prepared by Scotiabank Economics as a resource for the clients of Scotiabank. Opinions, estimates and projections contained herein are our own as of the date hereof and are subject to change without notice. The information and opinions contained herein have been compiled or arrived at from sources believed reliable but no representation or warranty, express or implied, is made as to their accuracy or completeness. Neither Scotiabank nor any of its officers, directors, partners, employees or affiliates accepts any liability whatsoever for any direct or consequential loss arising from any use of this report or its contents.
These reports are provided to you for informational purposes only. This report is not, and is not constructed as, an offer to sell or solicitation of any offer to buy any financial instrument, nor shall this report be construed as an opinion as to whether you should enter into any swap or trading strategy involving a swap or any other transaction. The information contained in this report is not intended to be, and does not constitute, a recommendation of a swap or trading strategy involving a swap within the meaning of U.S. Commodity Futures Trading Commission Regulation 23.434 and Appendix A thereto. This material is not intended to be individually tailored to your needs or characteristics and should not be viewed as a “call to action” or suggestion that you enter into a swap or trading strategy involving a swap or any other transaction. Scotiabank may engage in transactions in a manner inconsistent with the views discussed this report and may have positions, or be in the process of acquiring or disposing of positions, referred to in this report.
Scotiabank, its affiliates and any of their respective officers, directors and employees may from time to time take positions in currencies, act as managers, co-managers or underwriters of a public offering or act as principals or agents, deal in, own or act as market makers or advisors, brokers or commercial and/or investment bankers in relation to securities or related derivatives. As a result of these actions, Scotiabank may receive remuneration. All Scotiabank products and services are subject to the terms of applicable agreements and local regulations. Officers, directors and employees of Scotiabank and its affiliates may serve as directors of corporations.
Any securities discussed in this report may not be suitable for all investors. Scotiabank recommends that investors independently evaluate any issuer and security discussed in this report, and consult with any advisors they deem necessary prior to making any investment.
This report and all information, opinions and conclusions contained in it are protected by copyright. This information may not be reproduced without the prior express written consent of Scotiabank.
™ Trademark of The Bank of Nova Scotia. Used under license, where applicable.
Scotiabank, together with “Global Banking and Markets”, is a marketing name for the global corporate and investment banking and capital markets businesses of The Bank of Nova Scotia and certain of its affiliates in the countries where they operate, including; Scotiabank Europe plc; Scotiabank (Ireland) Designated Activity Company; Scotiabank Inverlat S.A., Institución de Banca Múltiple, Grupo Financiero Scotiabank Inverlat, Scotia Inverlat Casa de Bolsa, S.A. de C.V., Grupo Financiero Scotiabank Inverlat, Scotia Inverlat Derivados S.A. de C.V. – all members of the Scotiabank group and authorized users of the Scotiabank mark. The Bank of Nova Scotia is incorporated in Canada with limited liability and is authorised and regulated by the Office of the Superintendent of Financial Institutions Canada. The Bank of Nova Scotia is authorized by the UK Prudential Regulation Authority and is subject to regulation by the UK Financial Conduct Authority and limited regulation by the UK Prudential Regulation Authority. Details about the extent of The Bank of Nova Scotia's regulation by the UK Prudential Regulation Authority are available from us on request. Scotiabank Europe plc is authorized by the UK Prudential Regulation Authority and regulated by the UK Financial Conduct Authority and the UK Prudential Regulation Authority.
Scotiabank Inverlat, S.A., Scotia Inverlat Casa de Bolsa, S.A. de C.V, Grupo Financiero Scotiabank Inverlat, and Scotia Inverlat Derivados, S.A. de C.V., are each authorized and regulated by the Mexican financial authorities.
Not all products and services are offered in all jurisdictions. Services described are available in jurisdictions where permitted by law.