- Job growth met expectations
- The unemployment rate edged higher
- Wage growth picked up
- Hours worked are reinforcing weak Q1 GDP tracking
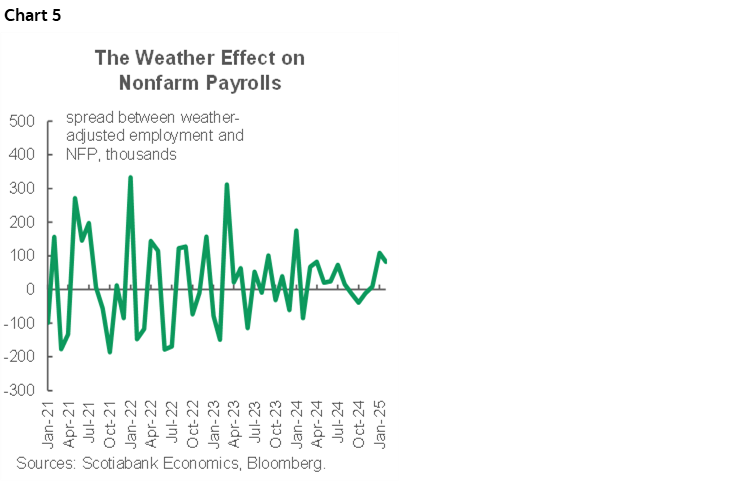
- Weather adjustments knocked 190k off job growth so far this year
- A record low seasonal adjustment factor is tough to believe…
- ...but played a dominant role in understating job growth
- US nonfarm payrolls, m/m 000s // UR %, February, SA:
- Actual: 151 / 4.1
- Scotia: 140 / 4.1
- Consensus: 160 / 4.0
- Prior: 125 / 4.0 (revised from 125 / 4.0)
The rise of 151,000 payrolls generally met expectations. There was a wide variation across estimates that ranged from 30k to 300k, but the tally met my expectations and the median consensus estimate. Weather and seasonal adjustments offer two strong reasons to believe that underlying job growth was stronger than it appeared.
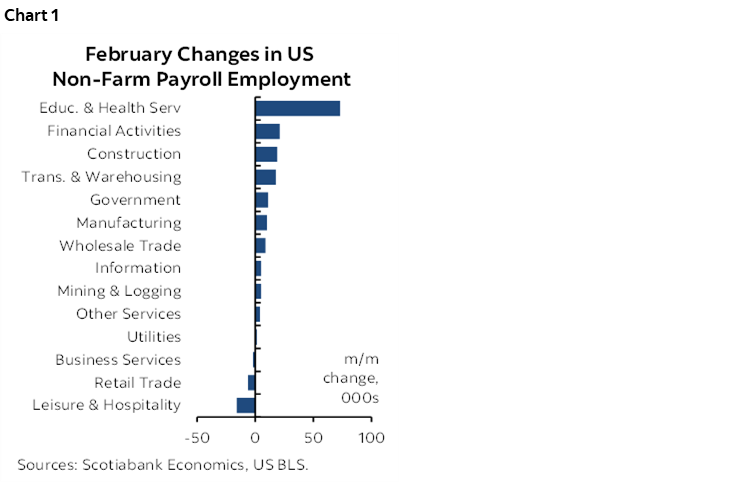
Education and health drove most of the gain (chart 1). This measures the private sector readings and the sectors added 73k jobs. Healthcare and social assistance was up 63k with education up by about 10k. Leisure/hospitality jobs were the only notable decline and probably due to weather.
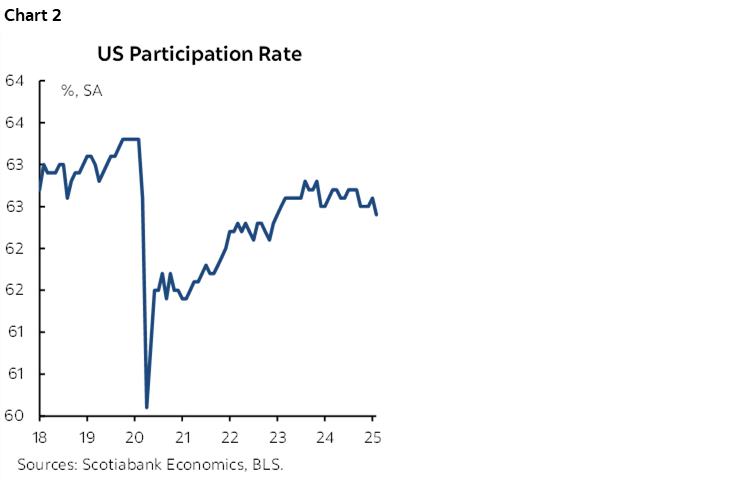
The unemployment rate edged up a tick above consensus and matching my estimate. That was because the drop in employment derived from the household survey (-588k) exceeded shrinkage in the workforce (-385k). The participation rate has been on a mild downward trend (chart 2).
Revisions were immaterial at –2k to the prior two months combined as an 18k downward revision to January was offset by an upward revision in December.
Government jobs were little changed at +11k. The Federal government shed 10k, but state and local governments added an offsetting 21k. Expect more of this as DOGE cutting hits federal payrolls in future months but downloading of services onto state and local governments may insulate against some of this effect.
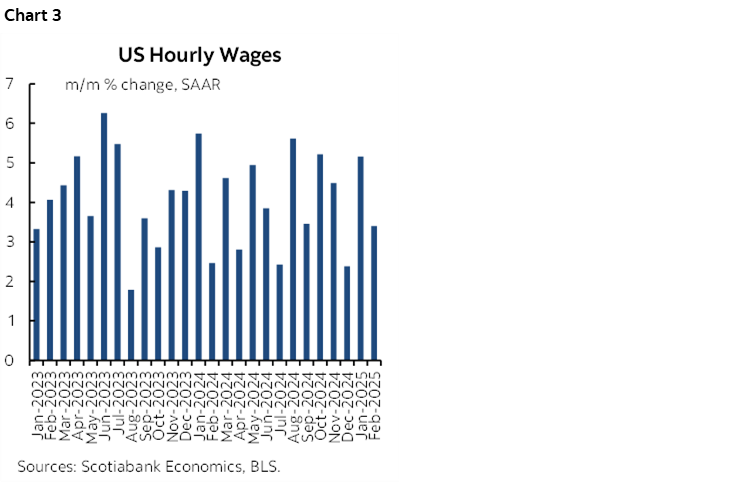
Wage growth landed at 3.4% m/m SAAR which slowed the 3-month moving to 3.65% (chart 3).
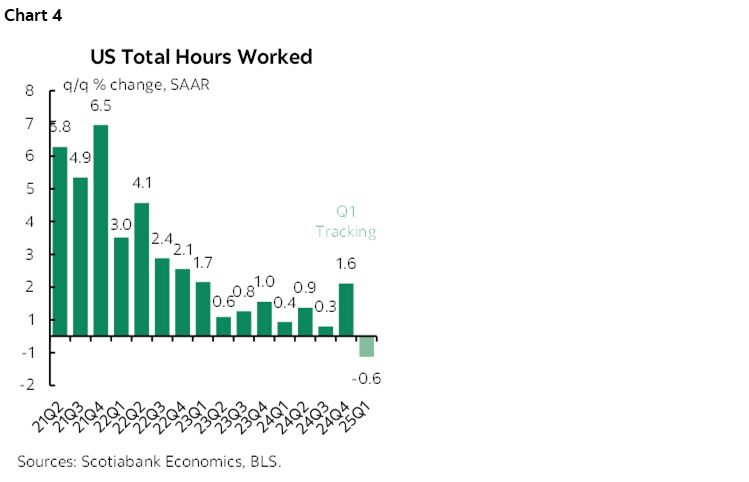
Hours worked were little changed at +0.1% m/m SA and are tracking a mild decline of –0.6% q/q SAAR in Q1 (chart 4). This reinforces expectations for Q1 GDP to shrink, as GDP is an identity defined as hours times labour productivity.
Two Reasons to Ignore the Report
Why ignore? Weather for one. 404,000 Americans were unable to work due to weather which was more than usual for a second straight month. Cold and snow—even in New Orleans!—explained much of this. Chart 5 shows that weather adjustment payrolls would have been about 82k higher last month and 108k higher in January.
Secondly, while the seasonally unadjusted job gain was roughly normal for a month of February (chart 6), the seasonal adjustment factor tamped that down with a record low SA factor (chart 7).
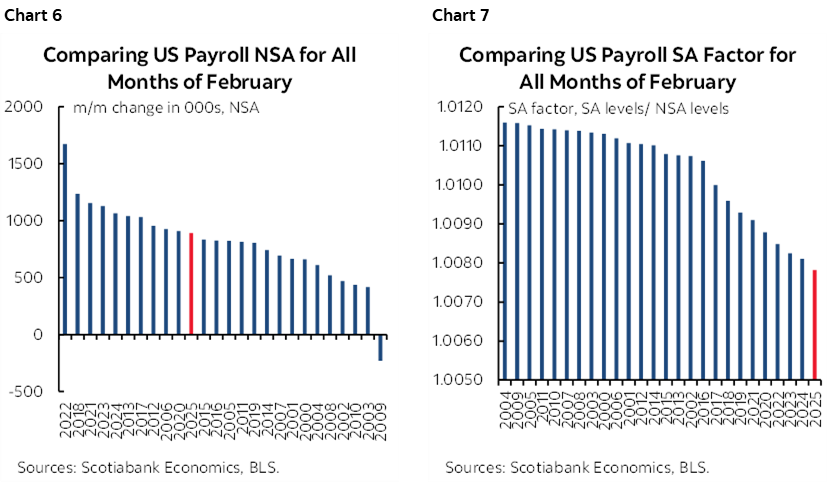
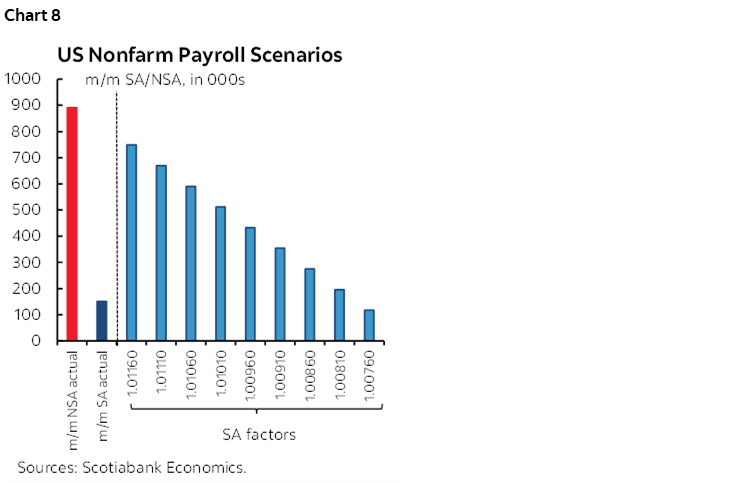
Chart 8 shows what would have happened to job growth at less punishing SA factors. It would have been materially stronger.
Markets and the FOMC
There wasn’t much of a market reaction in S&P futures after the 8:30amET report, or in two-year Treasury yields. That reflected the lack of any material surprise in the reading.
Fed Chair Powell speaks shortly (12:30pmET) on the economic outlook. I don’t think this report will raise any concerns. He likely knows that tighter immigration policy is going to put downward pressure upon the breakeven rate of monthly job creation that preserves a reasonably stable unemployment rate subject to how government job reductions get phased into payrolls relative to private sector momentum. I expect more of his focus will be upon inflation risk and to continue to apply a patient bias.
DISCLAIMER
This report has been prepared by Scotiabank Economics as a resource for the clients of Scotiabank. Opinions, estimates and projections contained herein are our own as of the date hereof and are subject to change without notice. The information and opinions contained herein have been compiled or arrived at from sources believed reliable but no representation or warranty, express or implied, is made as to their accuracy or completeness. Neither Scotiabank nor any of its officers, directors, partners, employees or affiliates accepts any liability whatsoever for any direct or consequential loss arising from any use of this report or its contents.
These reports are provided to you for informational purposes only. This report is not, and is not constructed as, an offer to sell or solicitation of any offer to buy any financial instrument, nor shall this report be construed as an opinion as to whether you should enter into any swap or trading strategy involving a swap or any other transaction. The information contained in this report is not intended to be, and does not constitute, a recommendation of a swap or trading strategy involving a swap within the meaning of U.S. Commodity Futures Trading Commission Regulation 23.434 and Appendix A thereto. This material is not intended to be individually tailored to your needs or characteristics and should not be viewed as a “call to action” or suggestion that you enter into a swap or trading strategy involving a swap or any other transaction. Scotiabank may engage in transactions in a manner inconsistent with the views discussed this report and may have positions, or be in the process of acquiring or disposing of positions, referred to in this report.
Scotiabank, its affiliates and any of their respective officers, directors and employees may from time to time take positions in currencies, act as managers, co-managers or underwriters of a public offering or act as principals or agents, deal in, own or act as market makers or advisors, brokers or commercial and/or investment bankers in relation to securities or related derivatives. As a result of these actions, Scotiabank may receive remuneration. All Scotiabank products and services are subject to the terms of applicable agreements and local regulations. Officers, directors and employees of Scotiabank and its affiliates may serve as directors of corporations.
Any securities discussed in this report may not be suitable for all investors. Scotiabank recommends that investors independently evaluate any issuer and security discussed in this report, and consult with any advisors they deem necessary prior to making any investment.
This report and all information, opinions and conclusions contained in it are protected by copyright. This information may not be reproduced without the prior express written consent of Scotiabank.
™ Trademark of The Bank of Nova Scotia. Used under license, where applicable.
Scotiabank, together with “Global Banking and Markets”, is a marketing name for the global corporate and investment banking and capital markets businesses of The Bank of Nova Scotia and certain of its affiliates in the countries where they operate, including; Scotiabank Europe plc; Scotiabank (Ireland) Designated Activity Company; Scotiabank Inverlat S.A., Institución de Banca Múltiple, Grupo Financiero Scotiabank Inverlat, Scotia Inverlat Casa de Bolsa, S.A. de C.V., Grupo Financiero Scotiabank Inverlat, Scotia Inverlat Derivados S.A. de C.V. – all members of the Scotiabank group and authorized users of the Scotiabank mark. The Bank of Nova Scotia is incorporated in Canada with limited liability and is authorised and regulated by the Office of the Superintendent of Financial Institutions Canada. The Bank of Nova Scotia is authorized by the UK Prudential Regulation Authority and is subject to regulation by the UK Financial Conduct Authority and limited regulation by the UK Prudential Regulation Authority. Details about the extent of The Bank of Nova Scotia's regulation by the UK Prudential Regulation Authority are available from us on request. Scotiabank Europe plc is authorized by the UK Prudential Regulation Authority and regulated by the UK Financial Conduct Authority and the UK Prudential Regulation Authority.
Scotiabank Inverlat, S.A., Scotia Inverlat Casa de Bolsa, S.A. de C.V, Grupo Financiero Scotiabank Inverlat, and Scotia Inverlat Derivados, S.A. de C.V., are each authorized and regulated by the Mexican financial authorities.
Not all products and services are offered in all jurisdictions. Services described are available in jurisdictions where permitted by law.