- BoC’s preferred core inflation measures were hot again…
- ...and exclude the effects of the GST/HST change…
- ...that itself only drove about one-third of the headline month-over-month surge
- Ten months of still too hot core inflation merit a stop to monetary easing...
- ...as the BoC faces further near-term pressures on inflation
- Canada CPI m/m %, February, NSA:
- Actual: 1.1 / 2.7
- Scotia: 1.1 / 2.6
- Consensus: 0.6 / 2.2
- Prior: 0.1 / 1.9
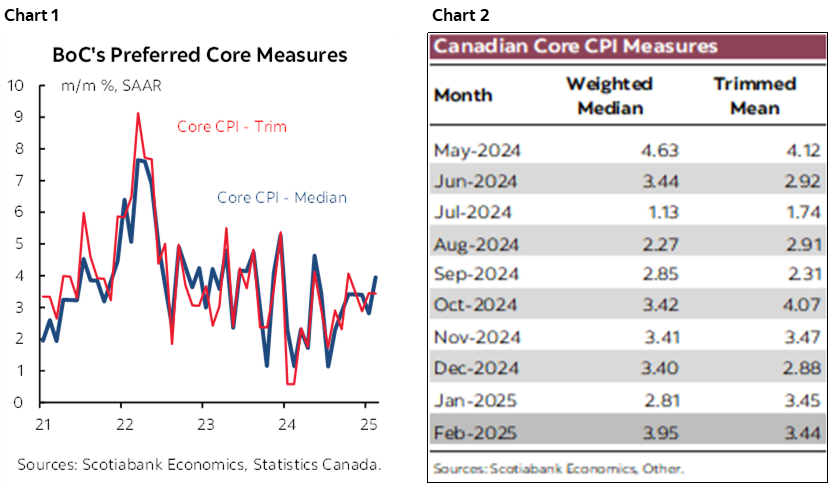
- Core inflation, February, m/m % SAAR:
- Trimmed mean CPI: 4.0
- Weighted median CPI: 3.4
Canadian inflation spiked higher and further reduces prospects for additional rate cuts by the Bank of Canada. The readings matched Scotiabank Economics’ expectations. The end of the GST/HST cut was only a modest part of the explanation. The bigger issue is that the BoC’s preferred core readings—that exclude taxes—were hot again.
USDCAD shook it off but that was because the impact of Canadian data coincided with stronger than expected US data for housing starts, industrial output and import prices. Canada’s two-year yield climbed only 1–2bps and may not have understood the drivers. Under a third of a 25bps rate cut is priced for the April meeting and is probably too much.
The BoC is Making Inflation Hot Again
The BoC’s preferred core measures of inflation are shown in charts 1 and 2. This latest reading is no flash in the pan. They show the readings in month-over-month terms at a seasonally adjusted and annualized rate in order to capture inflation pressures using the most timely measures. They are simply too hot and have been too hot in a long stretch back to last May. The longstanding trend points to readings that are clearly saying that the BoC’s work is not done. They question why the BoC—an inflation-targeting central bank—has been in such a rush to cut to 2.75% for 275bps of easing to date.
Core inflation has yet to show a convincing pattern of lagging disinflation to the emergence of a small amount of slack in the economy and that should merit the BoC ending cuts for some time especially amid the looming effects of tariffs on inflation and rising inflation expectations. More near-term pressure lies ahead as written in my weekly (here).
Limited Impact of the GST/HST Cut
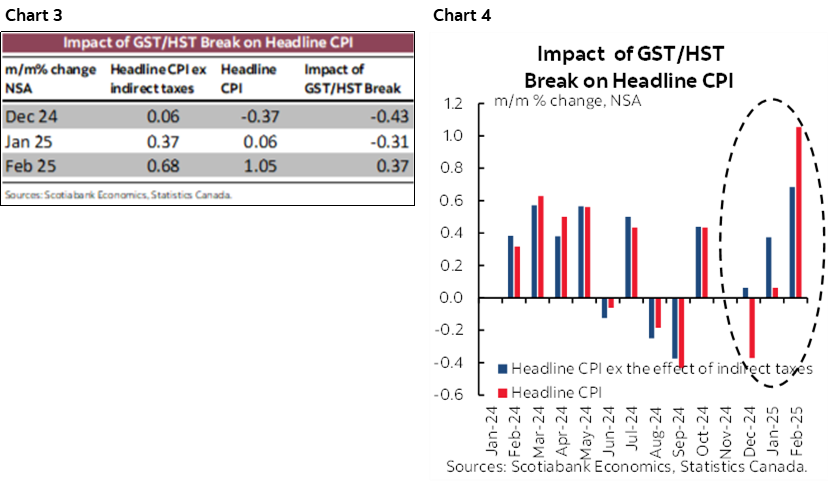
The spread between headline CPI and CPI excluding the effects of indirect taxes like the GST/HST was 0.37% m/m in February (charts 3–4). This means that of the 1.1% m/m rise in CPI, seven-tenths was due to other factors. If markets only reacted mildly because they thought the inflation surge was due to the GST/HST then that’s incorrect. The tax effect on February CPI mirrored the way down starting in December when the tax was first cut. There is probably another +0.3–0.4 impact of the end of the GST/HST cut coming in March CPI due on April 15th.
Widespread Pressures
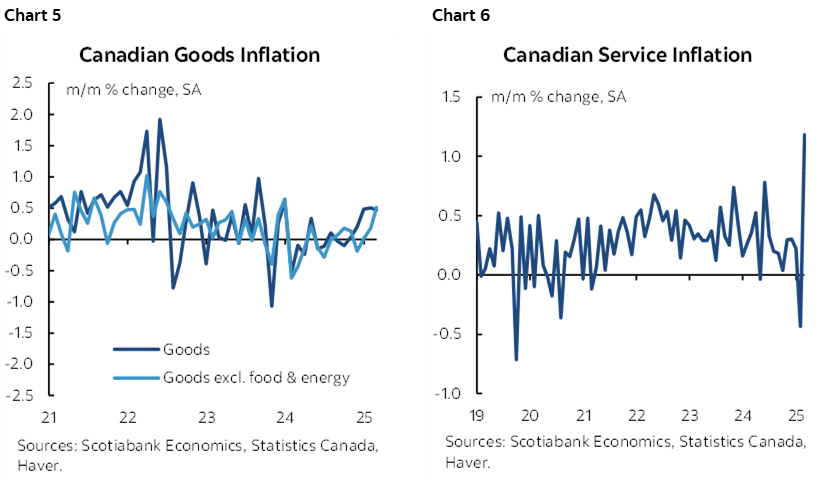
Charts 5 and 6 show the acceleration in goods and services prices. Unlike the trimmed mean and weighted median measures, these aggregates cannot exclude the effects of changes in indirect taxes like the GST/HST and so interpret with care as a modest amount of their acceleration was due to the tax cut. Statcan estimates that the GST/HST applies to about 10% of the overall CPI basket.
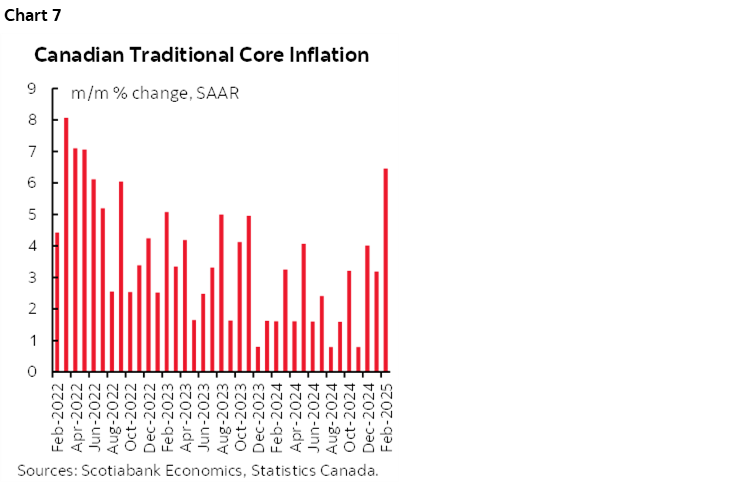
Traditional core CPI ex-f&e also soared, but unlike the trimmed mean and weighted median measures this one does not exclude the effect of changes in indirect taxes (chart 7).
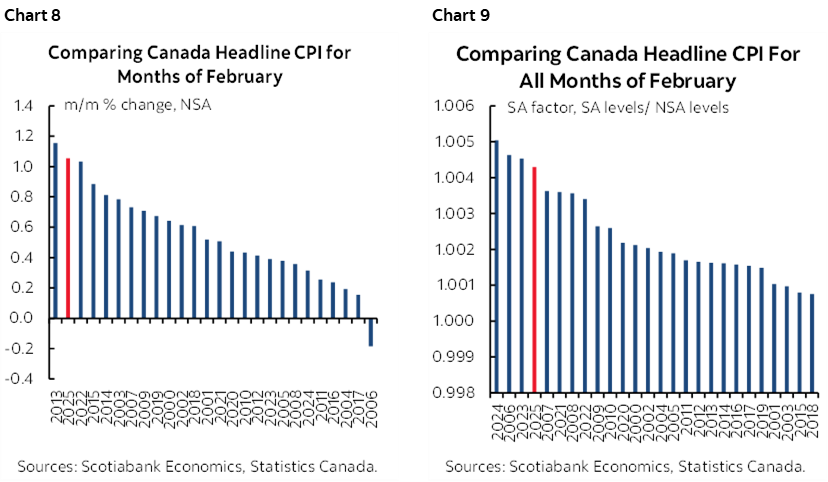
The Worst Possible Combination of Effects
Charts 8–9 show that this February had among the highest seasonal adjustment factors on record compared to like months of February and that this combined with among the highest seasonally unadjusted gains on record when comparing like months of February over time.
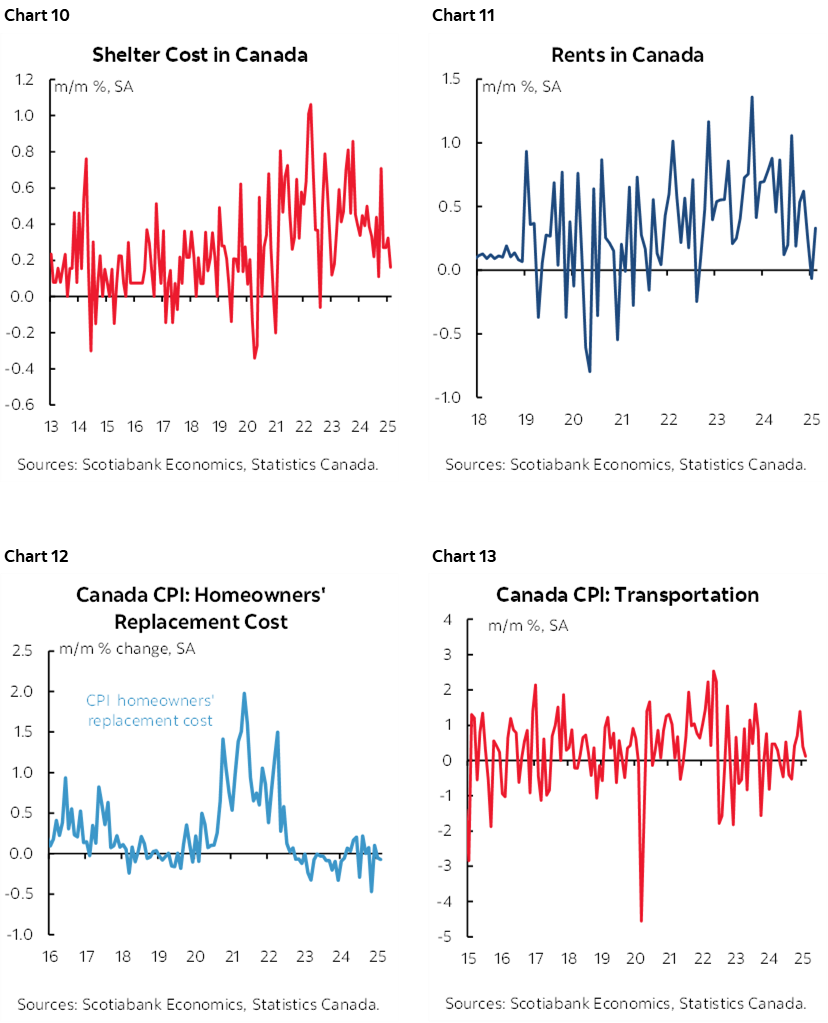
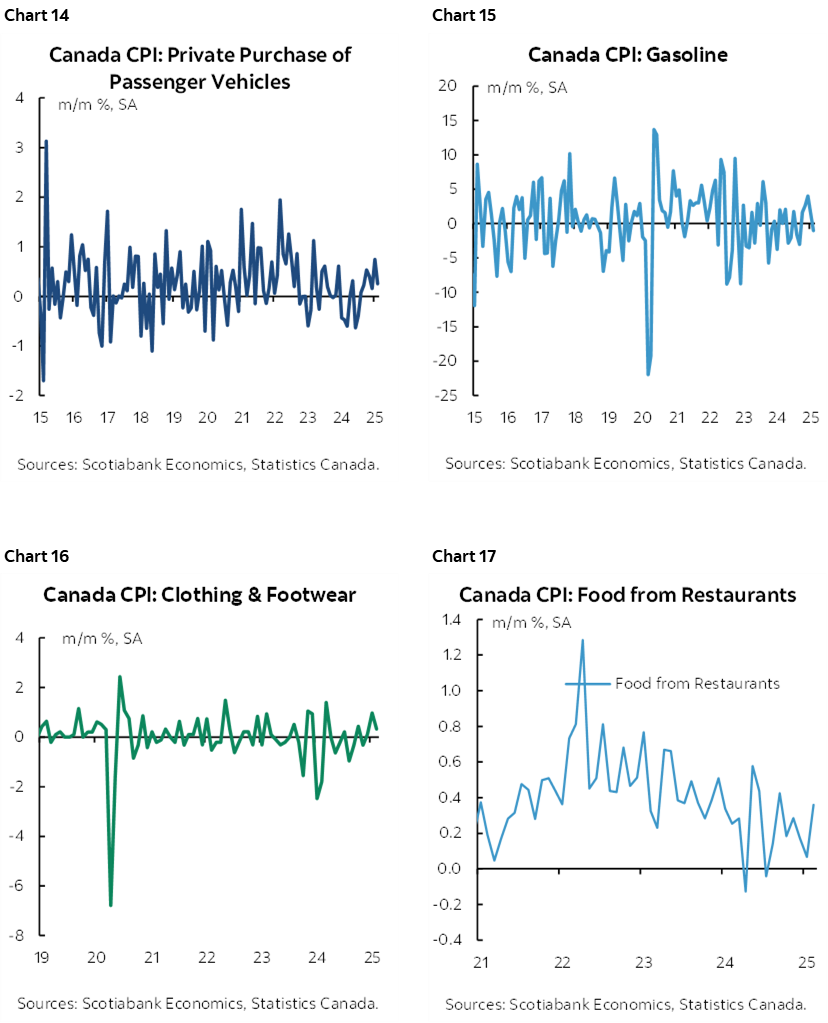
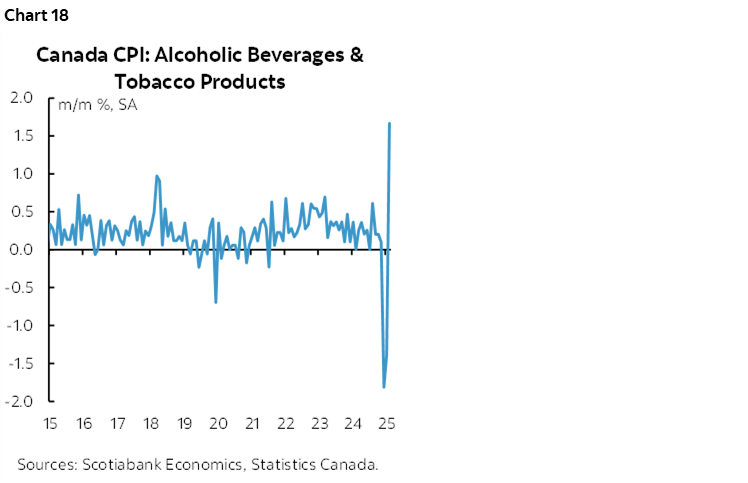
Details
Charts 10–18 break down the basket into more individual components. Interpret them with care as the measures in these charts include the effects of changes in indirect taxes, though obviously more so in some cases, like food, than in others, like shelter while recalling the limited application of the GST/HST cut. Key is that shelter was not the driver this month as shelter price inflation ebbed. This has been an overstated excuse for persistent inflation.
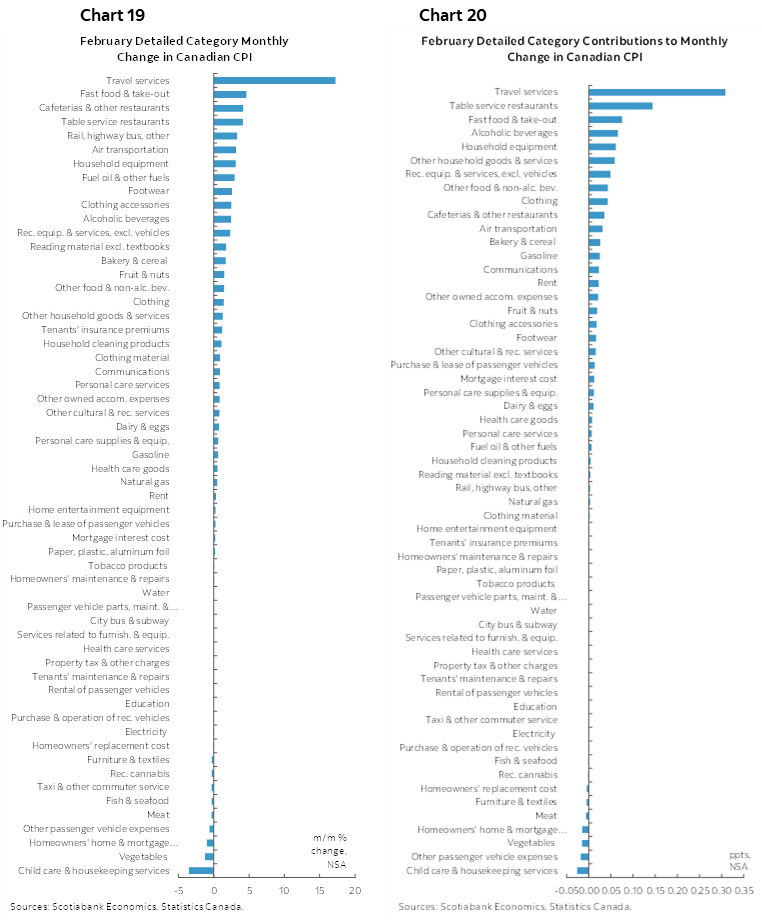
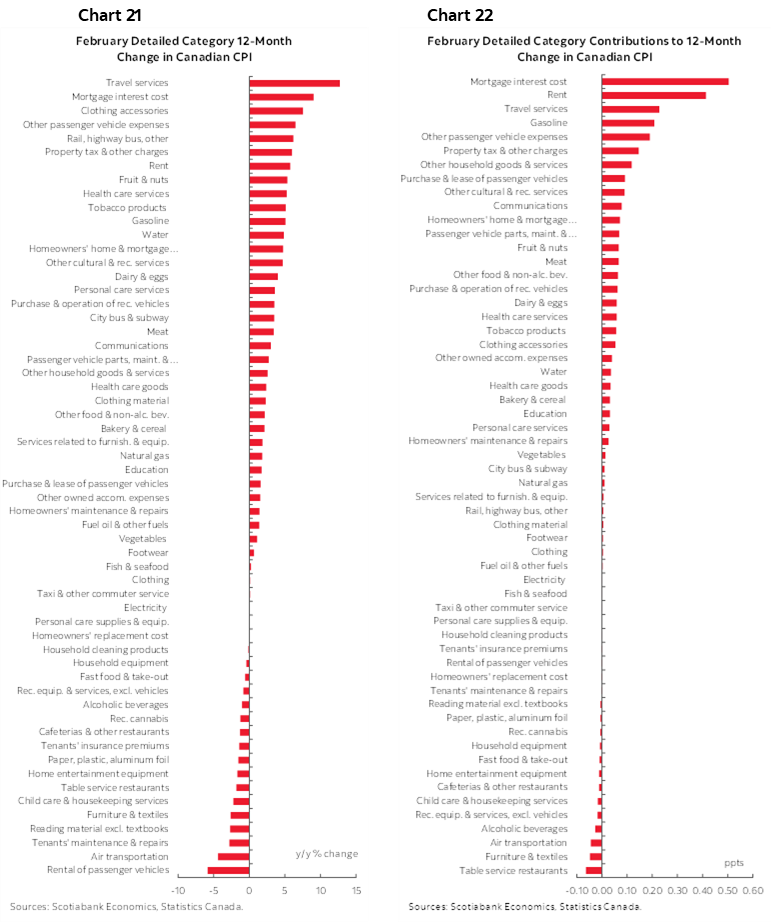
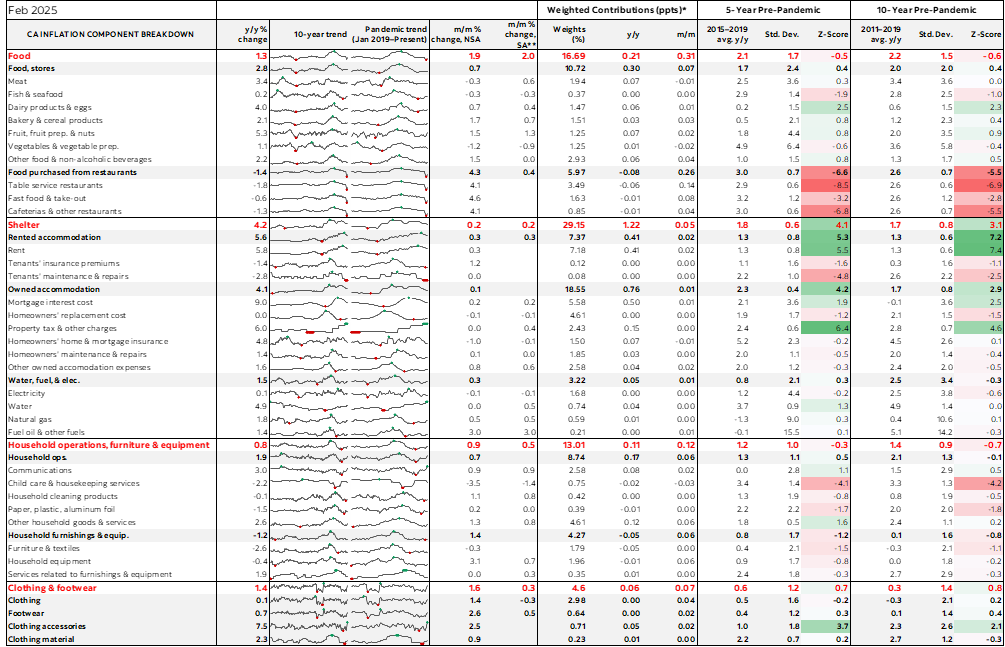
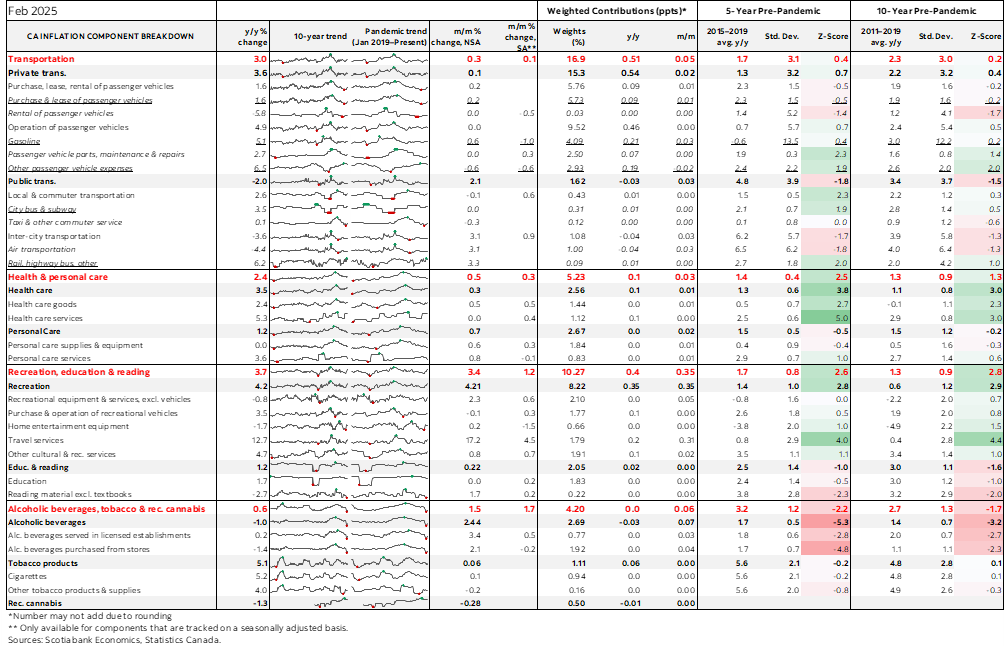
Charts 19–20 break down the CPI basket in detail using m/m measures and weighted contributions to the overall m/m CPI rate of inflation. Charts 21–22 do likewise in y/y terms. Also see the accompanying table that provides further detail, micro charts, and measures of dispersion.
DISCLAIMER
This report has been prepared by Scotiabank Economics as a resource for the clients of Scotiabank. Opinions, estimates and projections contained herein are our own as of the date hereof and are subject to change without notice. The information and opinions contained herein have been compiled or arrived at from sources believed reliable but no representation or warranty, express or implied, is made as to their accuracy or completeness. Neither Scotiabank nor any of its officers, directors, partners, employees or affiliates accepts any liability whatsoever for any direct or consequential loss arising from any use of this report or its contents.
These reports are provided to you for informational purposes only. This report is not, and is not constructed as, an offer to sell or solicitation of any offer to buy any financial instrument, nor shall this report be construed as an opinion as to whether you should enter into any swap or trading strategy involving a swap or any other transaction. The information contained in this report is not intended to be, and does not constitute, a recommendation of a swap or trading strategy involving a swap within the meaning of U.S. Commodity Futures Trading Commission Regulation 23.434 and Appendix A thereto. This material is not intended to be individually tailored to your needs or characteristics and should not be viewed as a “call to action” or suggestion that you enter into a swap or trading strategy involving a swap or any other transaction. Scotiabank may engage in transactions in a manner inconsistent with the views discussed this report and may have positions, or be in the process of acquiring or disposing of positions, referred to in this report.
Scotiabank, its affiliates and any of their respective officers, directors and employees may from time to time take positions in currencies, act as managers, co-managers or underwriters of a public offering or act as principals or agents, deal in, own or act as market makers or advisors, brokers or commercial and/or investment bankers in relation to securities or related derivatives. As a result of these actions, Scotiabank may receive remuneration. All Scotiabank products and services are subject to the terms of applicable agreements and local regulations. Officers, directors and employees of Scotiabank and its affiliates may serve as directors of corporations.
Any securities discussed in this report may not be suitable for all investors. Scotiabank recommends that investors independently evaluate any issuer and security discussed in this report, and consult with any advisors they deem necessary prior to making any investment.
This report and all information, opinions and conclusions contained in it are protected by copyright. This information may not be reproduced without the prior express written consent of Scotiabank.
™ Trademark of The Bank of Nova Scotia. Used under license, where applicable.
Scotiabank, together with “Global Banking and Markets”, is a marketing name for the global corporate and investment banking and capital markets businesses of The Bank of Nova Scotia and certain of its affiliates in the countries where they operate, including; Scotiabank Europe plc; Scotiabank (Ireland) Designated Activity Company; Scotiabank Inverlat S.A., Institución de Banca Múltiple, Grupo Financiero Scotiabank Inverlat, Scotia Inverlat Casa de Bolsa, S.A. de C.V., Grupo Financiero Scotiabank Inverlat, Scotia Inverlat Derivados S.A. de C.V. – all members of the Scotiabank group and authorized users of the Scotiabank mark. The Bank of Nova Scotia is incorporated in Canada with limited liability and is authorised and regulated by the Office of the Superintendent of Financial Institutions Canada. The Bank of Nova Scotia is authorized by the UK Prudential Regulation Authority and is subject to regulation by the UK Financial Conduct Authority and limited regulation by the UK Prudential Regulation Authority. Details about the extent of The Bank of Nova Scotia's regulation by the UK Prudential Regulation Authority are available from us on request. Scotiabank Europe plc is authorized by the UK Prudential Regulation Authority and regulated by the UK Financial Conduct Authority and the UK Prudential Regulation Authority.
Scotiabank Inverlat, S.A., Scotia Inverlat Casa de Bolsa, S.A. de C.V, Grupo Financiero Scotiabank Inverlat, and Scotia Inverlat Derivados, S.A. de C.V., are each authorized and regulated by the Mexican financial authorities.
Not all products and services are offered in all jurisdictions. Services described are available in jurisdictions where permitted by law.