- US core inflation slightly exceeded expectations
- Core services inflation accelerated
- The minor upside surprise rules at upsizing next week
- US CPI / core CPI, m/m % SA, August:
- Actual: 0.2 / 0.3
- Scotia: 0.2 / 0.2
- Consensus: 0.2 / 0.2
- Prior: 0.2 / 0.2
US core inflation picked up a touch last month and this finally rejects supersizing Fed cuts. There is no reason to supersize a cut next week versus sticking to the gradual mantra. Barring major developments, I can’t see a fifty move at all this year so pricing is too rich.
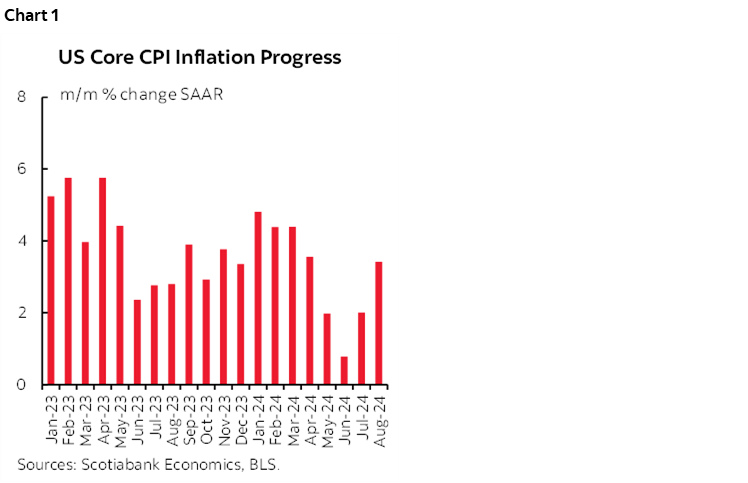
Core inflation was up by 0.28% m/m SA which rounds up to 0.3% on market screens. That was roughly a tick above just about everyone’s calls and while it doesn’t happen often, the Cleveland Fed’s nowcast was the raffle winner this time. The annualized rate was 3.4% m/m SAAR which is the highest since April (chart 1).
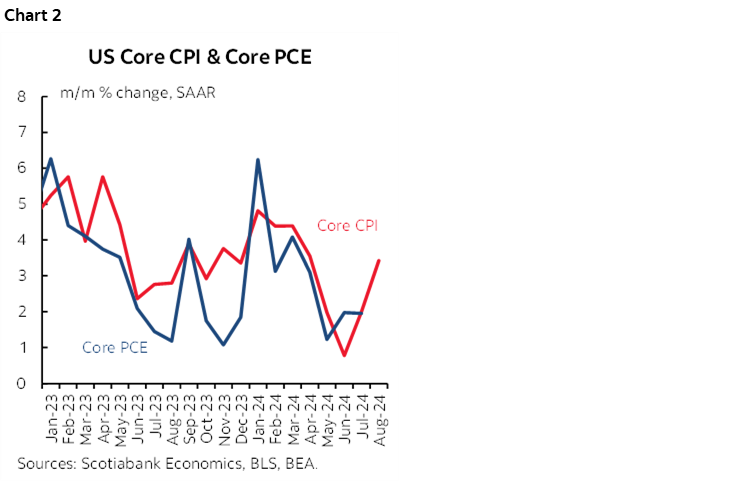
Expect core PCE to follow core CPI higher on September 27th (chart 2).
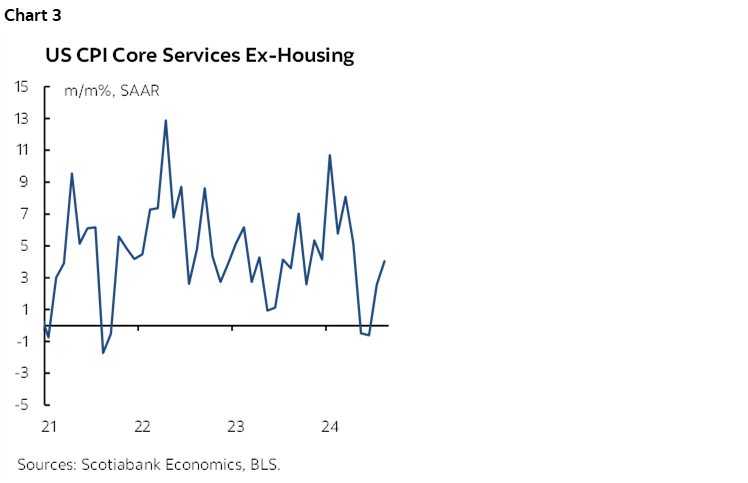
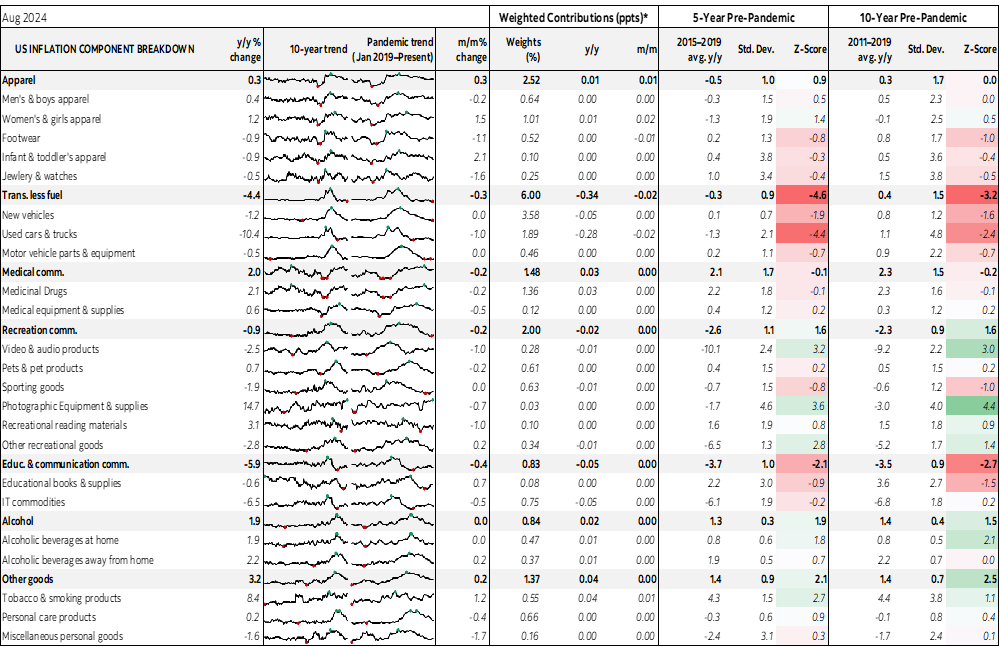
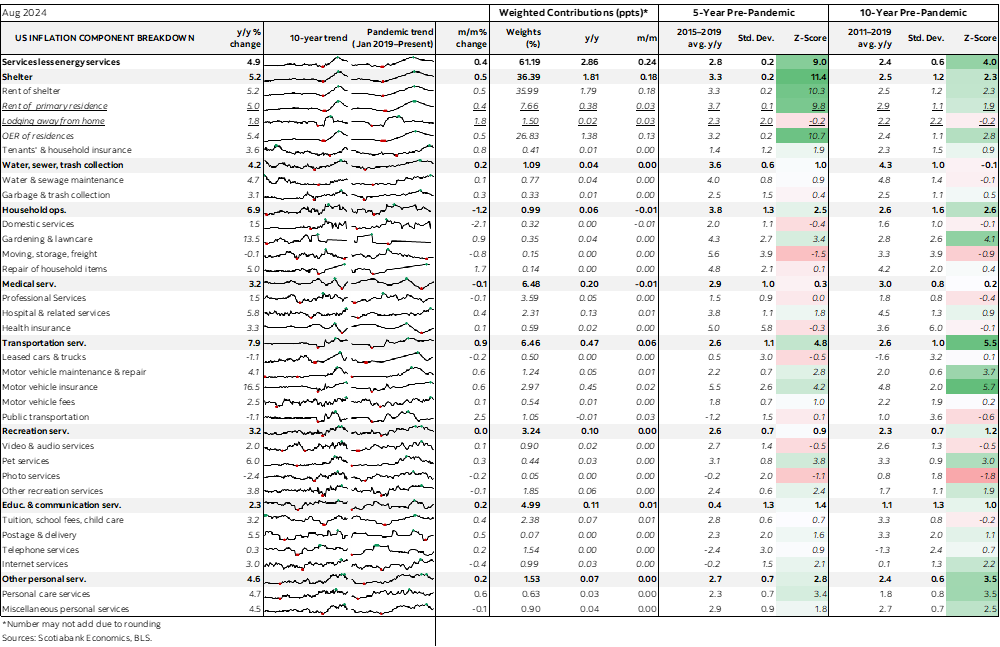
The culprit was a mild acceleration of core services prices. CPI services ex-housing and energy services was up by 0.33% m/m SA which is the firmest reading since April (chart 3). Services ex-energy services were up 0.4%.
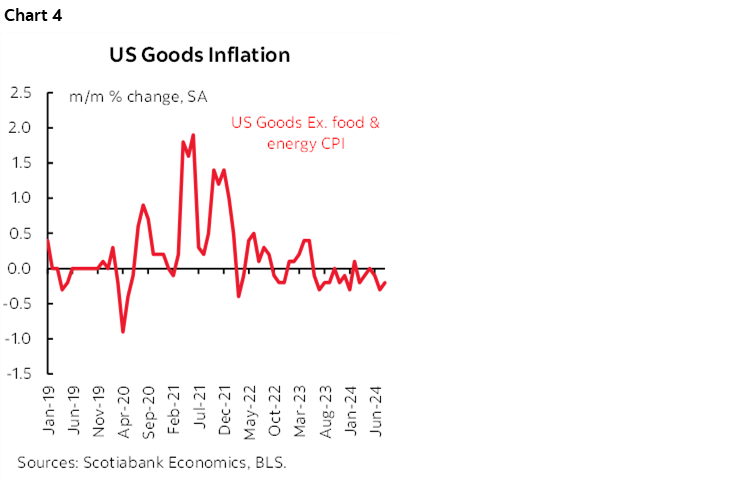
CPI goods ex-food and energy was weak again, down -0.2% m/m SA (chart 4).
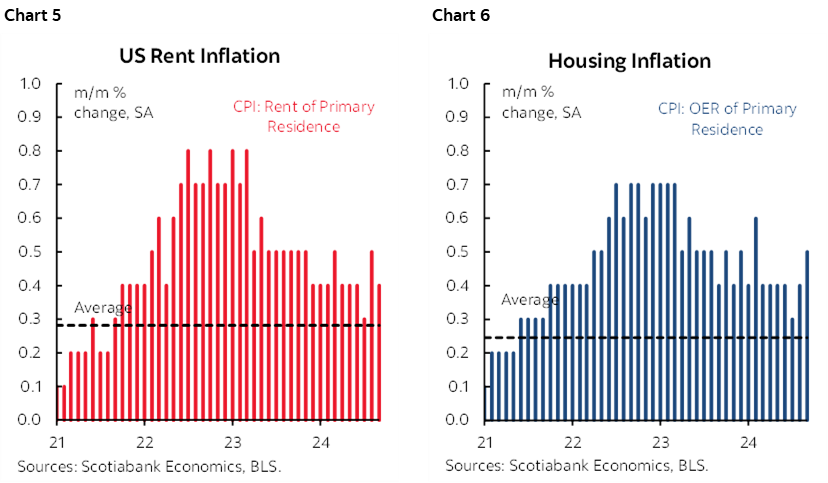
A key driver remains shelter prices that were up by 0.5% m/m SA with rent of primary residence up by 0.5%, and owners’ equivalent rent up 0.5% (charts 5, 6).
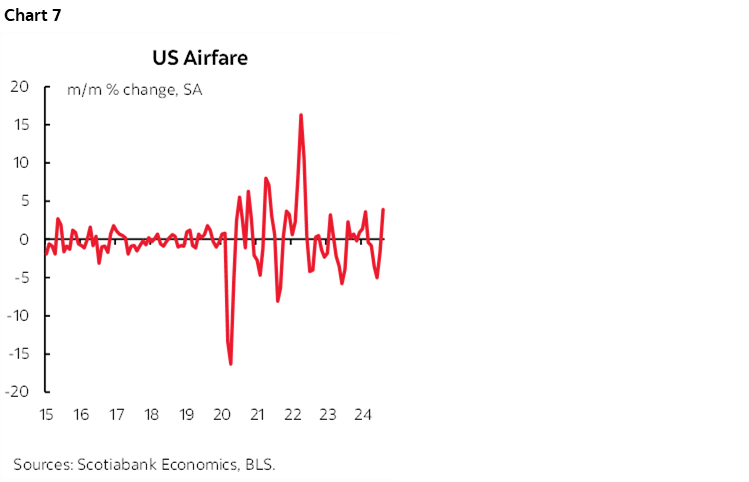
Airfare popped higher by +3.9% m/m against a trend of persistent declines over prior months (chart 7).
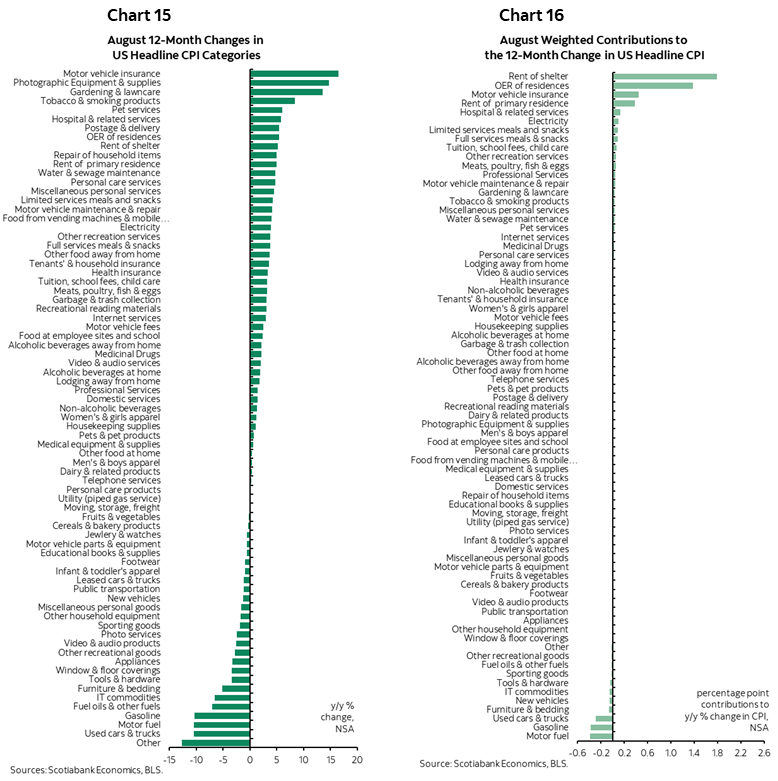
Other categories offered little by way of surprises. Gas fell by -0.6% m/m SA. New vehicles prices were down by -0.3% m/m SA, with used vehicles down -1% m/m SA. Groceries ("food at home") were flat. Eating-out proxies ("food away from home" that also includes cafeterias etc) increased by +0.3% m/m SA, extending the string of similar gains.
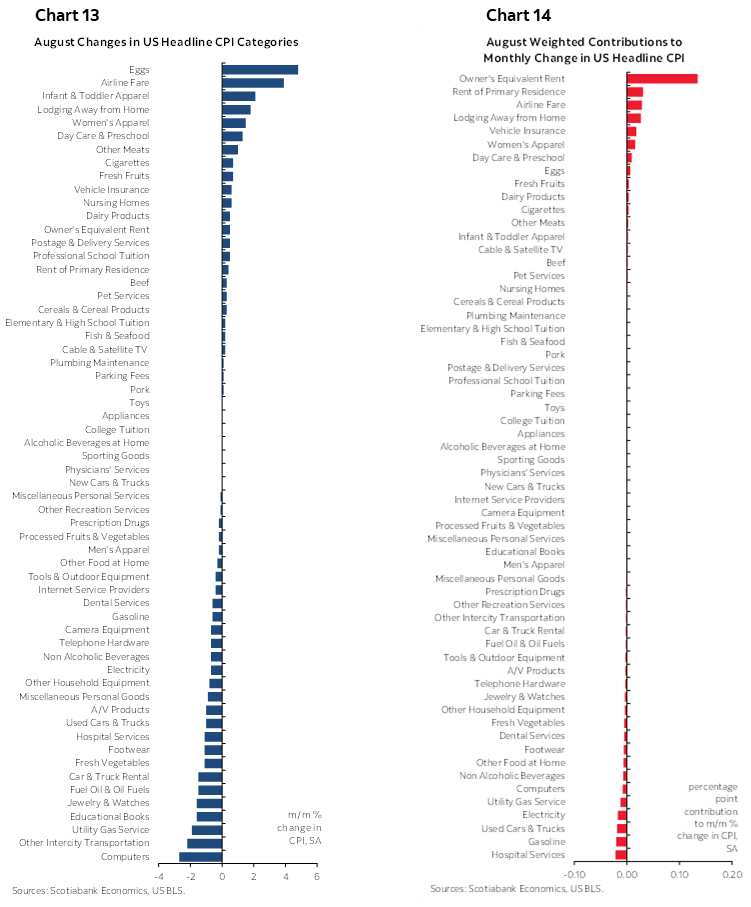
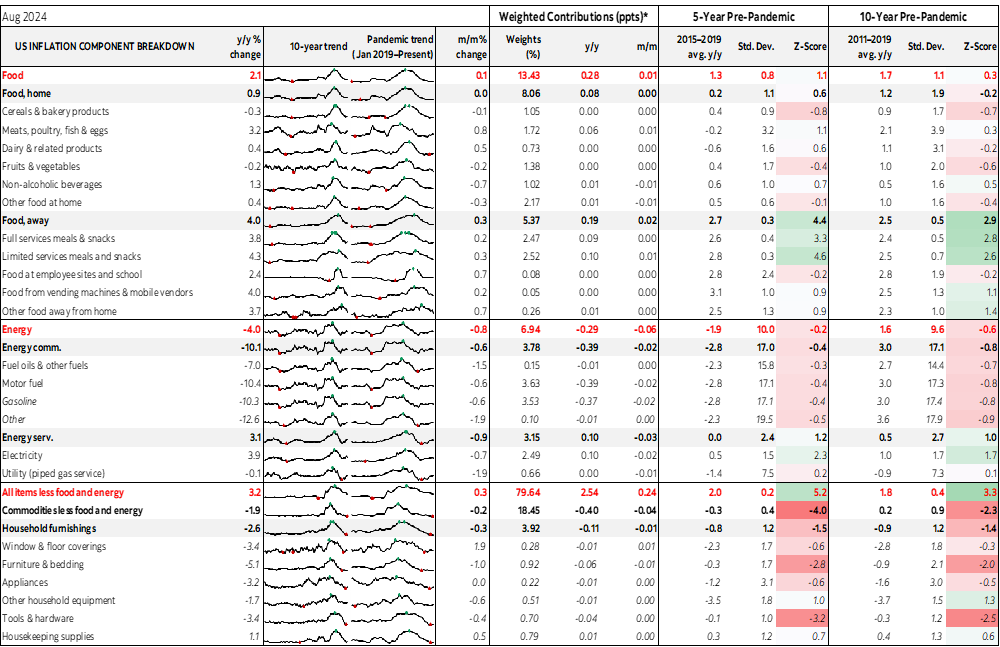
See the accompanying charts and tables for more details.

DISCLAIMER
This report has been prepared by Scotiabank Economics as a resource for the clients of Scotiabank. Opinions, estimates and projections contained herein are our own as of the date hereof and are subject to change without notice. The information and opinions contained herein have been compiled or arrived at from sources believed reliable but no representation or warranty, express or implied, is made as to their accuracy or completeness. Neither Scotiabank nor any of its officers, directors, partners, employees or affiliates accepts any liability whatsoever for any direct or consequential loss arising from any use of this report or its contents.
These reports are provided to you for informational purposes only. This report is not, and is not constructed as, an offer to sell or solicitation of any offer to buy any financial instrument, nor shall this report be construed as an opinion as to whether you should enter into any swap or trading strategy involving a swap or any other transaction. The information contained in this report is not intended to be, and does not constitute, a recommendation of a swap or trading strategy involving a swap within the meaning of U.S. Commodity Futures Trading Commission Regulation 23.434 and Appendix A thereto. This material is not intended to be individually tailored to your needs or characteristics and should not be viewed as a “call to action” or suggestion that you enter into a swap or trading strategy involving a swap or any other transaction. Scotiabank may engage in transactions in a manner inconsistent with the views discussed this report and may have positions, or be in the process of acquiring or disposing of positions, referred to in this report.
Scotiabank, its affiliates and any of their respective officers, directors and employees may from time to time take positions in currencies, act as managers, co-managers or underwriters of a public offering or act as principals or agents, deal in, own or act as market makers or advisors, brokers or commercial and/or investment bankers in relation to securities or related derivatives. As a result of these actions, Scotiabank may receive remuneration. All Scotiabank products and services are subject to the terms of applicable agreements and local regulations. Officers, directors and employees of Scotiabank and its affiliates may serve as directors of corporations.
Any securities discussed in this report may not be suitable for all investors. Scotiabank recommends that investors independently evaluate any issuer and security discussed in this report, and consult with any advisors they deem necessary prior to making any investment.
This report and all information, opinions and conclusions contained in it are protected by copyright. This information may not be reproduced without the prior express written consent of Scotiabank.
™ Trademark of The Bank of Nova Scotia. Used under license, where applicable.
Scotiabank, together with “Global Banking and Markets”, is a marketing name for the global corporate and investment banking and capital markets businesses of The Bank of Nova Scotia and certain of its affiliates in the countries where they operate, including; Scotiabank Europe plc; Scotiabank (Ireland) Designated Activity Company; Scotiabank Inverlat S.A., Institución de Banca Múltiple, Grupo Financiero Scotiabank Inverlat, Scotia Inverlat Casa de Bolsa, S.A. de C.V., Grupo Financiero Scotiabank Inverlat, Scotia Inverlat Derivados S.A. de C.V. – all members of the Scotiabank group and authorized users of the Scotiabank mark. The Bank of Nova Scotia is incorporated in Canada with limited liability and is authorised and regulated by the Office of the Superintendent of Financial Institutions Canada. The Bank of Nova Scotia is authorized by the UK Prudential Regulation Authority and is subject to regulation by the UK Financial Conduct Authority and limited regulation by the UK Prudential Regulation Authority. Details about the extent of The Bank of Nova Scotia's regulation by the UK Prudential Regulation Authority are available from us on request. Scotiabank Europe plc is authorized by the UK Prudential Regulation Authority and regulated by the UK Financial Conduct Authority and the UK Prudential Regulation Authority.
Scotiabank Inverlat, S.A., Scotia Inverlat Casa de Bolsa, S.A. de C.V, Grupo Financiero Scotiabank Inverlat, and Scotia Inverlat Derivados, S.A. de C.V., are each authorized and regulated by the Mexican financial authorities.
Not all products and services are offered in all jurisdictions. Services described are available in jurisdictions where permitted by law.