
Risk Dashboard for Dec. 26–Jan. 6
- Inflation strikes cookies, carrots & milk!
- Monitoring China’s supply chains
- Are nonfarm payrolls overestimating jobs?
- Are Canadian jobs still resilient?
- US, Canadian wage pressures
- FOMC minutes
- EZ CPI: peaking headline, not core?
- Other macro
Chart of the Week
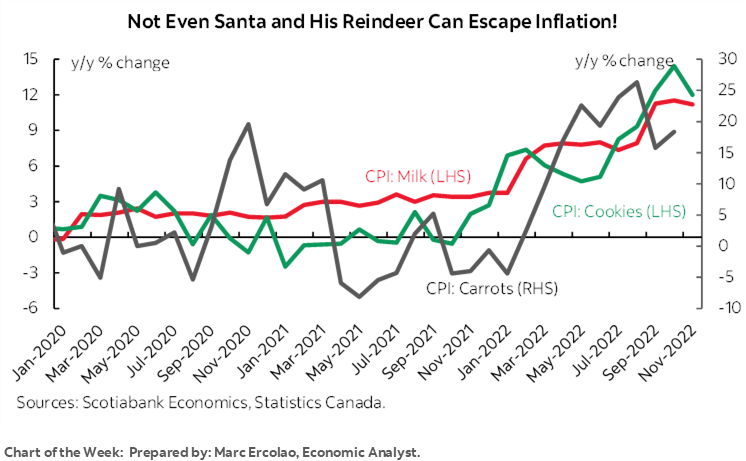
I would like to start by wishing our clients, staff and friends the very best of the holiday season and the fast-approaching new year. With inflation on everyone’s minds, it may be small comfort that Marc Ercolao’s playful chart-of-the-week on the front cover shows that not even Santa Clause has been able to escape inflation! It’s my sincere hope that all of you achieve your goals and enjoy a healthy and happy 2023 as we work together to manage through the challenges that lay ahead.
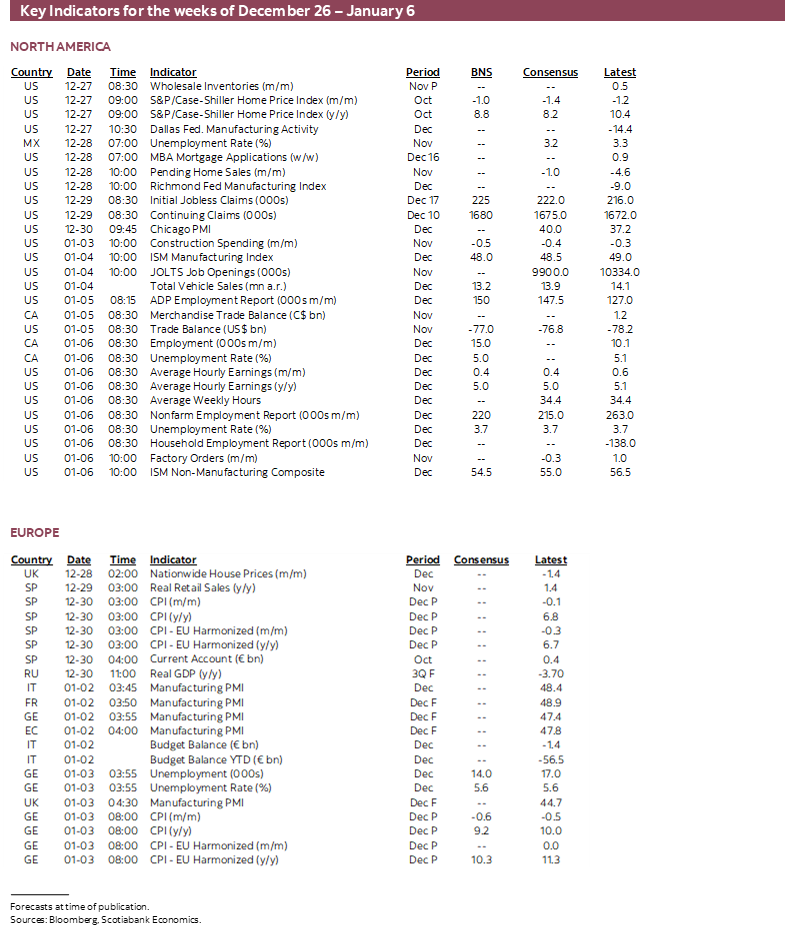
This two-week edition will cover expected developments across global macro calendars through to the first week of the new year.
CHINA—MONITORING RISKS TO SUPPLY CHAINS
The period between Christmas and New Year’s Eve will be very quiet across global calendars with one exception being the ongoing focus upon developments in China. A key question is whether the rapidly spreading Covid virus in the wake of the massive relaxation of prior restrictions will damage supply chains and spark a renewed round of upside risk to global inflation.
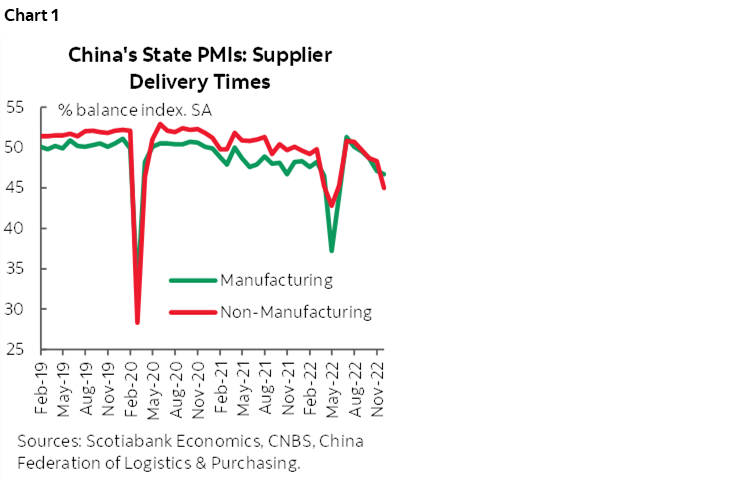
Anecdotes will inform much of this risk along the way, but so will data. The state’s purchasing managers’ indices for December land on December 30th (eastern time). They’ve been signalling contraction in the manufacturing and non-manufacturing sectors for some time. Key, however, may be measures like supplier delivery times.
If delivery times continue to deteriorate following a brief reopening-fed improvement earlier this year, then that could be a further negative signal that halts or reverses progress over the past year toward improving supply chains (chart 1). It’s hard not to imagine that delivery times and price pressures will become a growing issue into the new year as firms struggle to cope with work illness and absenteeism. The issue would then become focused upon magnitudes and duration of such interruptions and whether it could be another tipping point for inflation risk and inflation expectations.
ARE US NONFARM PAYROLLS OVERESTIMATING EMPLOYMENT?
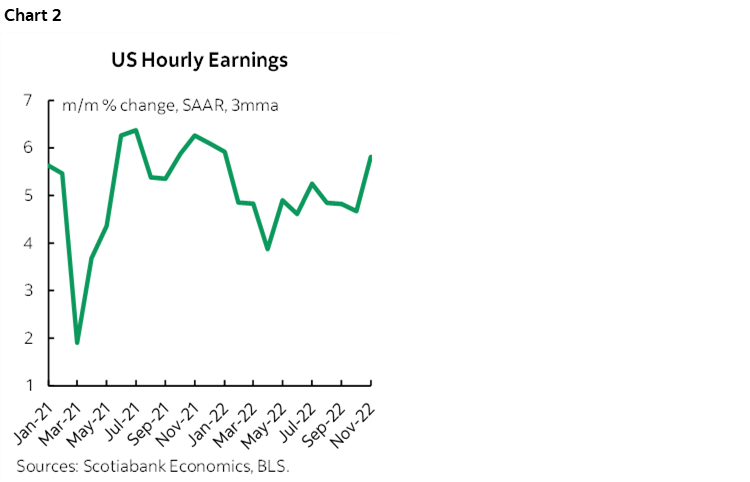
Nonfarm payrolls and wages get updated for the month of December on Friday January 6th. I’ve guesstimated a rise of 220k with 0.4% m/m SA wage growth which is just under 5% at an annualized pace of wage gains. Wage figures may pose the greatest market sensitivity after the prior report showed a surge (chart 2).
There are even stronger than usual caveats around this set of job readings since at the time of publication for this two-week holiday edition we have very little to go by in terms of December’s job readings.
Nevertheless, while it won’t affect the next report, an ongoing controversy concerns the accuracy of nonfarm payrolls and specifically its vulnerability to revisions at rapid turning points in the economy, markets and monetary policy. To this effect, the Bureau of Labour Statistics’ annual revisions to employment figures in February could be impactful.
This could be an important issue in that serious misestimation could suggest that the strength of the US job market is being overestimated. Still, with the focus squarely upon the price stability part of the Fed’s dual mandate it would have to be a massive issue to impact the Fed’s policy stance. I’m not terribly convinced by arguments that slag payrolls as wildly off base.
The folks at the Philadelphia Federal Reserve recently made a splash (here) by figuring that nonfarm payrolls overestimated job growth by about 1.1 million in just the second quarter of this year (the latest available with their alternative sources). If so, then clearly that’s sizeable in that it works out to an average monthly over-estimation of about 370k jobs created during Q2. They arrived at this figure by using more comprehensive estimates of jobs at the level of individual states from the Bureau of Labour Statistics’ Quarterly Census of Employment and Wages that arrives with a lag and with Q2 being the latest made available in early December.
Some have interpreted this as a gotcha moment with strident claims against the usefulness of nonfarm payrolls and with some going so far as to allege political interference with the jobs numbers. That’s likely far too extreme and greater care is advised.
For one thing, the Philly approach has only been around for three quarters and so we can’t assess the performance of their approach over a cycle of revisions that span years. That makes it difficult to assess whether their approach successfully predicts ultimate revisions to payrolls.
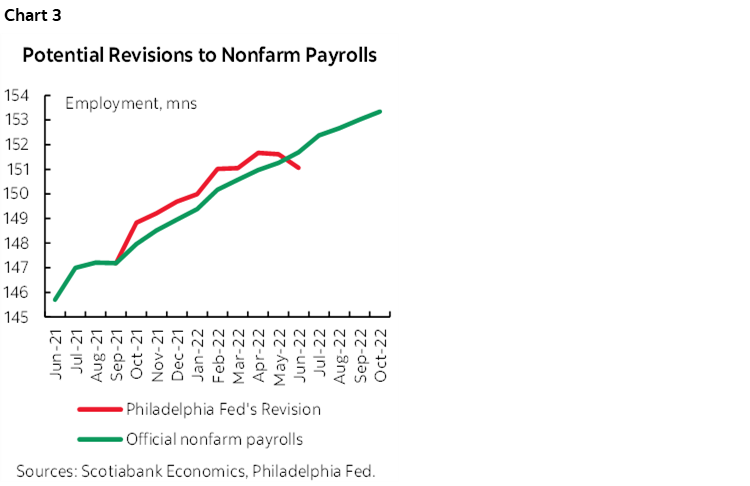
Second, we can’t just pick out one quarter. For the three quarters they do provide from 2021Q4 through 2022Q2, the Philly Fed approach says job growth was 733k higher than indicated by nonfarm payrolls in 2021Q4, 253k lower than payrolls in 2022Q1 and 1.1 million lower than payrolls in Q2 (chart 3). On net, the Philly approach says that payrolls may be overestimating job growth by about 70k/month over the full nine-month period they assess. That hardly seems like a hill to die on in the context of the +/-120k 90% confidence interval for any one month’s payroll estimates!
Third, the Philly approach is using unstable data to predict revisions to unstable data. That begs the question of which one is really off the mark? By that I mean that the Philly approach is itself subject to revision which merits at least as much caution toward what it reveals as toward nonfarm payrolls. For example, whereas the Philly Fed folks initially figured that their approach revealed job growth that was 348k higher than indicated by nonfarm payrolls in Q4 of last year, their latest estimates more than doubled that to payrolls underestimating job growth by 733k in 2021Q4. That didn’t make headlines by the way…
Fourth, if payrolls are really off base, then we should be able to cross reference this across measures like jobless claims. Initial jobless claims, however, remain low at just over 200,000 per week. They has increased to a peak of 261k in July, but have since fallen back to 216k at the time of writing which doesn’t suggest a persistent deterioration in the job market so far.
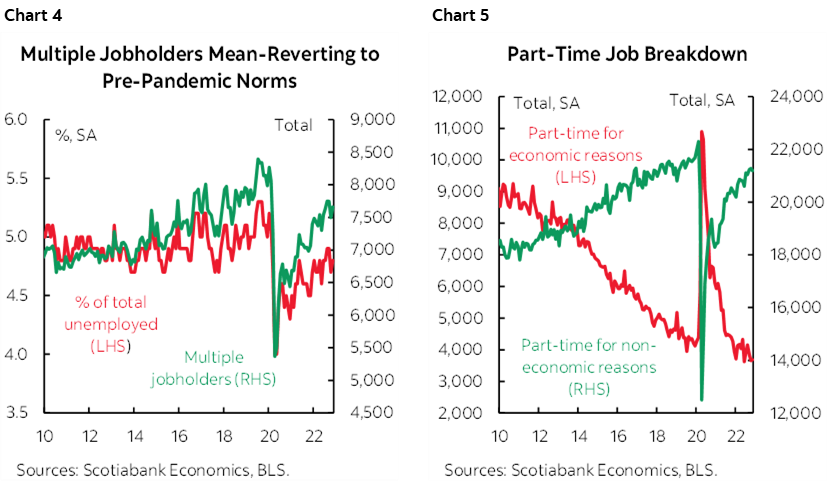
A key matter to the debate over potential revisions is what would cause such potential measurement discrepancies in the first place. On this there is a lot of uncertainty, but casual explanations are confronted by the data. Chart 4, for instance, rejects the notion that some advance that nonfarm payrolls overcount employment by counting positions versus the household survey that counts employed individuals. Multiple job holders have been little changed around 7½ million throughout this year with little change from month to month. This point is supported by part-time employment levels that have seen a rise in part-time workers for economic reasons offset by a decline in part-time workers for non-economics reasons (chart 5).
Overall, in my view, we’re left waiting for the February re-benchmarking exercise in order to reveal the full set of revisions to nonfarm payrolls and should avoid overly hasty conclusions about the quality of US employment figures at least until then.
MINUTES TO THE HAWKISH FOMC MEETING
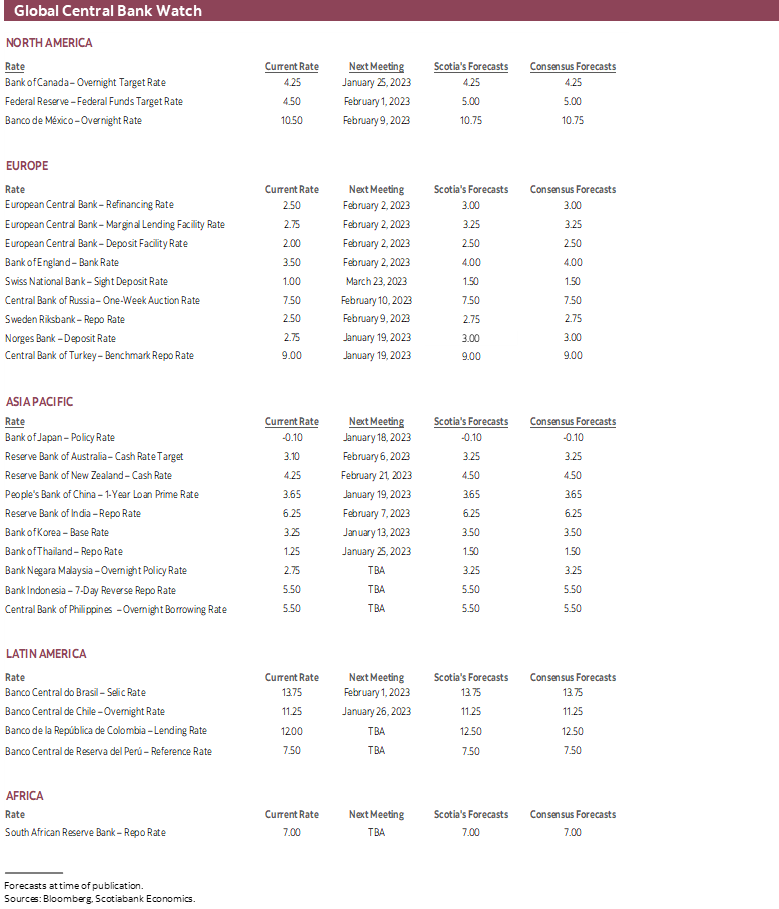
Needless to say that global central banks will be on holiday throughout the next two weeks and beyond. The only focal point will be upon minutes to the December 13th – 14th FOMC meeting on Wednesday January 4th. A recap of that meeting is available here.
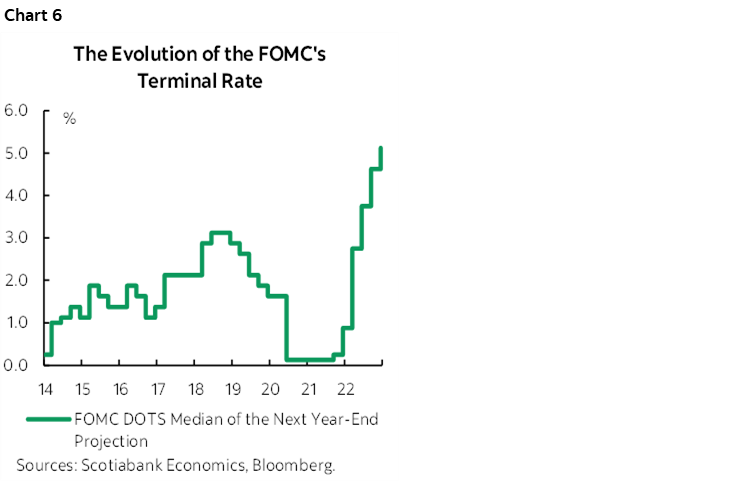
Key may be any further discussion around why members continue to view the risks to inflation as pointed to the upside. Discussion around whether they feel a stronger need to lean against what had been easing financial conditions into the meeting may further reveal the motives to sounding more hawkish at this meeting. Third may be any discussion around the risk that future estimates of the terminal rate may have to keep marching higher.
On this latter point, Chair Powell had said in his press conference that “I can’t tell you confidently that we won’t raise our terminal rate estimate again in March” and that “At each subsequent SEP this year we have raised this terminal rate.” True enough, as shown in chart 6.
EUROZONE INFLATION—PEAKING HEADLINE, NOT SO MUCH CORE
Eurozone inflation is poised for another update on January 6th—the same day as nonfarm payrolls in what could be a bit of a bang for global markets. Spain kicks off the estimates on December 30th and then Germany updates on January 3rd followed by France the next day and then Italy on the 5th.
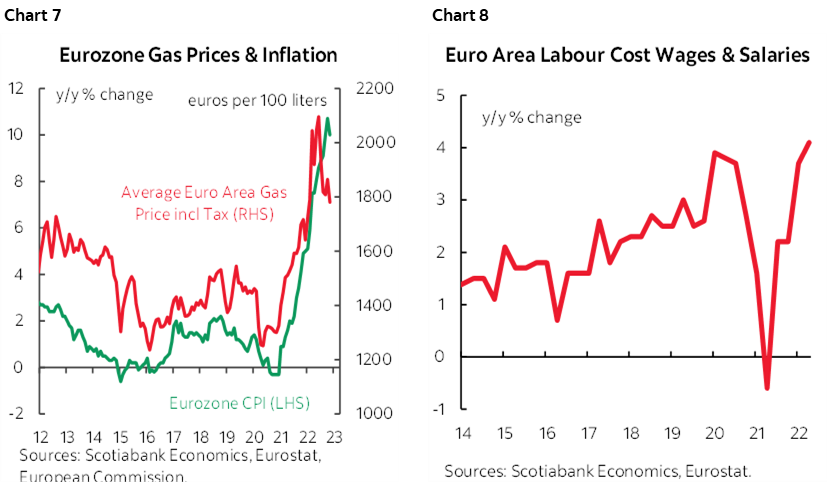
As chart 7 demonstrates, energy contributions to headline inflation are on the decline. That is expected to push the year-over-year rate of all-in inflation back beneath 10% y/y for the first time since August.
More of the focus will be upon core inflation that is running at 5% y/y for a record-high since the euro was launched on January 1st 1999. Passthrough pressures from high energy and food prices may persist alongside wage growth supports (chart 8), but the euro’s appreciation since October may work in the other direction if it persists.
CANADIAN WAGE GROWTH IN FOCUS
After a quiet week between holidays, the first week of the new year will start with a bang when we find out how 2022 ended for workers. StatCan will update its Labour Force Survey on Friday January 6th including estimates of employment and wages. This will be the opening salvo of releases in the new year on the path to the Bank of Canada’s next policy decision on January 25th and in the wake of a reasonably hot core inflation reading (here). After jobs the focus will then turn to the BoC’s quarterly surveys on January 16th including measures of wage and inflation expectations, followed by another CPI reading for December the next day.
I’ve guesstimated a job gain of 15k but with little conviction. Canada’s job market has registered about 140k jobs created over the past three months for a slight net gain compared to the three months of job losses over the prior period from June to August.
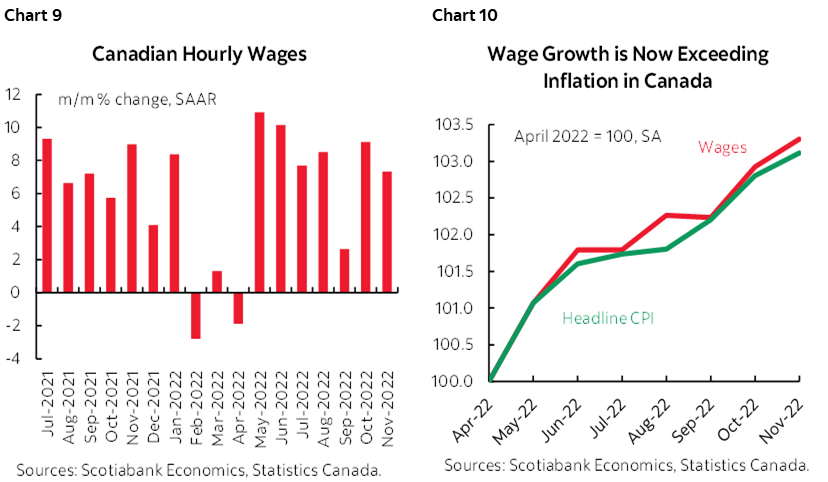
Key will remain wage growth in a very tight labour market. Taking average hourly wages of permanent workers from the Labour Force Survey and seasonally adjusting them reveals a sharp acceleration of wage growth shown in chart 9. Wage gains well into the upper single digit percentage points are being registered since the summer of 2021 with a brief interruption at the start of 2022. Wage gains have been slightly exceeding inflation since May of this year (chart 10). That’s not enough to give anyone the impression that they’ve won the lottery, but it’s incremental progress that we expect to build upon itself into 2023 as inflation remains challenging but down from the stratosphere while wage gains continue.
OTHERWISE LIGHT MACRO DEVELOPMENTS
The rest of the two-week line-up will include a smattering of lower profile releases.
US updates will be light during the first week between Christmas and New Year’s Eve, but the second week will bring out construction spending on the Tuesday followed by ISM-manufacturing, JOLTS job openings and vehicle sales the next day, then ADP on Thursday along with trade figures followed by ISM-services on Friday.
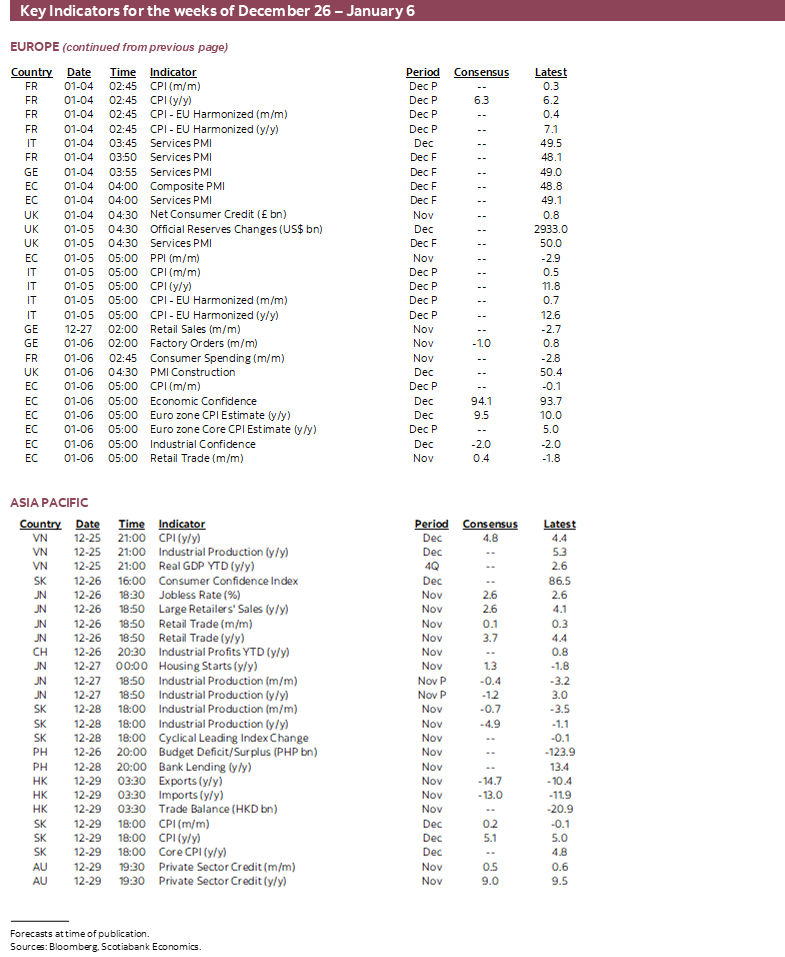
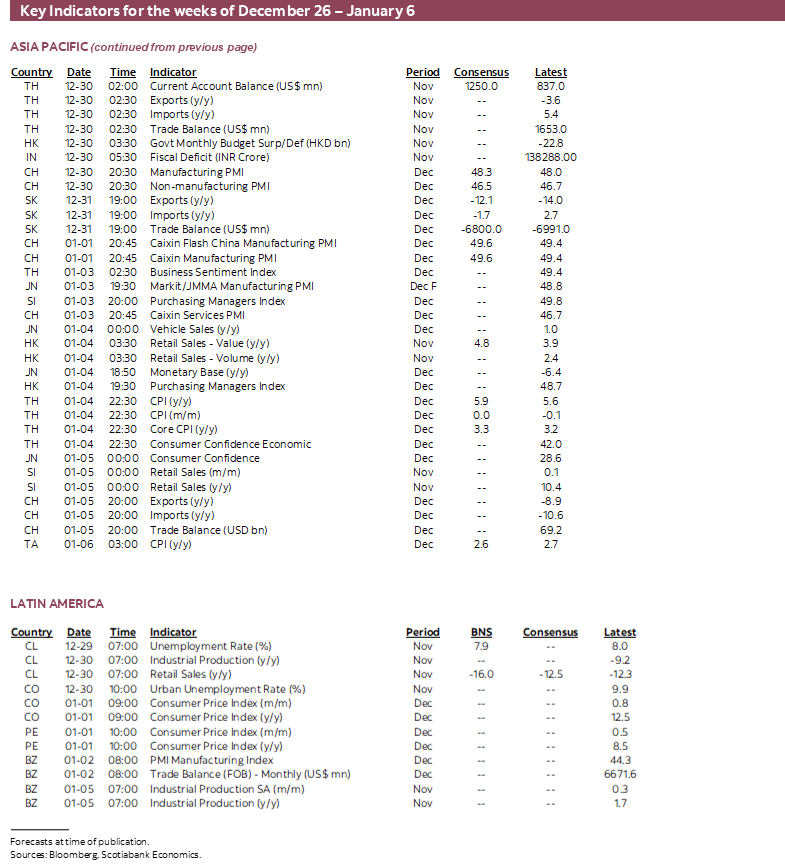
Asia-Pacific updates will include Japanese retail sales, housing starts, industrial output and the jobless rate the first week along with South Korean CPI and the Bank of Japan’s Summary of Opinions following its recent widening of the 10-year JGB trading bands. The second week brings out China’s private PMIs and trade plus India’s PMIs and Thai CPI.
European markets will enter the new year considering consumer spending in France and Germany plus German export figures and Swiss CPI.
LatAm markets will be very quiet as developments in Peru continue to be monitored alongside light calendar-based risks including CPI updates from Chile, Colombia and Peru after New Year’s.


DISCLAIMER
This report has been prepared by Scotiabank Economics as a resource for the clients of Scotiabank. Opinions, estimates and projections contained herein are our own as of the date hereof and are subject to change without notice. The information and opinions contained herein have been compiled or arrived at from sources believed reliable but no representation or warranty, express or implied, is made as to their accuracy or completeness. Neither Scotiabank nor any of its officers, directors, partners, employees or affiliates accepts any liability whatsoever for any direct or consequential loss arising from any use of this report or its contents.
These reports are provided to you for informational purposes only. This report is not, and is not constructed as, an offer to sell or solicitation of any offer to buy any financial instrument, nor shall this report be construed as an opinion as to whether you should enter into any swap or trading strategy involving a swap or any other transaction. The information contained in this report is not intended to be, and does not constitute, a recommendation of a swap or trading strategy involving a swap within the meaning of U.S. Commodity Futures Trading Commission Regulation 23.434 and Appendix A thereto. This material is not intended to be individually tailored to your needs or characteristics and should not be viewed as a “call to action” or suggestion that you enter into a swap or trading strategy involving a swap or any other transaction. Scotiabank may engage in transactions in a manner inconsistent with the views discussed this report and may have positions, or be in the process of acquiring or disposing of positions, referred to in this report.
Scotiabank, its affiliates and any of their respective officers, directors and employees may from time to time take positions in currencies, act as managers, co-managers or underwriters of a public offering or act as principals or agents, deal in, own or act as market makers or advisors, brokers or commercial and/or investment bankers in relation to securities or related derivatives. As a result of these actions, Scotiabank may receive remuneration. All Scotiabank products and services are subject to the terms of applicable agreements and local regulations. Officers, directors and employees of Scotiabank and its affiliates may serve as directors of corporations.
Any securities discussed in this report may not be suitable for all investors. Scotiabank recommends that investors independently evaluate any issuer and security discussed in this report, and consult with any advisors they deem necessary prior to making any investment.
This report and all information, opinions and conclusions contained in it are protected by copyright. This information may not be reproduced without the prior express written consent of Scotiabank.
™ Trademark of The Bank of Nova Scotia. Used under license, where applicable.
Scotiabank, together with “Global Banking and Markets”, is a marketing name for the global corporate and investment banking and capital markets businesses of The Bank of Nova Scotia and certain of its affiliates in the countries where they operate, including; Scotiabank Europe plc; Scotiabank (Ireland) Designated Activity Company; Scotiabank Inverlat S.A., Institución de Banca Múltiple, Grupo Financiero Scotiabank Inverlat, Scotia Inverlat Casa de Bolsa, S.A. de C.V., Grupo Financiero Scotiabank Inverlat, Scotia Inverlat Derivados S.A. de C.V. – all members of the Scotiabank group and authorized users of the Scotiabank mark. The Bank of Nova Scotia is incorporated in Canada with limited liability and is authorised and regulated by the Office of the Superintendent of Financial Institutions Canada. The Bank of Nova Scotia is authorized by the UK Prudential Regulation Authority and is subject to regulation by the UK Financial Conduct Authority and limited regulation by the UK Prudential Regulation Authority. Details about the extent of The Bank of Nova Scotia's regulation by the UK Prudential Regulation Authority are available from us on request. Scotiabank Europe plc is authorized by the UK Prudential Regulation Authority and regulated by the UK Financial Conduct Authority and the UK Prudential Regulation Authority.
Scotiabank Inverlat, S.A., Scotia Inverlat Casa de Bolsa, S.A. de C.V, Grupo Financiero Scotiabank Inverlat, and Scotia Inverlat Derivados, S.A. de C.V., are each authorized and regulated by the Mexican financial authorities.
Not all products and services are offered in all jurisdictions. Services described are available in jurisdictions where permitted by law.