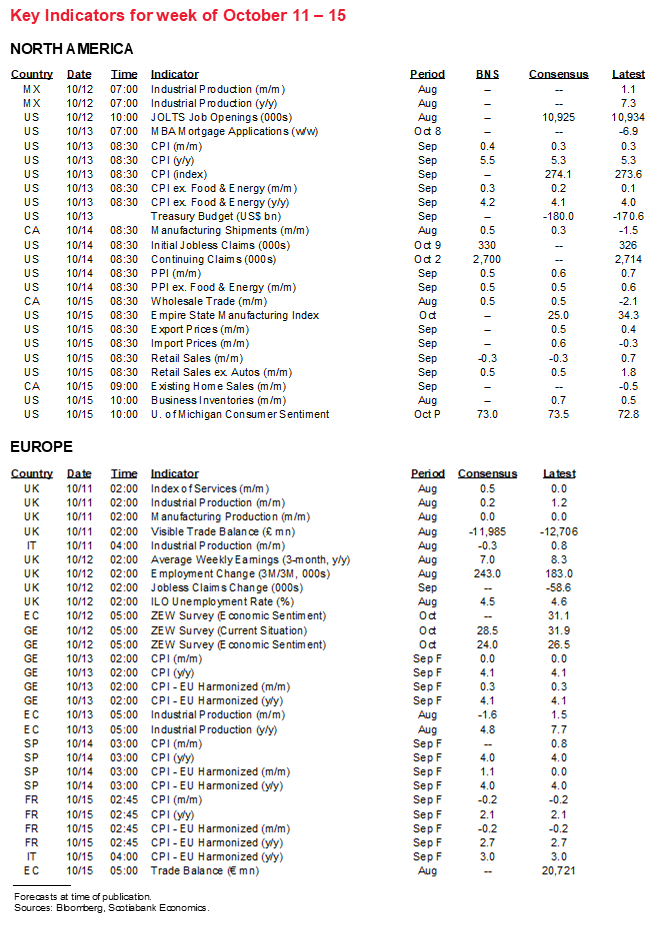
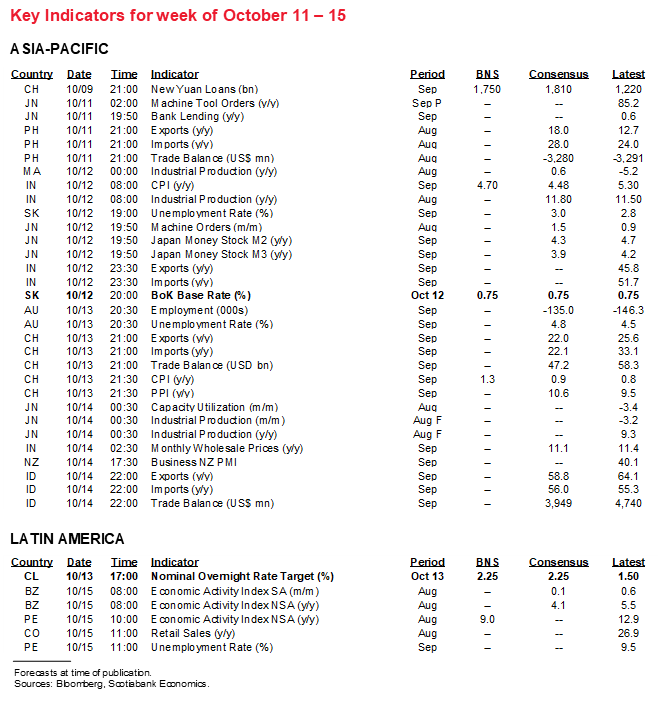
Next Week's Risk Dashboard
• US earnings season
• Will US inflation bounce back?
• FOMC minutes likely to reinforce tapering…
• …along with a heavy Fed speaker line-up
• US retail sales downside
• Chile’s central bank expected to hike
• Jobs: UK, Australia, South Korea
• China trade, financing
• Bank of Korea likely to hold
• Other Inflation: China, India, Norway, Sweden
Chart of the Week

EARNINGS—UP, UP AND AWAY?
Give your friendly local equity analyst a hug next week. Buy her a coffee, virtual or in person. Forgive the little bit of grumpiness. After all, the quarterly torrent of US earnings reports kicks off the Q3 season.
It starts off relatively slow as always, with 20 S&P500 firms on the docket and all of them toward the back half of the week. It also starts off mostly focused upon financials as usual. Key names will include the likes of JP Morgan Chase, BlackRock and Delta Airlines on Wednesday, then BofA, Morgan Stanley, Citigroup and Wells Fargo on Thursday followed by Goldman Sachs on Friday.
Analysts have recently bumped up their earnings targets for this season and subsequent ones (chart 1). Pair that with the usual reminder that US analysts’ earnings expectations have tended to be sharply lowballed ever since SOX legislation was enacted (chart 2). Lastly, while price-to-trailing-earnings ratios remain high, I don’t find price-to-forward-earnings to be particularly expensive especially if analysts are lowballing where earnings will ultimately land (chart 3).

INFLATION—TRANSITORY SOFTENING?
Was the unexpected deceleration in US CPI during August a transitory development or the start of a falling trend in the pace of price changes? We’ll find out when the September readings arrive on Wednesday. It will help to inform pricing power and hence one contributor to growth in nominal earnings as a driver of nominal stock market benchmarks.
There is a good case for believing that August was just a temporary soft patch for pricing power with supporting points of a general and specific nature. I’ve gone with an estimate of 0.4% m/m for headline CPI that would translate into a rise of 5.5% y/y (from 5.3%), as well as 0.3% m/m for core CPI that would translate into a gain of 4.2% y/y (from 4.0%). There might even be upside—at least to the core measure.
In general, multiple forms of evidence point toward ongoing supply chain pressures with no real relief in store. Examples include the price gauges within the ISM-services and ISM-manufacturing reports, both of which increased during the month (chart 4).

In terms of specific inputs to the estimates, one thing to point to is that we know that used and new vehicle prices were higher in September. J.D. Power Company data is used as CPI input by the Bureau of Labor Statistics. They indicated that new vehicle prices were up by about 3% m/m before seasonal adjustment which likely means just over 3% m/m in seasonally adjusted terms. At a 3.8% weight in CPI, new vehicle prices could add 0.12% m/m to CPI. New vehicle prices increased to a new record high of US$42,802 on average for an 18.6% y/y pace of increase and with the lowest dollar amount of incentives per vehicle on record.
We also know that used vehicle prices were up again after the dip in August. Used prices were tracking about a seasonally adjusted 3.5–4% m/m gain according to J.D. Power and confirmed by the Manheim reading. With a 3.5% weight in CPI, used vehicles will contribute about 0.13% m/m to headline CPI in weighted terms. That more than reverses the drag on August CPI when used vehicle prices fell 1.5% m/m and hence knocked less than 0.1% off headline inflation.
So when combined, used and new vehicle prices should add 0.2–0.3% m/m to headline CPI before we even turn toward other considerations. Then leverage that up for core CPI that is about 79% of total CPI to get a total vehicles contribution to core CPI inflation of about 0.3–0.4% m/m. If this tracking of vehicle prices translates well into CPI, then it’s also likely that the related category of vehicle insurance premiums won’t repeat as one of the top three downsides to US CPI during August as shown in chart 5 as a reminder.

Other considerations include the fact that gasoline prices were little changed in seasonally unadjusted terms, but probably ~+1% m/m in seasonally adjusted terms. At a 3.9% weight in CPI, gasoline could add another 0.05% m/m to CPI.
Further, while the Delta variant was an ongoing factor through September and may have sapped some pricing power, it’s unlikely that we’ll see a repeat of the abrupt price movements that dragged the prior month’s CPI reading lower in high contact activities. Airline fare, lodging away from home and car and truck rentals were three of the five biggest downsides to August CPI in m/m terms with used vehicles and vehicle insurance the other two.
Another key category to watch will be drivers of shelter costs and particularly owners’ equivalent rent of primary residence that likely faces ongoing catch-up to house prices (chart 6) as well as straight up rent. The growing area of emphasis is also upon the cyclical sources of inflationary pressure versus the more idiosyncratic and transitory sources of acyclical price pressures as shown in Marc Ercolao’s cover chart.

Whatever happens, one or two CPI reports won’t settle the transitory debate. For that matter, given the length of a typical monetary policy horizon, not even a series of reports will settle the debate versus looking ahead over the full cycle. Still, even if inflation settles back upon a more moderate trend around the 2–2.5% y/y range over the next couple of years or so, it still merits ending QE and moving toward rate hikes.
CENTRAL BANKS—GOOD ENOUGH?
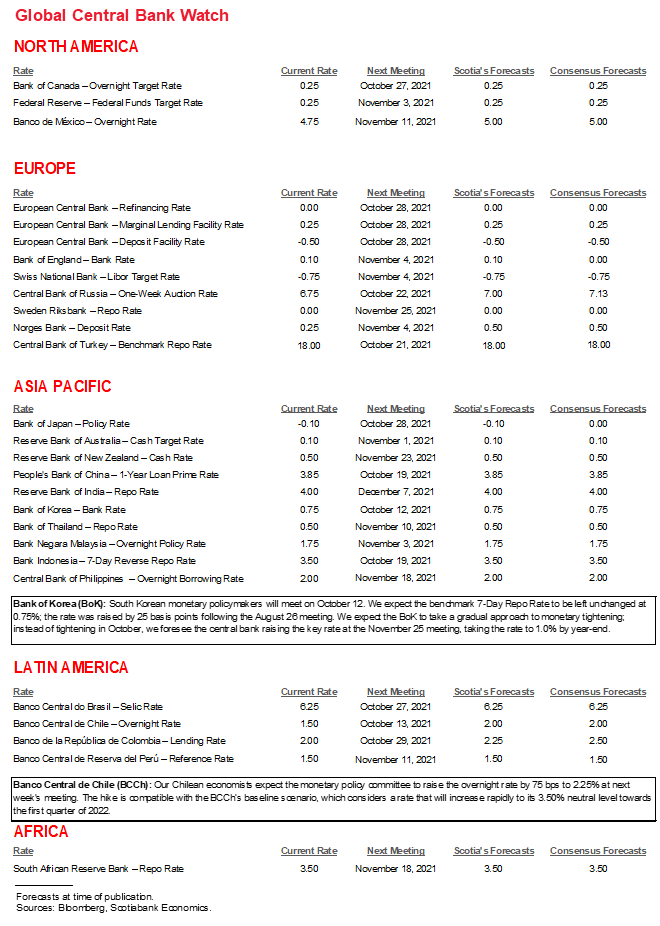
Two regional central banks deliver updated decisions with one expected to hike, while Fed communications are likely to reaffirm the commitment to tapering Treasury and MBS purchases.
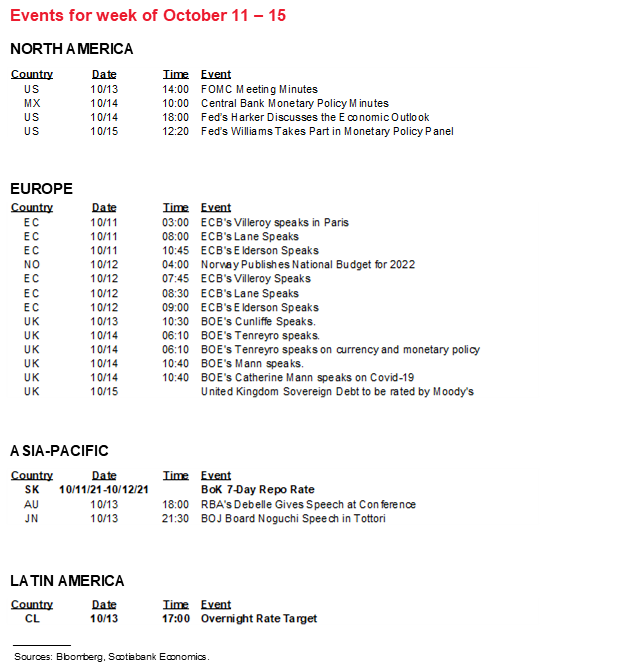
Minutes to the September 21st – 22nd FOMC meeting arrive on Wednesday. They are likely to further drive home the guidance to taper purchases ‘soon.’ A recap of the communications that were delivered at that meeting is available here. The latest payrolls report was probably just barely adequate to merit announcing a reduction of bond purchases at the November 3rd FOMC meeting (here).
Since the FOMC minutes could be stale in light of the soft rise in nonfarm payrolls, markets will also monitor fresher Fed-speak for a sense of how various FOMC officials judge the taper criteria. Vice Chair Clarida speaks Tuesday. Governors Brainard and Bowman speak on Wednesday. There will be a heavy line-up of regional Presidents speaking throughout the week plus a speech by the NY Fed’s EVP Logan on monetary policy implementation on Thursday.
Chile’s central bank is expected to hike its overnight rate target by 75bps to 2.25% on Wednesday. The central bank has provided guidance that its policy rate will climb toward a neutral level of ~3.5% by 2022Q1 and so it clearly has a lot of work to do to get there in a short time. Surging inflation is the issue (chart 7).

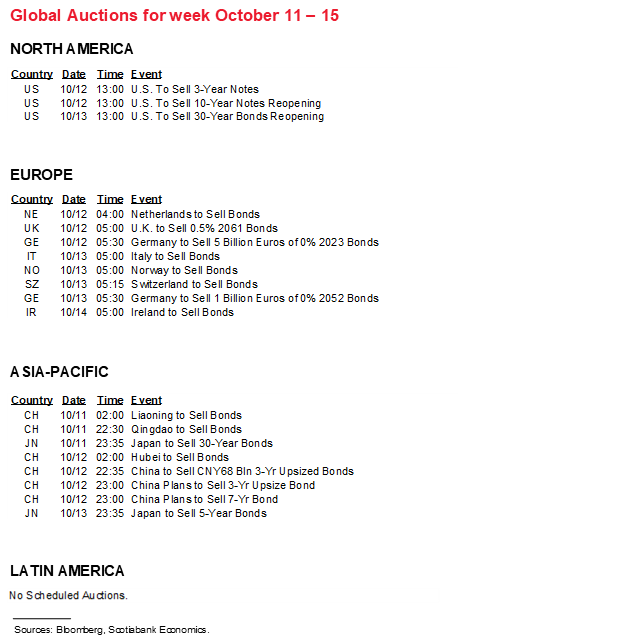
The Bank of Korea is expected to hold its 7-day repo rate unchanged at 0.75% on Tuesday evening ET. If it passes on a second hike in the cycle, then watch forward guidance in relation to expectations from Scotia’s Tuuli McCully for a hike at the November meeting.
THE REST!
US retail sales will likely stand out the most in the grab bag of other global developments. The headline reading is expected to register another decline. We know that new vehicle sales were down 6.7% m/m with under a 20% weight that subtracts over 1% m/m from total retail sales. Some of this is going to be offset by higher vehicle prices as noted in the CPI section such that on net, the value of vehicles sold should drag around a half percentage point off of total retail sales. It could be tough to register another solid gain in sales ex-autos and gas after the prior month’s 2% rise, but assuming a small gain would still result in a drop in overall sales.
Canada’s calendar-based risks will be light over the coming week after coming back in food shock following the Thanksgiving holiday on Monday. Celebrate, but also spare a moment or two in your thoughts for those who have struggled the most throughout the pandemic. Advance flash guidance from Statistics Canada points to about ½% m/m gains in manufacturing sales (Thursday) and wholesale trade (Friday) during August. Friday also brings out the national add-up for existing home sales with the hope that the five-month trend of falling sales may be arrested partly given the gain in Toronto for example.
China is expected to update aggregate financing figures for September sometime during the week. China’s growth challenge is not just the fact that it can’t quite engineer the same leveraged growth off of its exports. China is also pursuing a relatively tight money approach compared to almost everywhere else. It has among the highest real policy rates anywhere. It has among the lowest inflation rates anywhere and with September CPI on tap mid-week. Its total universe of financing products including traditional local currency and FX-denominated loans plus bond and equity financing and social financing is growing at the slowest pace in years (chart 8). All of this stands in contrast to elsewhere and contributes toward explaining China’s recently softer growth while also suggesting that it is keeping its powder dry should future risks to the economy merit unleashing stimulus. Trade figures for September will help to further inform nearer term growth after recent surging.

Three countries will update the state of their job markets. The UK and South Korea will be updating job figures on Tuesday followed by Australia on Wednesday. The UK report will likely attract more eyes as recent weeks have seen increased bets that the BoE may bring forward its first rate hike as soon as year-end with a full hike priced in OIS by 2022Q1. A strong UK jobs report for August that builds on July’s robust reading is one such checkbox that needs to be ticked for an expedited rate hike to become a possibility. The question is whether the government’s furlough scheme in September had materially negative effects on the unemployment rate.
The Aussie labour market has fallen victim to a surge in Delta cases that led to stringent lockdowns and a halt in job creation. August jobs fell by 146k with further deterioration anticipated through September and October as lockdowns in Sydney and Melbourne remain in place. Consensus estimates another loss in excess of 100k jobs for September on Wednesday night. At risk is wiping out the year-to-date rise in employment. For fans of comparing BoC to RBA dynamics (I’m not really one of them) see chart 9 that shows how the two countries’ labour market recoveries may be crossing over one another (Canadian recap here).

Singapore Q3 GDP is due out by Wednesday evening (ET) and should rebound while nevertheless being faded given the recent rise in COVID-19 cases and restrictions.
The UK will also update August readings on Wednesday for industrial output, the monthly services index and trade figures. The general tone of the releases is expected to be constructive.
Also watch for CPI updates from India, Norway and Sweden plus Germany’s ZEW investor sentiment gauge.
DISCLAIMER
This report has been prepared by Scotiabank Economics as a resource for the clients of Scotiabank. Opinions, estimates and projections contained herein are our own as of the date hereof and are subject to change without notice. The information and opinions contained herein have been compiled or arrived at from sources believed reliable but no representation or warranty, express or implied, is made as to their accuracy or completeness. Neither Scotiabank nor any of its officers, directors, partners, employees or affiliates accepts any liability whatsoever for any direct or consequential loss arising from any use of this report or its contents.
These reports are provided to you for informational purposes only. This report is not, and is not constructed as, an offer to sell or solicitation of any offer to buy any financial instrument, nor shall this report be construed as an opinion as to whether you should enter into any swap or trading strategy involving a swap or any other transaction. The information contained in this report is not intended to be, and does not constitute, a recommendation of a swap or trading strategy involving a swap within the meaning of U.S. Commodity Futures Trading Commission Regulation 23.434 and Appendix A thereto. This material is not intended to be individually tailored to your needs or characteristics and should not be viewed as a “call to action” or suggestion that you enter into a swap or trading strategy involving a swap or any other transaction. Scotiabank may engage in transactions in a manner inconsistent with the views discussed this report and may have positions, or be in the process of acquiring or disposing of positions, referred to in this report.
Scotiabank, its affiliates and any of their respective officers, directors and employees may from time to time take positions in currencies, act as managers, co-managers or underwriters of a public offering or act as principals or agents, deal in, own or act as market makers or advisors, brokers or commercial and/or investment bankers in relation to securities or related derivatives. As a result of these actions, Scotiabank may receive remuneration. All Scotiabank products and services are subject to the terms of applicable agreements and local regulations. Officers, directors and employees of Scotiabank and its affiliates may serve as directors of corporations.
Any securities discussed in this report may not be suitable for all investors. Scotiabank recommends that investors independently evaluate any issuer and security discussed in this report, and consult with any advisors they deem necessary prior to making any investment.
This report and all information, opinions and conclusions contained in it are protected by copyright. This information may not be reproduced without the prior express written consent of Scotiabank.
™ Trademark of The Bank of Nova Scotia. Used under license, where applicable.
Scotiabank, together with “Global Banking and Markets”, is a marketing name for the global corporate and investment banking and capital markets businesses of The Bank of Nova Scotia and certain of its affiliates in the countries where they operate, including; Scotiabank Europe plc; Scotiabank (Ireland) Designated Activity Company; Scotiabank Inverlat S.A., Institución de Banca Múltiple, Grupo Financiero Scotiabank Inverlat, Scotia Inverlat Casa de Bolsa, S.A. de C.V., Grupo Financiero Scotiabank Inverlat, Scotia Inverlat Derivados S.A. de C.V. – all members of the Scotiabank group and authorized users of the Scotiabank mark. The Bank of Nova Scotia is incorporated in Canada with limited liability and is authorised and regulated by the Office of the Superintendent of Financial Institutions Canada. The Bank of Nova Scotia is authorized by the UK Prudential Regulation Authority and is subject to regulation by the UK Financial Conduct Authority and limited regulation by the UK Prudential Regulation Authority. Details about the extent of The Bank of Nova Scotia's regulation by the UK Prudential Regulation Authority are available from us on request. Scotiabank Europe plc is authorized by the UK Prudential Regulation Authority and regulated by the UK Financial Conduct Authority and the UK Prudential Regulation Authority.
Scotiabank Inverlat, S.A., Scotia Inverlat Casa de Bolsa, S.A. de C.V, Grupo Financiero Scotiabank Inverlat, and Scotia Inverlat Derivados, S.A. de C.V., are each authorized and regulated by the Mexican financial authorities.
Not all products and services are offered in all jurisdictions. Services described are available in jurisdictions where permitted by law.

