WHY QUEBEC’S ECONOMY IS LEADING THE RECOVERY FROM COVID-19
SUMMARY
- Preliminary data released by the Institut de la Statistique du Québec continue to indicate that the province’s economic rebound has significantly outpaced that of the rest of Canada.
- The province saw a solid expansion in Q2-2021 despite the fact that the rest of Canada—notably Ontario—contracted in that period; Quebec’s real GDP has now exceeded pre-pandemic levels since March 2021.
- The timing of lockdowns and reopening has benefited Quebec’s recovery, with assistance from healthy household balance sheets, pre-pandemic economic momentum, and government policy support.
- Quebec is in position to lead all Canadian jurisdictions in economic growth this year; Ontario is trailing but virus control since Q2-2021 and auto sector recovery should support a rebound in the coming months.
- It’s too early to say whether Quebec will see structurally stronger growth post-COVID-19, but we estimate that recent interprovincial migration gains—if sustained—could permanently lift GDP 1% higher.
TRACKING RECOVERIES IN CANADA’S LARGEST PROVINCES
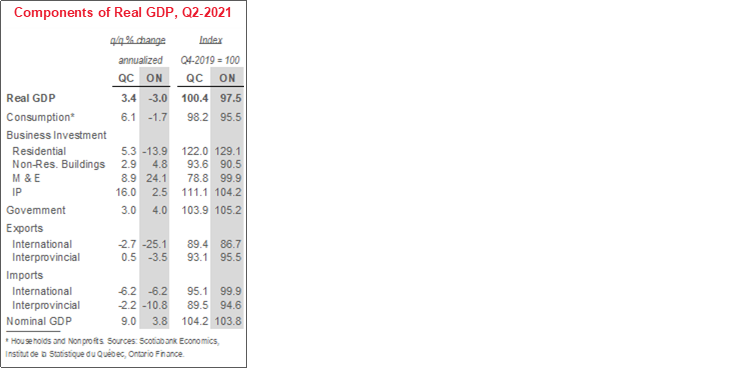
The strength of Quebec’s economic rebound from COVID-19 has been nothing short of remarkable. In Q3-2020, its real GDP rose by nearly 60% (q/q ann.), much stronger than the roughly 40% increase witnessed across Canada. The province’s economy also continued to grow in Q2-2021—it expanded by a solid, albeit easing 3.4% annualized pace—in stark contrast to the 1.1% contraction reported at the national level. That momentum has resulted in Quebec’s output exceeding Feb. 2020, pre-pandemic levels in the five months to July 2021. Even zero gains for the rest of the year (and no revisions to history) would give annual growth of 6.5%—an all-time record and well above the 4.9% advance we have penciled in for Canada in 2021.
Ontario’s recovery has been more uneven. In Q2-2021, its output sat 2.5% below pre-pandemic levels, having fallen by an outsized 3% (q/q ann.) in the April–June 2021 period and lagged national growth in each of the last three quarters.
These data suggest that the other eight provinces’ combined real GDP fell by 1.6% (q/q ann.) in the second quarter of 2021 (chart 1). That reinforces widely-held views that: a) the Q2-2021 decline in real Canadian output was concentrated in Ontario but still fairly broad-based, and b) Quebec’s economic recovery has been particularly impressive.

This is noteworthy because such economic outperformance is unusual in Quebec (chart 2, p.1). Canada’s second-largest province experienced a growth spurt in the three years before the pandemic. Yet, most economists estimated that its long-run potential economic growth was below that of the country as a whole given modest business investment levels and an aging population. Now, the province’s economic expansion looks poised to lead all Canadian jurisdictions for the first time in recorded history.

WHAT EXPLAINS QUEBEC’S ECONOMIC OUTPERFORMANCE?
Quebec’s household consumption—the single largest component of GDP—has responded strongly to reopening. During the first wave of COVID-19 that peaked in Q2-2020, Quebec had the highest caseload and enacted the toughest restrictions (chart 3). That resulted in real GDP falling by more than it did for the country as a whole. Infections then plunged, and rapid easing of restrictions contributed to a staggering 80% (q/q ann.) surge in household consumption in Q3-2020. Ontario’s reopening from the first wave was more gradual, as were its Q3 gains in household outlays and output. In the third wave, Quebec stood out for a lighter caseload than in the second; that looks to have translated into a strong 6.1% (q/q ann.) gain in household consumption, in contrast to fresh third wave lockdowns and a 1.7% drop in Ontario.

Alongside beneficial lockdown timing, Quebec households began the pandemic with momentum and relatively strong balance sheets; this may explain the greater release of pent-up consumer demand upon reopening. Over 2017–19, full-time jobs rose by more than in any three-year period since 2000. Wages and salaries surged as well, and uncharacteristically outpaced those in Ontario in that time. Quebec has also maintained its pre-COVID-19 saving rate advantage (chart 4); 2019 liability-to-net worth and debt-to-income ratio data reinforce the narrative that Quebec consumers had more spending room than their peers in other provinces.

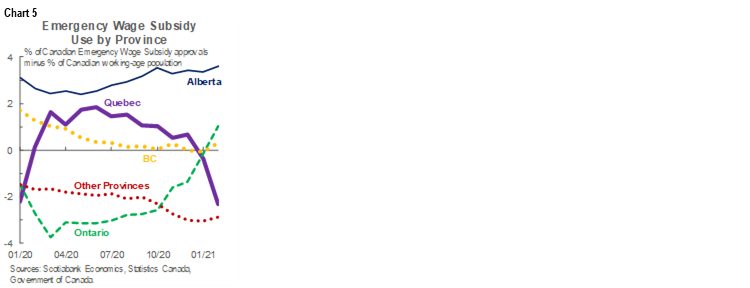
Government policy support helped offset income losses. For instance, Quebec’s share of approved Canadian Emergency Wage Subsidy (CEWS) claims exceeded its share of Canada’s working-age population for most of 2020 (chart 5). Only in Alberta—which experienced a far steeper economic contraction—were there more CEWS approvals per capita. A generous package of provincial income tax deferrals—initially estimated to have injected $4.5 bn into the Quebec economy—likely helped as well.
Auto sector presence is another reason for differences in the two provinces’ economic trajectories to date. In 2019, 1.9 mn light vehicles were made in Canada—all in Ontario—by five automakers. In a typical year, vehicles and parts manufacturing accounts for one-third of nominal Ontario exports versus only about 4% in Quebec. While cuts to related output amid the global semiconductor shortage made headlines and added to Ontario’s recent GDP dip, Ontario-Quebec export divergences predated Q2-2021. Since the pandemic’s outset, Ontario external shipments have moved almost in lockstep with Canadian automobile output, first dropping in light of shuttered plants, then rebounding upon restart, and since dragging (chart 6, p.3). Not as exposed to the ebbs and flows of that sector, Quebec’s exports have outpaced those of Ontario and the rest of Canada.

Curiously, Quebec’s mining sector recovery has been uneven relative to that in the rest of Canada—even though exporters have benefited from strong prices for staple commodities like aluminum, gold, and silver. Likewise, price gains for those products have not translated into outsized corporate profit growth. This likely reflects major project activity thus far not detailed in public releases. Still, we think the province is well positioned to benefit from solid pricing support for its key commodities over the next couple of years.
LOOKING AHEAD
Some of the economic forces we have observed in Canada’s two largest provinces will almost certainly prove transitory. Since Ontario’s third pandemic wave, COVID-19 infections have dropped and remained low; this has enabled an easing of restrictions that should facilitate release of pent-up consumer demand as we near 2022, even with evidence of elevated household debt levels. Meanwhile, Quebec consumers should continue to benefit from relatively little COVID-19 spread and eased restrictions, but the pace of expenditure growth will likely cool in the coming quarters. Across Canada, we expect home sales volumes and residential investment will cool from unsustainably high, pandemic preference-induced levels over the next couple of years.
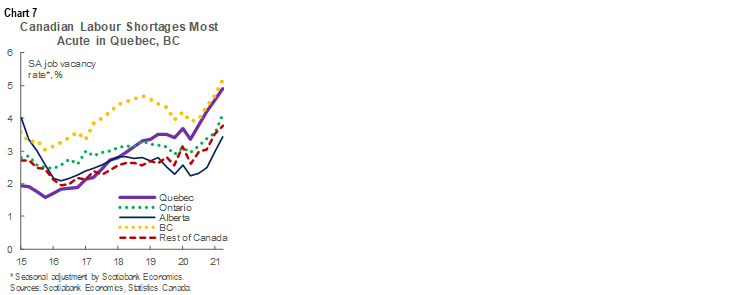
Others should persist to some degree. Semiconductor shortages and auto production weakness look increasingly likely to spill into 2022. We do expect some easing of these constraints as we progress through 2021, which should generate strong Ontario export growth into 2022. More broadly, input product shortfalls and inflation should linger, and both Quebec and Ontario have reported strong GDP deflator advances in the first half of this year. We foresee reductions in the large numbers of unfilled jobs reported across Canada (chart 7) assuming that supply chain issues are unwound and COVID-19 caseloads remain manageable. Yet, as we argued here, these represent significant impediments to growth, and can only be meaningfully addressed in the long run with assertive and nimble responses from policymakers and businesses.
Demographic trends may signal a structural shift in provincial economic patterns; if maintained, those could put Quebec on a structurally stronger growth path. While increased provincial targets for immigrant admissions—which we have argued are essential to long-run growth—to combat labour shortages are certainly positive, interprovincial migration trends are even more striking. Net outflows from Ontario to Quebec reached their highest-ever recorded level in the second quarter of this year (chart 8). This at least partly reflects the prevalence of telework during the pandemic and Quebec’s edge on housing affordability, both of which will likely persist in the next couple of years. A modest Western Canadian energy sector investment outlook is also constructive for net migration to Quebec.

Our latest forecast does not assume a structural demographic shift—for now, reopening effects dominate the outlook—but our modelling suggests that a demographic shift could drive permanently stronger growth in Quebec. We assume that population evolves in line with the latest provincial government projections, which forecasts that interprovincial migration stabilizes at a net annual outflow of 9k people per year in the long-run. However, in an alternate scenario where net interprovincial migration stabilizes at zero, our econometric model of the Quebec economy projects that real GDP would be permanently 1% higher per year by the end of this decade.
Also constructive for longer-term growth is Quebec’s demonstrated success in decoupling economic growth from greenhouse gas emissions over the last decade. This may further help attract investment as the global green transition continues.
COVID-19 has unquestionably been a crisis of the highest magnitude in Quebec, but the province’s economy has weathered the worst of the storm and looks to be coming out of the pandemic in better shape than many of its peers. Continued emphasis on controlling the virus’ spread and focus on longer-term labour market and climate change challenges will be critical as the province progresses through the next decade.
DISCLAIMER
This report has been prepared by Scotiabank Economics as a resource for the clients of Scotiabank. Opinions, estimates and projections contained herein are our own as of the date hereof and are subject to change without notice. The information and opinions contained herein have been compiled or arrived at from sources believed reliable but no representation or warranty, express or implied, is made as to their accuracy or completeness. Neither Scotiabank nor any of its officers, directors, partners, employees or affiliates accepts any liability whatsoever for any direct or consequential loss arising from any use of this report or its contents.
These reports are provided to you for informational purposes only. This report is not, and is not constructed as, an offer to sell or solicitation of any offer to buy any financial instrument, nor shall this report be construed as an opinion as to whether you should enter into any swap or trading strategy involving a swap or any other transaction. The information contained in this report is not intended to be, and does not constitute, a recommendation of a swap or trading strategy involving a swap within the meaning of U.S. Commodity Futures Trading Commission Regulation 23.434 and Appendix A thereto. This material is not intended to be individually tailored to your needs or characteristics and should not be viewed as a “call to action” or suggestion that you enter into a swap or trading strategy involving a swap or any other transaction. Scotiabank may engage in transactions in a manner inconsistent with the views discussed this report and may have positions, or be in the process of acquiring or disposing of positions, referred to in this report.
Scotiabank, its affiliates and any of their respective officers, directors and employees may from time to time take positions in currencies, act as managers, co-managers or underwriters of a public offering or act as principals or agents, deal in, own or act as market makers or advisors, brokers or commercial and/or investment bankers in relation to securities or related derivatives. As a result of these actions, Scotiabank may receive remuneration. All Scotiabank products and services are subject to the terms of applicable agreements and local regulations. Officers, directors and employees of Scotiabank and its affiliates may serve as directors of corporations.
Any securities discussed in this report may not be suitable for all investors. Scotiabank recommends that investors independently evaluate any issuer and security discussed in this report, and consult with any advisors they deem necessary prior to making any investment.
This report and all information, opinions and conclusions contained in it are protected by copyright. This information may not be reproduced without the prior express written consent of Scotiabank.
™ Trademark of The Bank of Nova Scotia. Used under license, where applicable.
Scotiabank, together with “Global Banking and Markets”, is a marketing name for the global corporate and investment banking and capital markets businesses of The Bank of Nova Scotia and certain of its affiliates in the countries where they operate, including; Scotiabank Europe plc; Scotiabank (Ireland) Designated Activity Company; Scotiabank Inverlat S.A., Institución de Banca Múltiple, Grupo Financiero Scotiabank Inverlat, Scotia Inverlat Casa de Bolsa, S.A. de C.V., Grupo Financiero Scotiabank Inverlat, Scotia Inverlat Derivados S.A. de C.V. – all members of the Scotiabank group and authorized users of the Scotiabank mark. The Bank of Nova Scotia is incorporated in Canada with limited liability and is authorised and regulated by the Office of the Superintendent of Financial Institutions Canada. The Bank of Nova Scotia is authorized by the UK Prudential Regulation Authority and is subject to regulation by the UK Financial Conduct Authority and limited regulation by the UK Prudential Regulation Authority. Details about the extent of The Bank of Nova Scotia's regulation by the UK Prudential Regulation Authority are available from us on request. Scotiabank Europe plc is authorized by the UK Prudential Regulation Authority and regulated by the UK Financial Conduct Authority and the UK Prudential Regulation Authority.
Scotiabank Inverlat, S.A., Scotia Inverlat Casa de Bolsa, S.A. de C.V, Grupo Financiero Scotiabank Inverlat, and Scotia Inverlat Derivados, S.A. de C.V., are each authorized and regulated by the Mexican financial authorities.
Not all products and services are offered in all jurisdictions. Services described are available in jurisdictions where permitted by law.