HIGHLIGHTS
We expect all of Canada’s provinces to witness steep contractions in 2020 as the COVID-19 pandemic ravages the world economy.
In many cases, the strength of the economic rebound upon reopening from first wave restrictions surprised on the upside; as such, the outlook has improved since April.
However, several provinces are now in the midst of a second phase of the pandemic and have implemented fresh lockdown measures to curb the virus’ spread.
Tourism and food and accommodations have borne the brunt of pandemic’s hit and face the dimmest prospects; remote work-capable services and sectors deemed essential have been less impacted.
Net oil-producing regions face additional challenges as a result of the drop in crude values; this exacerbates disparities that have dominated the provincial economic landscape since 2014.
Policy support during the pandemic has been unprecedented, resulting in record or near-record financial pressures. Longer-run, the Provinces will need to balance avoidance of hysteresis with fiscal sustainability.
It appears that we are still in the early stages of the pandemic and as such, the outlook is highly uncertain—the virus’ spread should remain the dominant risk for some time.
We explore several macroeconomic themes and risks affecting the provinces in greater detail on pages 2 and 3.
PROVINCIAL MACROECONOMIC THEMES AND RISKS
COVID-19
The evolution of the virus’ spread is highly uncertain and represents the primary risk to the outlook at this time. We are in the midst of a second wave across much of Canada (charts 1–3), and some regions, grappling with record high daily case numbers, have announced a new round of lockdown measures. For now, we assume that the restrictions put in place will remain less severe than those witnessed during the first wave. Yet, if infection rates are not brought under control again, we could well see tighter lockdowns that result in the kind of economic contractions experienced earlier this year. On the other hand, quicker-than-anticipated advances with respect to COVID-19 vaccine or treatment development and distribution represent upside potential for economies the world over.

It is evident that all else equal, successful virus containment translates into better economic prospects. Small and mid-sized provinces in the Prairies and Atlantic Canada, for instance, have thus far witnessed far less deterioration across economic indicators than regions with heavier caseloads. However, early data releases suggest that provinces such as Quebec and Ontario that flattened the curve by instituting more severe, longer-lasting restrictions were able to benefit from a significant bounce-back in economic activity upon reopening (chart 4, p.2).

POPULATION GROWTH
In several of our pre-pandemic Provincial Outlook reports, we noted the important role that population growth had played in sustaining the expansion across Canada. Many jurisdictions were in the midst of their strongest headcount gains in decades, while others were successfully using targeted immigration and non-permanent resident programs to offset declining natural growth via population aging. This “human stimulus” had—alongside steady improvements in newcomer integration—supported healthy employment gains and contributed handsomely to real estate demand. In fact, the pace of pre-pandemic gains in some regions appears to have been sufficiently strong to unleash significant pent-up demand during the reopening period, generating some frothiness in many local housing markets.
Amid pandemic-induced border closures and travel restrictions, population growth has slowed significantly across the country. Immigration, still down by more than 60% y/y in many jurisdictions (chart 5, p.2) even after some recovery in recent months, has been the primary reason for the slowdown. However, weaker international student flows and challenges admitting temporary foreign workers in Q2 also contributed to the largest quarterly net outflow of non-permanent residents since 2015. Moreover, with interprovincial migration likely to remain difficult so long as COVID-19 remains a threat, jurisdictions such as Ontario, PEI, Nova Scotia, and Alberta face the prospect of losing a key source of their recent headcount gains. Safely resuming international flows will be critical to Canada’s medium-term prosperity.

POLICY SUPPORT
Acknowledging the severity of this historic downturn, the federal government and the Provinces have introduced extraordinary measures to keep the economy afloat. These include a range of sectoral supports, payment deferrals, fee reductions, and—where virus containment has enabled early reopening—infrastructure spending increases. Perhaps the highest-profile of these efforts, the Canada Emergency Response Benefit (CERB) income replacement program has sent massive transfers to households, far outstripping the incomes losses that mounted during the Q2 economic meltdown. These measures helped provide a much-needed cushion at a time of unprecedented uncertainty.
A key question at this time relates to how the eventual unwinding of these supports will be timed. If they are halted before the labour market makes a full recovery, there is clear downside risk to the economy. On this front, the new Canada Recovery Benefit (CRB) and extension of the wage subsidy program until the summer of 2021 provide a greater degree of certainty around supports that should go some way in cushioning the impacts of second waves. Yet, governments will also face pressure to balance fiscal sustainability over the medium-term.
INDUSTRIAL DIVERGENCES
COVID-19 restrictions and changing spending patterns have hit certain sectors of the economy hard. Tourism has borne the brunt of lockdowns, a trend reflected in pronounced deterioration of food and accommodations services employment and activity. This appears to be behind slowing momentum in BC and some Atlantic provinces, which have relatively large tourism industries. Retail also took a hit during the first wave, though grocery stores are benefiting from steady consumer demand and rising prices, and there is evidence of a bounce-back from the trough reached in April, occurring in tandem with a shift to online shopping. As well, the oil and gas sector continues to be impacted by soft prices via reduced travel demand and fuel consumption and ongoing supply-demand imbalances.
Some industries have performed reasonably well, pandemic challenges notwithstanding. A number of agricultural products have enjoyed resilient production and rising prices, providing support for provincial exports in a year otherwise dominated by depressed import demand. Construction has also held up well, bolstered by frothy post-lockdown real estate activity, and may be in a position to benefit from stepped-up infrastructure outlays. And given the prevalence of remote work during the pandemic, financial and professional, scientific and technical services have performed well relative to other sectors. Going forward, economies concentrated in these industries may be better able to withstand an extended lockdown situation.
COVID-19 data current to October 12, 2020. Sources for charts: Scotiabank Economics, Government of Canada.
Sources for charts: Scotiabank Economics, Statistics Canada, IRCC.
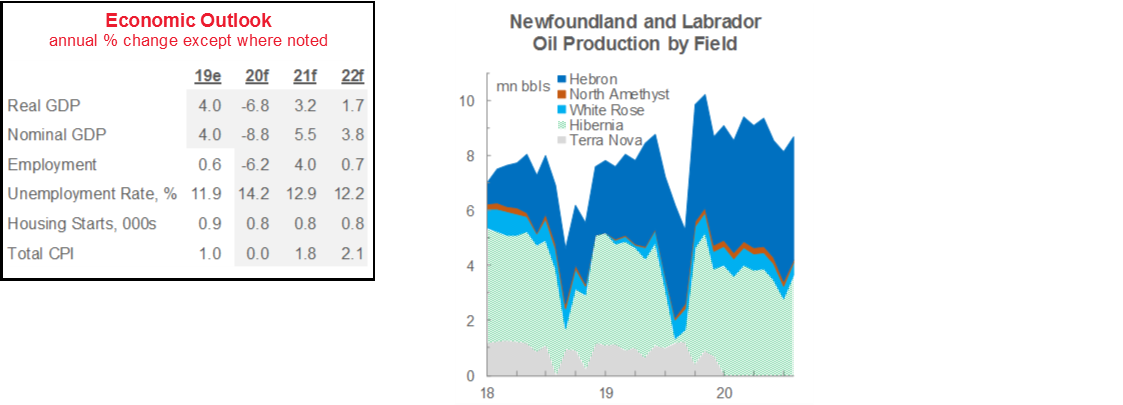
NEWFOUNDLAND AND LABRADOR: PANDEMIC PUTS THE ROCK IN A HARD PLACE
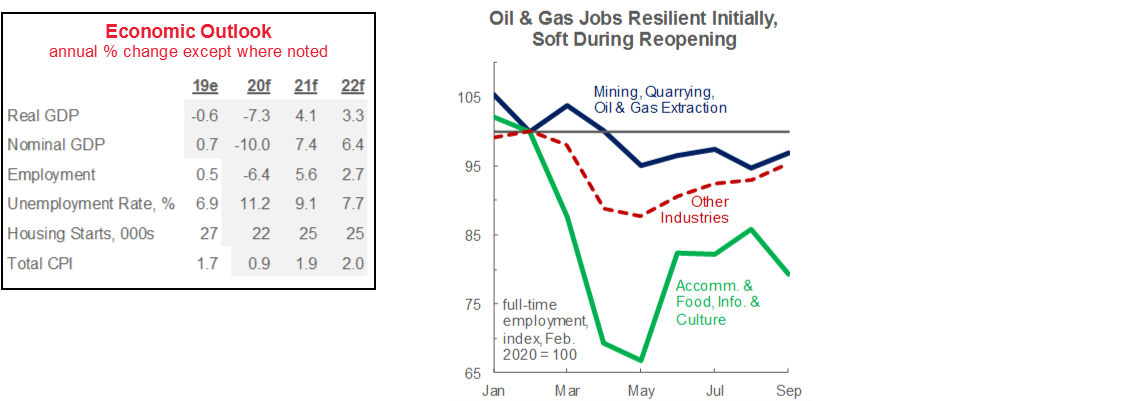
Like the other net oil-producing provinces, Newfoundland and Labrador faces a particularly challenging outlook. Alongside the fallout from pandemic-induced restrictions, the local economy is grappling with the prospect of soft crude values for the next several years.
What began as a promising year for the oil and gas sector is increasingly giving way to longer-run fears. Oil and gas extraction made up over 30% of Newfoundland and Labrador’s output last year—more than any other province. Following a pandemic-induced stoppage, the West White Rose extension project—positioned as critical to the long-run viability of the existing White Rose offshore oil field—is under review by Husky, its proponent. Meanwhile, operations at the Terra Nova field are still suspended with no restart date announced, eroding some of the gains associated with the continued ramp-up of Hebron field output (chart). Still, there remains positive upside to the outlook to the extent that significant ongoing offshore exploration activity eventually translates into new investments.
For other mining, growth prospects are improving, although still uncertain. The onset of the pandemic and initial lockdowns led to broad-based and precipitous commodity price declines early in the year, but nickel and iron ore values have since rebounded well beyond their pre-virus peaks. Safe haven gold—another key mineral on The Rock—has also witnessed a significant climb amid heightened market volatility and accommodative global monetary policy. More encouraging for export volumes and capital outlays is the resumption of operations and expansion of the Voisey’s Bay nickel mine. Iron ore output was largely unaffected by COVID-19.
Though smaller as a share of output than the staple mining sector, the government continues to prioritize the tourism and aquaculture industries. Participation in the Atlantic Bubble permits greater mobility within Canada’s four easternmost provinces. As well, the Stay Home Year campaign promotes domestic vacations with border closures and travel restrictions likely to continue to weigh heavily on the tourist expenditures. While fishing and the growing aquaculture sector have been adversely affected by soft consumer demand and pricing this year, a number of major projects are underway.
The Rock’s FY21 budget, released early this month, continued to paint a challenging fiscal picture. The government now expects a $1.8 bn (6.2% of nominal GDP) deficit this fiscal year, stepped-up federal transfer payments and a modest summer improvement in crude values generating a roughly $300 mn narrowing from July projections. Pre-COVID-19 expenditure restraint looks as if it will keep the deficit and net debt from reaching record highs: the Province kept total spending gains to 0.9% per year over FY14–19, less than any other Canadian jurisdiction in that time. However, it faces a potential electricity rate shock jump and further increase to its debt load vis-à-vis the Muskrat Falls hydroelectricity project, delayed again by the pandemic.
This year’s budget also introduced a smattering of new policy initiatives that may bear fruit over the longer-run. If executed, a plan to settle 2,500 immigrants in the province by 2022—almost 30% higher than the historic 1,941 in the four quarters to Q1-2020—could help to boost long-run potential growth and mitigate the costs of a rapidly aging population. Likewise, a $25/day childcare program has the potential to lift female labour force participation. The province’s ongoing five-year, $3 bn infrastructure blueprint may offer a further boost to the expansion.
Sources for chart and table: Scotiabank Economics, Statistics Canada, CMHC, NL Finance, Canada-Newfoundland and Labrador Offshore Petroleum Board.
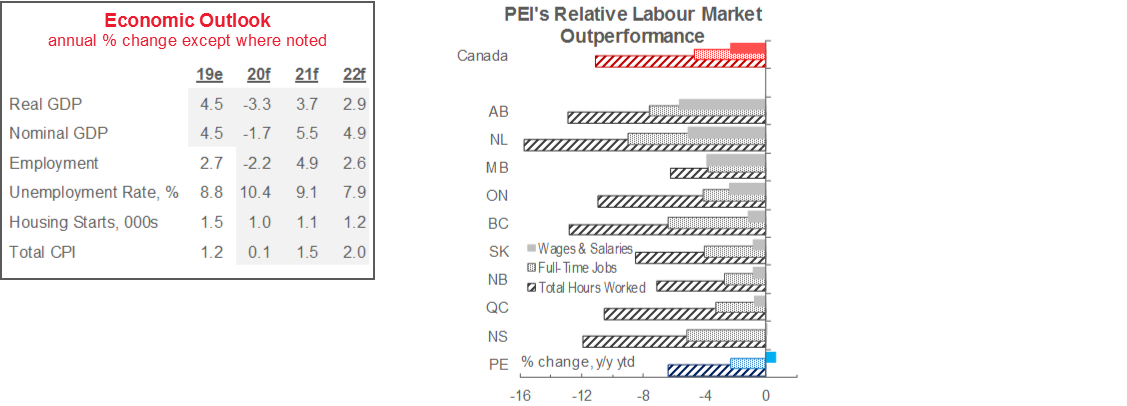
PRINCE EDWARD ISLAND: AVOIDING THE WORST
Though not immune to the pandemic or without its own unique challenges, Prince Edward Island has avoided the worst of the first wave.
The province’s small population and island status have helped it keep COVID-19 infections to a minimum and begin reopening earlier than most other jurisdictions; this is perhaps its greatest advantage going forward. To date, there have been no hospitalizations or deaths in PEI, nor have there been signs of a second wave within its borders, though physical distancing and travel restrictions remain in place.
In line with these successes, PEI’s y/y ytd declines in full-time employment and hours worked are among the most muted of any province (chart). Though some of that strength reflects January and February gains, the Island was the only region in which Q2-2020 wages and salaries rose versus the same period in 2019. The retail & wholesale trade sector appears to have benefited from particularly strong activity at food and merchandise stores during lockdowns that may prove transitory. However, resilience in construction and manufacturing also contributed. The former mirrored housing market strength vis-à-vis the release of pent-up pre-pandemic demand. The latter reflects operation of the food manufacturing segment and rise in food prices during lockdowns, which have also lifted sectoral exports.
Also expected to cushion the Island economy from COVID-19-related blows in the coming months are ongoing infrastructure plans. Recall that the Province had already increased infrastructure spending plans before the pandemic in order to meet the needs of its rapidly growing population. The November 2019 Capital Plan assumed outlays of $156 mn (more than 2% of 2019 nominal GDP) in FY21, with a further $153 mn pencilled in for the next fiscal year.
The Island’s staple agriculture industry has also held up reasonably well amid the lockdown period, but faces an uncertain outlook. Crop receipts are up more than 20% ytd y/y in H1-2020, anchored by surging prices for staple potatoes. There are concerns that travel restrictions limiting inflows of a needed agricultural workers, summer drought, and early planting decisions reflecting expectations of softer pandemic potato demand will hold back production going forward. However, any resulting market tightness could further support prices in the coming months.
The trajectory of population growth is a key risk for province’s economy. From July 1, 2016 to July 1, 2020, PEI’s headcount advanced by over 10%—its steepest-ever recorded four-year climb and the most of any region in Canada—reflecting hefty immigration levels and, more recently, positive net migration from other provinces. Given these results, safe resumption of migration flows are critical for PEI’s longer-run prospects.
The tourism industry presents another vulnerability. The sector has been hit particularly hard by travel restrictions and limited movement around the globe, and this plays an outsized role in the Island economy. The good news for PEI is that activity has improved because of the Atlantic Bubble: the Province reports that bridge, air, and ferry traffic and overnight stays on the Island have improved since the Bubble opened in July.
Sources for chart and tables: Scotiabank Economics, Statistics Canada, CMHC, PEI Finance.
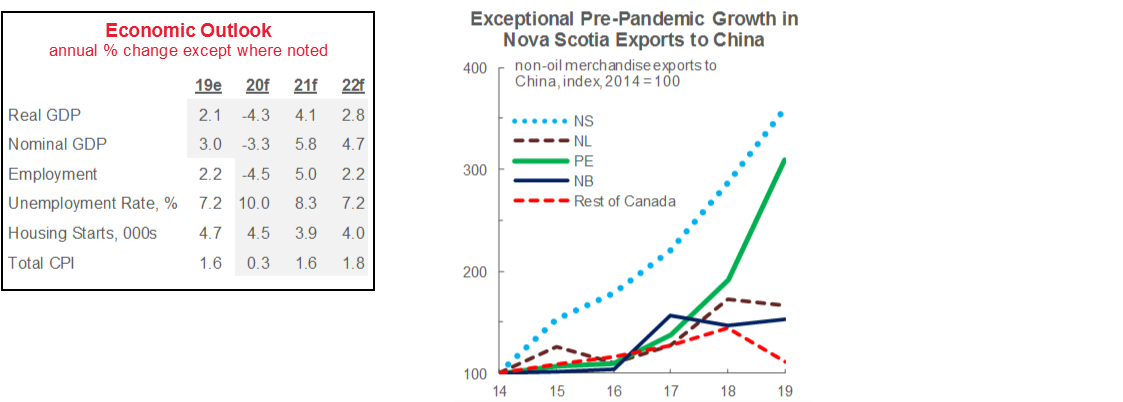
NOVA SCOTIA: PANDEMIC ADDS TO 2020 TRADE CHALLENGE
A number of unique factors likely mean a more challenging 2020 for Nova Scotia than for its Maritime counterparts, but a relatively solid fiscal position and diversified economy should bolster its eventual recovery.
Despite a clear triumph in containing the first wave of COVID-19—no more than three new daily cases have been reported since May—Nova Scotia’s labour market has not fared as well as other COVID-light regions. This reflects its industrial structure: wholesale and retail trade accounted for more than 15% of full-time jobs last year—more than any other province—and its 16.2% retrenchment is thus far worse than anywhere else. And at almost 6%, accommodation and food services—hammered by lockdown measures—last year made up more of the full-time workforce in Nova Scotia than in any other Canadian jurisdiction. Room bookings have improved somewhat since the inception of the Atlantic Bubble, but remained well below 2019 levels heading into the fall shoulder season.
The global nature of this downturn also neutralizes the diversified trading linkages that could normally be counted on as a cushion. Nova Scotia’s nominal exports to the US, China, and Europe are all down significantly through August. Adding to this challenge are broadly weaker seafood prices during the pandemic and the closure of the Northern Pulp mill in Pictou County prior to the pandemic. In the first eight months of 2020, external shipment values for staple paper manufacturing were more than 50% lower than year-earlier levels. Over the longer-run, the trading relationship with China will be key: Nova Scotia has arguably benefited more from sales to the Middle Kingdom in recent years than any other Canadian province (chart)
As in PEI, potential downside vis-à-vis weaker population growth could be significant in Nova Scotia. Immigration, interprovincial migration, and net non-permanent resident attraction contributed to a nearly 50-year high in population growth in 2019, with labour market outcomes for newcomers generally improving since 2015. Going forward, it will be important for the province to balance safely resuming population flows with the need to prevent pandemic outbreaks.
Expected to offer near-term support for Nova Scotia’s growth outlook is a significant increase to infrastructure spending plans. With an additional boost of almost $250 mn announced in July, provincial capital plan outlays are now projected to climb to about $1.3 bn (2.9% of 2019 nominal GDP)—nearly 90% higher than in FY20. This may help fill the void left by soft private-sector investment, and while it generates fiscal pressures, the Province is on pace to avoid a record debt burden following several strong surpluses and attention to debt management pre-pandemic.
Challenges this year notwithstanding, Halifax remains Atlantic Canada’s high value services sector hub. Within Atlantic Canada, ICT, the financial sector, and professional, scientific, and technical services account for the largest share of output and employment in Nova Scotia. With greater capacity for work to be carried out remotely, these industries—and therefore the province—are likely to be more resilient to an extended lockdown situation.
Sources for chart and table: Scotiabank Economics, Statistics Canada, CMHC, NS Finance, Industry Canada.
NEW BRUNSWICK: FIRST WAVE TAMED
New Brunswick’s success with respect to first wave containment has supported its economy thus far, though longer-run growth prospects are more uncertain.
New Brunswick fits the mould of most jurisdictions that have proved the most resilient to COVID-19’s initial economic fallout. A low COVID-19 infection rate during the first wave enabled earlier reopening, less restrictive lockdowns, and relatively modest vulnerability to tourism-related industries. As such, its declines in full-time employment, hours worked, labour income, and its rates of business closure have been fairly modest. While the pandemic has thrown the Province’s books into deficit for this fiscal year, the projected shortfall, at 0.9% of GDP, is the smallest of any jurisdiction (chart).
Case rates have, however, seen an uptick in recent weeks. This has led to the closure of close contact personal services such as barbers and hair stylists in the Moncton and Campbellton Region hotspots, as well as new restrictions for schools and early learning and childcare facilities.
The province also has some exposure to the oil and gas sector. Upgraded petroleum remains New Brunswick’s number one export and manufactured product—Saint John is home to Canada’s largest oil refinery—and soft fuel consumption and prices are weighing heavily on the province’s merchandise shipments. This weakness can reasonably be expected to unwind entering next year to the extent that a demand recovery takes hold in the United States. However, layoffs have been announced in Saint John in a sign of impacts lingering past the initial wave of the pandemic.
The medium-term investment outlook is muted. While earlier reopening will likely minimize capital expenditure plunges, no major ventures had been waiting in the wings before COVID-19 reached Canadian shores. Pre-pandemic plans to keep infrastructure outlays stable as part of fiscal consolidation efforts remain in place.
Acknowledging its flattening of the virus curve and new pandemic-oriented challenges, New Brunswick’s recently re-elected government proposed a number of longer-run economic development themes in its platform. These included a range of funding supports for the health care sector, a pledge to keep taxes and fees low, and assistance for businesses as they undergo the anticipated transition to the digital economy.
The government also rightly remained committed to ambitious pre-COVID immigration attraction and retention targets. This will be absolutely necessary given that newcomers have been the only source of population growth for the aging province over the last several years. They have also clearly encouraged home building and real estate transaction activity, both of which have held up nicely in an otherwise negative economic year.
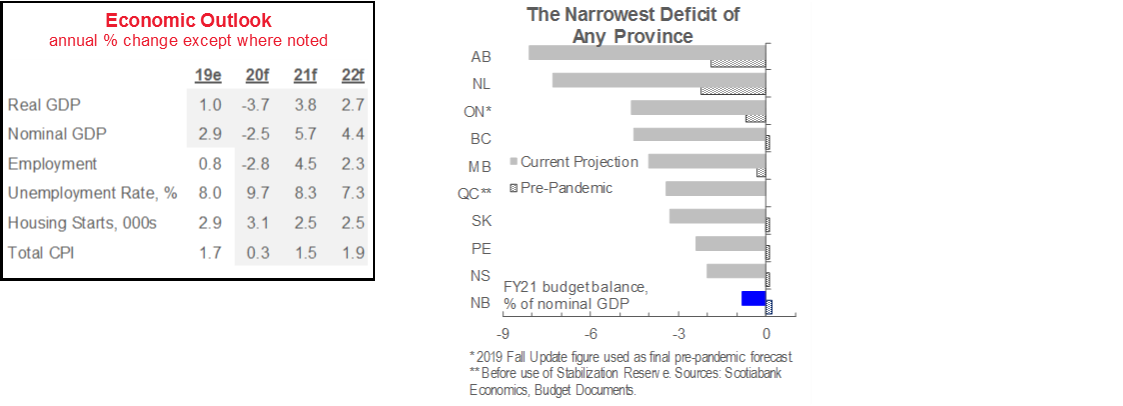
* 2019 Fall Update figure used as final pre-pandemic forecast. ** Before use of Stabilization Reserve. Sources for chart and table: Scotiabank Economics, Statistics Canada, CMHC, NB Finance, Budget Documents.
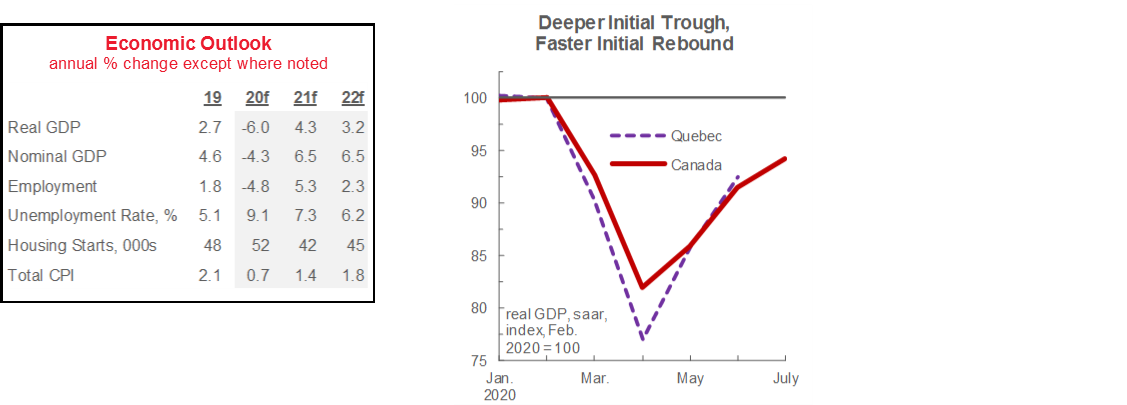
QUEBEC: SECOND LOCKDOWN UNDERWAY
Quebec begins a second round of lockdowns after early first wave reopening had been supporting a strong rebound relative to other provinces; near-term prospects depend vitally on new restrictions being effective and short-lived.
The jurisdiction with the highest COVID-19 case count, Quebec has gone through a particularly turbulent 2020. On the one hand, employment and hours worked fell by more in Quebec than in any other province in April—the first full month of containment measures—while the rate of business closures was also near the top of the table. That contributed to a 14.8% (saar m/m) real output decline in the fourth month of the year—more than 3 ppts worse than the national plunge. Yet, as of June, it had recouped two-thirds of March–April losses versus just over 50% for Canada (chart), bolstered by a construction sector that has already recouped its losses and manufacturing gains better than the national average.
Our forecast assumes that Quebec’s second round of lockdown measures last through December. Per provincial government guidance, we assume that restrictions impact largely only industries such as accommodation and food services, information and culture, and transportation and warehousing, which were disproportionately hit in March and April. We expect spillovers to other sectors to be far more modest.
Lockdowns will surely alter the next few months’ economic trajectory, but fiscal policy should help to reinforce an eventual recovery. Earlier this year, the Province announced that it would boost capital outlays—a move expected to inject $2.9 bn (0.6% of 2019 nominal GDP) into the economy in FY21—and recently tabled a bill to fast-track infrastructure projects. More broadly, Quebec has offered the largest package of provincial-level pandemic supports of any jurisdiction in Canada, concentrated in tax and fee deferrals and liquidity supports. Provincial finances are also in reasonably good shape to weather the COVID-19 storm. Pre-pandemic debt containment efforts are expected to keep net debt from hitting a record output share this year, and $4 bn has been set aside in preparation for the second wave.
While economies the world over are still adjusting to widespread remote work and grappling with its long-run implications, Quebec entered this crisis in a strong position versus most other provinces. Statistics Canada estimates that about 39% of Quebec’s 2019 labour force could plausibly conduct its work from home—a rate that trailed only Ontario. Financial, professional, scientific & technical, and educational services workers’ robust capacity in this respect may help to explain Quebec’s more modest declines in employment and output across those sectors.
Most local Canadian housing markets have witnessed significant momentum since first wave lockdowns began to be eased, but Quebec’s has been especially striking. Housing starts of more than 60k (saar) were recorded from May until August 2020—the first such four-month span in the province’s recorded history—anchored by multi-unit construction in Montreal. The province’s largest city has also seen record home purchases and new listings over that timeframe. Much of this frothiness likely reflects pent-up demand and tight demand-supply balances pre-pandemic. Over the next few months, real estate activity should mirror the trajectory of lockdown measures. Longer-run, there are concerns that more modest population flows in the aftermath of the pandemic could weigh on household formation, dampening the condo market in particular.
Sources for chart and table: Scotiabank Economics, Statistics Canada, CMHC, Finances Québec.
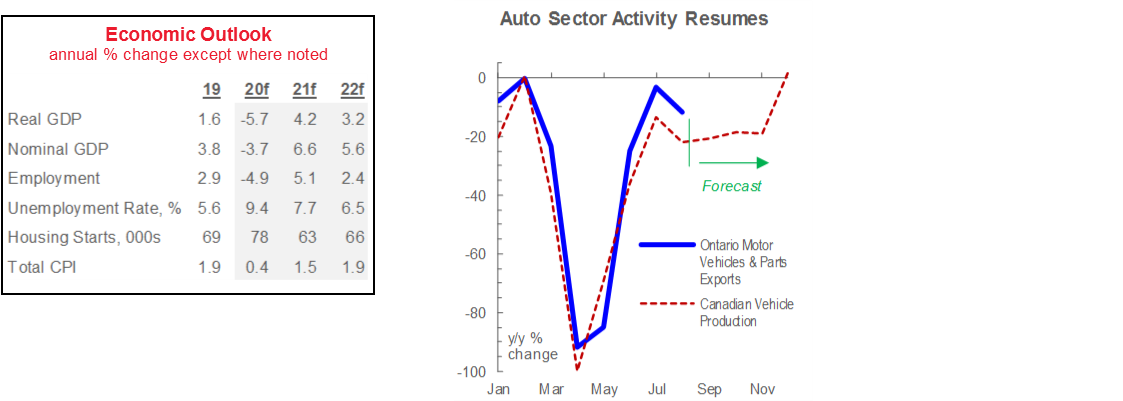
ONTARIO: CLOSING TIME
Now in the midst of a second COVID-19 wave, Ontario has implemented a fresh round of containment measures, with fiscal policy intervention guiding the provincial economy’s landing.
Following Quebec’s lead, Ontario has imposed new restrictions on businesses and mobility to contain an ongoing secondary virus wave. Our forecast assumes a full-quarter shock that applies only to industries most impacted during the first wave. A bounce-back in the first quarter of next year is then expected to provide a boost to the province’s topline annual rate of expansion in 2021.
Our assumed end-of-year lockdown follows what was likely a very strong third quarter. Ontario’s cautious approach to restarting the economy after the first wave—the province only entered its most recent stage of its reopening plan towards the end of July—looks to have weighed down indicators such as employment and retail sales in Q2. We suspect that this pushed some activity into Q3.
For trade, the province’s key automotive sector thus far has held back better results in other industries. Automobiles and parts account for about a third of Ontario’s export values; with dealerships and plants shuttered across Canada and the US at the onset of the pandemic, shipments plunged by more than 80% y/y in both April and May. The sector has recovered since production was restarted in the summer months, resulting in significant June-August improvements (chart). Yet, the steep early-year drop and expectations of muted medium-term output growth leave the sector in a challenging position. Looking to the future, the federal and provincial governments unveiled $2 bn in funding to support the manufacturing of electric vehicles over the next three years.
By contrast, Ontario’s mining and food manufacturing exports have grown on a y/y ytd basis. The former industry, concentrated in gold and silver production, likely reflects the strong appreciation of precious metal values this year, while the latter mirrors the rise in food prices due to pandemic spending habits.
As seen most elsewhere in the country, Ontario has loosened the purse strings to address COVID-19’s economic fallout, a move which should lend support to the economy even as some sectors lock down. Spending increases announced in August—expected to result in a record $38.5 bn deficit and $397 bn net debt burden (4.6% and 47.1% of nominal GDP, respectively)—include a range of economic development initiatives, municipal and transit infrastructure outlays, health care funding, and a sizeable $2.5 bn contingency in the event of second wave cost overruns.
After a brief lockdown-induced interlude, Ontario housing markets are once again heating up. Sales and listings gains in the Greater Golden Horseshoe agglomeration—in the midst of strong population and employment surges pre-pandemic—have generally outpaced the national mean in the last two months, with both indicators hitting all-time highs in several cities. Year-over-year price gains have also been appreciating at double-digit rates. We suspect that more moderate population gains will weigh more significantly on household formation in the coming years, alongside the second lockdown’s impacts resulting in easing real estate markets. Yet rock-bottom borrowing rates, ongoing policy support, and the province’s status as an attractive immigration destination—to the extent that inflows resume—should continue to put a floor under buying and building activity.
Sources for chart and table: Scotiabank Economics, Statistics Canada, CMHC, ON Finance, Wards Automotive.
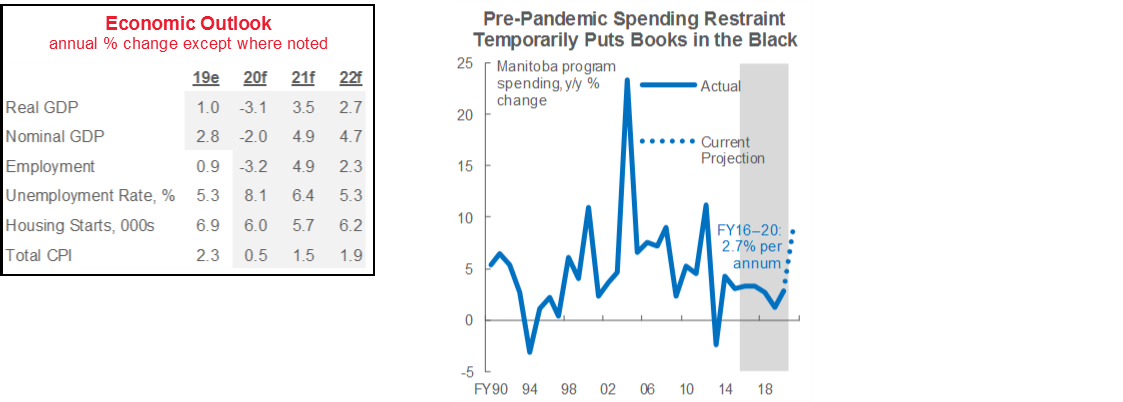
MANITOBA: DIVERSIFICATION ONCE AGAIN CUSHIONS AGAINST RECESSION’S BLOW
Having withstood the peak of the initial phase of the pandemic, Manitoba’s diversified economy again looks to be in position to come out of a recession relatively unscathed. The Province’s broad industrial base helped keep its decline to just 0.2% at the height of the Global Financial Crisis (GFC).
Success containing the virus’ first wave has enabled early reopening and broadly supported labour market outcomes. Jobs in retail & wholesale trade, information, culture & recreation, and accommodation & food services—the sectors most adversely impacted by lockdowns—took a significant hit but account for small employment share relative to other provinces. Meanwhile, the rise to date in full-time, high-wage finance & insurance and professional, scientific & technical services jobs bodes well for a recovery in related incomes.
Data released to date for the agriculture sector suggest a soft start to the year, but the months ahead may yield better results. Excluding direct payments, farm cash receipts were down 6.8% y/y in H1-2020, second-worst among the provinces. Yet prices for cattle, corn, soybeans, and canola—all key products in the Keystone Province—have all seen firmer prices in more recent months amid tight world market supplies, and farmers are reporting above-average harvests due to favourable weather. Sino-Canadian diplomatic tensions remain a challenge—canola and soybean shipments have slowed to a trickle since 2018, though they have seen improvement this year amid lockdown removal and broadly rising Chinese buying.
For trade, Manitoba has been held back by the transportation equipment manufacturing industry as in Ontario. Related shipments—though improving since the summer—appear to have been hit hard by early-year auto sector shutdowns, dominating gains in agriculture and food manufacturing. Aerospace prospects face a particularly uncertain outlook given the near-stop of the travel and airline industries. As well, Manitoba’s well-documented interprovincial export relationships are unlikely to provide much respite from this downturn given the widespread nature of the pandemic, though a solid rebound can reasonably be expected as demand recovers.
Manitoba recently recorded an unexpected $5 mn fiscal surplus in FY20—its first since before the GFC. An income tax revenue windfall—attributed to pre-pandemic household income gains—were the primary driver of the result. Manitoba also kept program spending growth to an annual mean of just 2.7% over FY16–20, the third-lowest rate of any Province over that period and its second-slowest pace in a five-year span since the 1990’s (chart).
Last year’s black ink puts the Province’s balance sheet in a stronger-than-anticipated position entering the pandemic, but fiscal pressures will nonetheless be significant over the medium term. This year, Manitoba expects to run a record $2.9 bn (4% of nominal GDP) shortfall and carry an all-time high net debt burden of 37% of output. Those figures reflect expectations of an historic 8% decline in total revenue and a sizeable 8% jump in total expenditures. Still, the generous spending package—including funds for medical supplies, infrastructure outlays, wage subsidies for students, and workforce participation incentives—may bolster the recovery so long as second wave containment efforts are successful.
Sources for chart and table: Scotiabank Economics, Statistics Canada, CMHC, MB Finance.
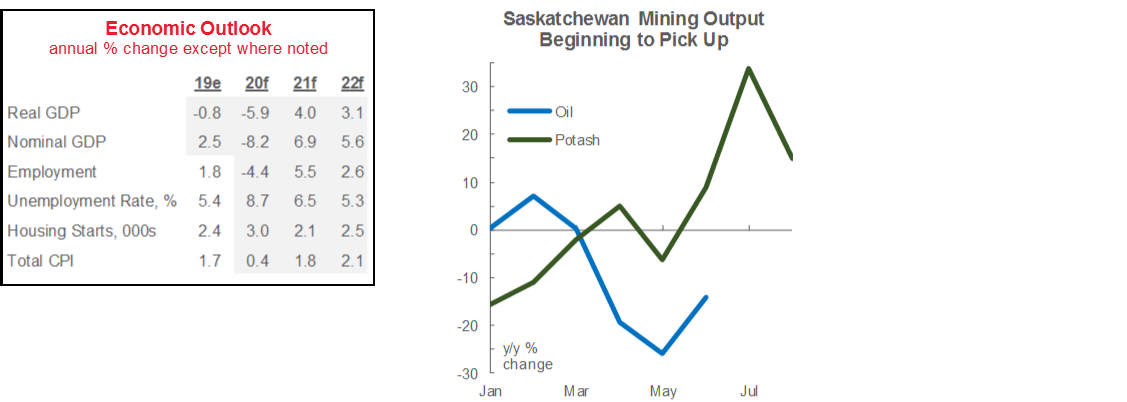
SASKATCHEWAN: VIRUS CONTAINMENT MITIGATES RESOURCE SECTOR TROUBLES
We still expect a deep recession in Saskatchewan in 2020, but have upgraded the province’s outlook over the course of this year, largely as a result of its success in containing COVID-19’s spread.
The significant deterioration in oil and gas industry fortunes has clearly weighed heavily on Saskatchewan’s economy, where the sector accounted for 15% of GDP last year. Halfway through 2020, crude production is down 8.6%—a rate that, if maintained, would represent the steepest annual decline since at least 2000. Accordingly, full-time natural resources employment and oil and gas export values have fallen by more on a y/y ytd basis in Saskatchewan than in either of the other two net oil-producing provinces. The sector may experience some lingering labour market weakness, though full-time jobs have thus far bounced back nicely as oil prices and output have improved and the economy has reopened.
Outside the key energy sector, Saskatchewan has generally seen encouraging labour market results relative to the rest of the country. This partly reflects its success in controlling COVID-19’s first wave, which enabled earlier reopening. Ex-oil and gas, full-time jobs are down just 3.3% y/y ytd—fourth-best among the provinces—while hours worked have also declined by far less than the national average. Full-time construction employment remains soft after plunging precipitously at the height of lockdowns, but has recovered somewhat in recent months. Accommodation and food services employment continues to struggle as is the case across the rest of the world.
The province’s commodity profile outside of oil also looks to be becoming more supportive. Though prices have taken a hit amid pandemic-induced demand weakness, potash production is up on a y/y ytd basis through August (chart). The restart of the Cigar Lake uranium mine—closed since March—also bodes well for resource sector prospects beyond this year, recent COVID-19 infection at the job site notwithstanding.
Perhaps the best economic news to come out of Saskatchewan this year has been the strength of its agriculture industry. Strong lentil prices and production gains helped boost related farm incomes in the first half of the year, dominating softer early-year results for canola and wheat and disruptions in the cattle market. As of August, those gains had helped boost nominal crop exports 33% higher than during the first eight months of last year. As in Manitoba, Saskatchewan is benefiting from stepped-up Chinese buying despite ongoing Sino-Canadian diplomatic tensions.
Saskatchewan’s balance sheet will take a hit this year—an unfortunate result given pre-pandemic plans to return to the black in FY20—but looks set to avoid record fiscal pressures. The Province managed to reduce program spending from FY16 to FY20, an effort that, even if it did not ultimately result in a budgetary surplus, maintains the advantages it held prior to the pandemic. Its forecast net debt-to-GDP ratio of 21% is the lowest in any province. With the benefit of relatively healthy finances, the Province has earmarked $2 bn in infrastructure funds to stimulate job creation and bolster the post-COVID-19 economic recovery over the next two years, a move it expects to boost provincial nominal GDP by $1.2 bn.
Sources for chart and table: Scotiabank Economics, Statistics Canada, CMHC, SK Finance, Saskatchewan Ministry of Energy and Resources.
ALBERTA: PANDEMIC EXTENDS ALREADY LENGTHY RECOVERY
The centre of Canada’s oil and gas industry, Alberta faces a particularly difficult road ahead. This was supposed to be the year that the province recouped its losses from the last commodity price downturn that began in 2014; instead, COVID-19 lockdowns and weak crude values are likely to delay that recovery to the middle of this decade.
With the plunge in oil prices weighing heavily on energy sector activity around the world, we expect Alberta to witness an historic recession this year. Facing broadly cratered oil demand and bloated product inventories built up before the pandemic, Alberta producers throttled back production and capital expenditure. Dominated by Alberta, Canada-wide investment in oil and gas extraction plummeted by 54% (sa q/q) in Q2-2020—more than twice the steepest decline seen during 2015–16. Accordingly, Alberta’s year-to-date plunges in full-time employment and hours worked trail only those of Newfoundland and Labrador, and its nominal exports have fallen further than in any other province.
While an economic recovery has begun to take shape with first wave restrictions eased and improvements in oil prices and drilling, some concerns linger in the province’s labour market. We are encouraged, for instance, by the recovery of retail sales and home purchases, but full-time natural resources sector employment—despite initial resilience to widespread job losses—has seen little upward movement since economic conditions began to get better (chart). . We expect crude prices to rally more convincingly towards the end of 2020, but with a spate of recent oil patch staff reduction announcements, this lingering weakness implies that we have not seen the full impact of the oil price plunge.
The agricultural sector, by contrast, looks to be enjoying a stronger year. Statistics Canada estimates key crops barley, wheat, and canola will experience healthy production increases this year. With the recent price gains for these products and for livestock, the provincial government anticipates that 2020 will be a record year for agricultural sales. The processing industry has also fared well, reflected in y/y ytd nominal food manufacturing export gains.
In respect of the severity of the current downturn, the government has announced a range of longer-run diversification plans. Investment attraction in the agriculture, financial services, and technology industries—as well as in geothermal and hydrogen energy sources—is a focus. The Province is touting its young, educated population, status as a low-cost business jurisdiction, and Edmonton`s reputation as an Artificial Intelligence research hub. These efforts would help guard against future downturns to the extent they come to fruition over the longer-run.
Alongside these longer-horizon initiatives, the near-term will be characterized by stepped-up fiscal support that we deem necessary in the current environment. Pressure on Alberta’s economy and finances notwithstanding, the Province maintains a modest debt-to-GDP ratio relative to other jurisdictions, which leaves some room for economic stimulus. This year, some $8.4 bn has been allocated to the Alberta Capital Plan—an increase of more than 50% versus FY20—with an additional $1.5 bn investment to accelerate work on the Keystone XL pipeline. This has been supplemented by various tax and fee relief measures, as in other regions, and an accelerated 2 ppt reduction in the general corporate income tax rate to spur private-sector investment as of July 1, 2020.
Sources for chart and table: Scotiabank Economics, Statistics Canada, CMHC, Alberta Treasury Board and Finance.
BRITISH COLUMBIA: NEW HEADWINDS EMERGE AFTER SUCCESSFUL PHASE ONE
We anticipate that BC’s economy will be a relatively strong performer among the provinces this year, but region-specific challenges have emerged in the summer months. BC’s broad-based pre-pandemic expansion and fiscal health
were the envy of the provinces: since the last commodity price drop began in 2014, BC’s 14.7% real output gains trailed only those of PEI, and its 13% job creation led all other jurisdictions. That resulted in seven consecutive annual surpluses beginning in FY14, one of the lowest net debt burdens of any Province, and a vaunted AAA credit rating.
BC’s labour market has lost more steam than other jurisdictions since the post-lockdown burst of activity. BC successfully contained the virus’ first wave and was able to ease lockdowns relatively quickly, but full-time employment and hours worked have generally lagged national-level results since April. That partly reflects BC`s industry mix. Information, culture & recreation and accommodation & food services—slammed by cratered tourist activity via COVID-19 restrictions—together accounted for about 10% of BC’s workforce last year—more than any other province. As well, construction, while resilient, is coming off of all-time highs in jobs and homebuilding early last year.
Home sales activity has recovered nicely from early-year lockdowns. Existing home purchases and listings gains in Southern BC cities—in the midst of strong population and employment gains plus elevated housing absorption rates pre-pandemic—have generally outpaced the national mean in the last two months. Pent-up demand appears to be supporting those markets alongside rock-bottom borrowing costs. Yet the outlook is murky. In particular, continued weakness in immigration amid border closures and apprehension about international travel is expected to weaken household formation. Population growth has already cooled to 1.1% y/y in Q2-2020, after hovering near two-decade highs of about 1.6% in 2018–19.
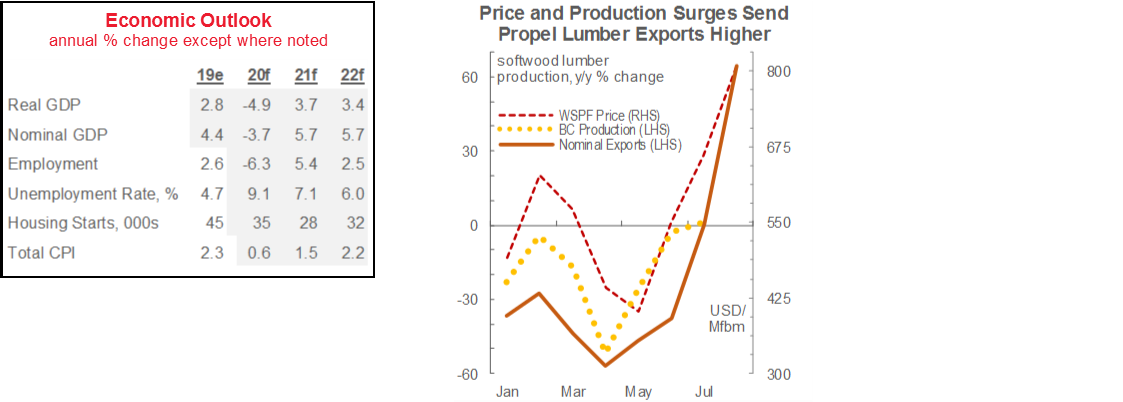
For trade, record prices in the staple lumber industry have helped to offset the drag from still-soft production volumes (chart) and cratered global export demand. Expecting a pandemic-induced plunge in demand, lumber producers cut back output by more than 50% y/y in April. Yet, with hardy US home building and output only beginning to ramp up, prices for Western lumber surged to all-time highs. We anticipate that prices will ease entering 2021, though much depends on pandemic impacts south of the border and producers’ ability to replenish inventories in the winter months.
Work related to the LNG Canada Coastal Gaslink Export Pipeline megaproject is ongoing—albeit with COVID-19-related delays—but the industry faces broadly less certain prospects in the weaker commodity pricing environment. The softer global backdrop has led to cancellations, postponement of construction and investment decisions, and difficulty obtaining funding around the globe; as such, sectoral upside risk that we previously identified in BC is far less likely than before COVID-19. Still, the province maintains advantages such as abundant reserves and shorter shipping distance to Asia than the US Gulf Coast.
With the October 24 provincial election looming, the Province last month released details of its economic recovery plan. Pillars of the plan include a refundable tax credit for firms that hire modest and medium-income employees, and a sales tax rebate on new purchases of new machinery and equipment. These targeted efforts have potential to support job creation and investment activity on the margins, though the course of the virus will undoubtedly be the primary driver of growth going forward.
Sources for chart and table: Scotiabank Economics, Statistics Canada, CMHC, BC Finance, BC Stats, Random Lengths.

DISCLAIMER
This report has been prepared by Scotiabank Economics as a resource for the clients of Scotiabank. Opinions, estimates and projections contained herein are our own as of the date hereof and are subject to change without notice. The information and opinions contained herein have been compiled or arrived at from sources believed reliable but no representation or warranty, express or implied, is made as to their accuracy or completeness. Neither Scotiabank nor any of its officers, directors, partners, employees or affiliates accepts any liability whatsoever for any direct or consequential loss arising from any use of this report or its contents.
These reports are provided to you for informational purposes only. This report is not, and is not constructed as, an offer to sell or solicitation of any offer to buy any financial instrument, nor shall this report be construed as an opinion as to whether you should enter into any swap or trading strategy involving a swap or any other transaction. The information contained in this report is not intended to be, and does not constitute, a recommendation of a swap or trading strategy involving a swap within the meaning of U.S. Commodity Futures Trading Commission Regulation 23.434 and Appendix A thereto. This material is not intended to be individually tailored to your needs or characteristics and should not be viewed as a “call to action” or suggestion that you enter into a swap or trading strategy involving a swap or any other transaction. Scotiabank may engage in transactions in a manner inconsistent with the views discussed this report and may have positions, or be in the process of acquiring or disposing of positions, referred to in this report.
Scotiabank, its affiliates and any of their respective officers, directors and employees may from time to time take positions in currencies, act as managers, co-managers or underwriters of a public offering or act as principals or agents, deal in, own or act as market makers or advisors, brokers or commercial and/or investment bankers in relation to securities or related derivatives. As a result of these actions, Scotiabank may receive remuneration. All Scotiabank products and services are subject to the terms of applicable agreements and local regulations. Officers, directors and employees of Scotiabank and its affiliates may serve as directors of corporations.
Any securities discussed in this report may not be suitable for all investors. Scotiabank recommends that investors independently evaluate any issuer and security discussed in this report, and consult with any advisors they deem necessary prior to making any investment.
This report and all information, opinions and conclusions contained in it are protected by copyright. This information may not be reproduced without the prior express written consent of Scotiabank.
™ Trademark of The Bank of Nova Scotia. Used under license, where applicable.
Scotiabank, together with “Global Banking and Markets”, is a marketing name for the global corporate and investment banking and capital markets businesses of The Bank of Nova Scotia and certain of its affiliates in the countries where they operate, including, Scotiabanc Inc.; Citadel Hill Advisors L.L.C.; The Bank of Nova Scotia Trust Company of New York; Scotiabank Europe plc; Scotiabank (Ireland) Limited; Scotiabank Inverlat S.A., Institución de Banca Múltiple, Scotia Inverlat Casa de Bolsa S.A. de C.V., Scotia Inverlat Derivados S.A. de C.V. – all members of the Scotiabank group and authorized users of the Scotiabank mark. The Bank of Nova Scotia is incorporated in Canada with limited liability and is authorised and regulated by the Office of the Superintendent of Financial Institutions Canada. The Bank of Nova Scotia is authorised by the UK Prudential Regulation Authority and is subject to regulation by the UK Financial Conduct Authority and limited regulation by the UK Prudential Regulation Authority. Details about the extent of The Bank of Nova Scotia's regulation by the UK Prudential Regulation Authority are available from us on request. Scotiabank Europe plc is authorised by the UK Prudential Regulation Authority and regulated by the UK Financial Conduct Authority and the UK Prudential Regulation Authority.
Scotiabank Inverlat, S.A., Scotia Inverlat Casa de Bolsa, S.A. de C.V., and Scotia Derivados, S.A. de C.V., are each authorized and regulated by the Mexican financial authorities.
Not all products and services are offered in all jurisdictions. Services described are available in jurisdictions where permitted by law.