- Colombia: Q1-23 GDP growth was weaker than expected by analysts
- Peru: March brought showers, we expect April flowers
Asia hours saw a slight risk-off drift in trading that was reversed in early-European dealing that also saw the USD flip from mostly higher to mostly lower on the day. Chinese data again surprised to the downside across retail sales, industrial production, and investment prints released in the early hours, to weigh on high-beta/commodity FX. Iron ore is unchanged against a 1.2% drop in copper, while crude oil, also flat, is doing little of the US’s small repurchase plans for its strategic petroleum reserve. US equity futures are roughly unchanged as global markets watch debt ceiling headlines and retail sales data due at 8.30ET.
The Latam release calendar does not present major market-driving data today, for the countries that we often cover, but Uruguay’s central bank is expected to cut its monetary policy rate by 25bps for the second consecutive time at 16ET. Brazilian services sector data at 8ET and Colombian international trade at 11ET (note imports weakness) may be worth a look. In Brazil, the focus may remain on the fiscal rule bill with the rapporteur’s version expected today ahead of a possible vote tomorrow in the lower house.
—Juan Manuel Herrera
COLOMBIA: Q1-23 GDP GROWTH WAS WEAKER THAN EXPECTED BY ANALYSTS
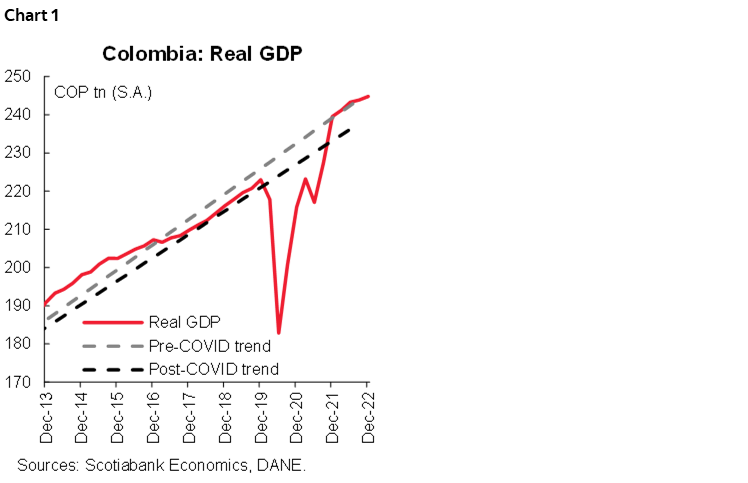
Data released on Monday by Colombia's statistical agency, DANE, showed that Colombia's real GDP grew by 3.0% y/y in 1Q-2023, below both consensus (3.4% y/y according to Bloomberg) and our forecast of 3.5% y/y. Growth was +1.4% q/q on a seasonally adjusted basis (chart 1), with positive contributions from financial and insurance activities, leisure, and public services.
The economic activity data for 1Q-23 show that private consumption has been slowing significantly in the durable and semi-durable goods categories, while basic consumer goods, as well as services, register gains. In addition, DANE revised downward the path of GDP for 2022, which implies that the speed of growth and overheating of consumption is lower than that initially published by DANE. We believe that this is one of the signals that BanRep will use to consider stopping the hiking cycle and leave the policy rate at 13.25% at the next meeting.
Despite the deceleration, GDP growth results for Q1-23 reflect the resilience of the post-Covid economy, especially in services sectors, which continue to record significant growth amid a crowded calendar during the first quarter of the year full of large events and the return of various typical festivities.
On the demand side, private consumption moderated, growing by 3.6% y/y in Q1, while a year ago it grew by more than 11% y/y. Investment contracted 10.3% y/y, especially in machinery and equipment (-8.0% y/y), along with buildings other than housing (-0.4% y/y).
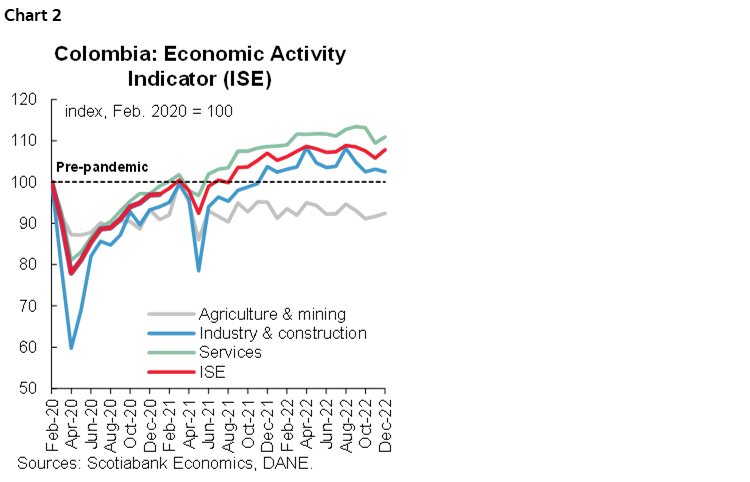
According to the monthly indicator (ISE, chart 2), economic activity showed a still positive but less strong variation of 1.6% y/y in March (+0.4% m/m, seasonally-adjusted). The highest growth rate was in leisure (+14.8% y/y), finance and insurance (+10.2% y/y), mining and quarrying (+5.8 y/y), and public administration (+2.6% y/y). Those that contracted were construction (-4.6% y/y), commerce, transport, and restaurants (-2.6% y/y), and manufacturing (-0.8% y/y). In seasonally adjusted terms, the negative balance was driven by construction (-1.2% m/m sa), professional activities (-0.2% m/m sa), and commerce, transportation, and restaurants (-0.1% m/m sa).
Regarding the GDP Q1-23 performance from the supply side, we highlight:
- The sectors that contributed the most in the first quarter were activities related to leisure (+0.8 ppt), financial and insurance activities (+0.5 ppt), and manufacturing (+0.3 ppt).
- During the first quarter of 2023, the services sectors continued to outperform the sectors related to the production of goods (chart 3). The largest expansions came from financial and insurance activities (+22.8% y/y) and leisure (18.7% y/y). The construction sector was the one that contracted (-3.1% y/y) explained by the civil works component that registered a drop of -14.9% y/y during Q1-23.

- On a seasonally adjusted basis, mining was the sector that grew the most (+4.5% q/q) along with leisure and financial and insurance activities, showing a strong rebound (+4.4% q/q in both sectors). However, the sectors that showed worse performance were the construction sector (-1.3 q/q) and manufacturing (-0.6% q/q), especially due to a moderation in the demand for durable and semi-durable goods (chart 4).

Expenditure side GDP Q1-23:
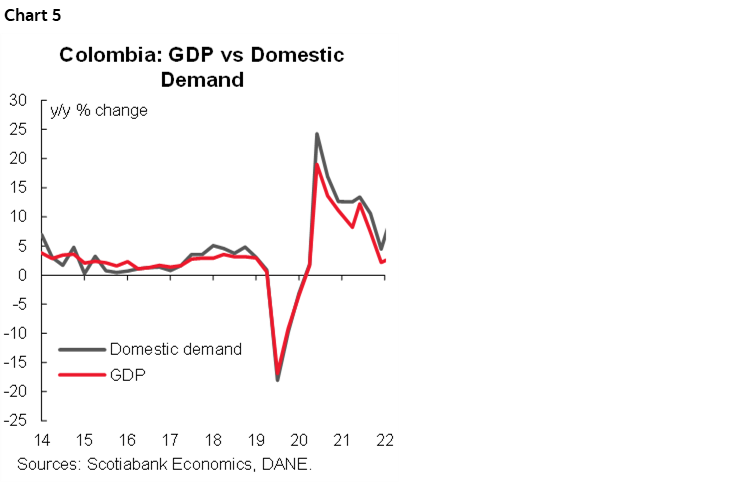
- Domestic demand contracted 0.1% y/y in 1Q-2023 (chart 5), reaching levels not seen since 2020. Likewise, on a seasonally adjusted basis, domestic demand contracted -0.6% q/q sa for the second consecutive quarter.
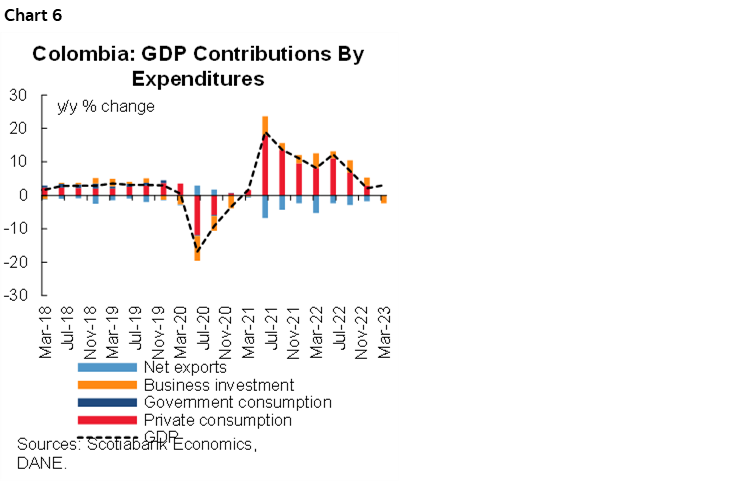
- Private consumption (+3.6% y/y) continued to contribute positively to growth, particularly on the component of services and nondurable goods by households at 3.5 ppts and 0.5 ppts respectively (chart 6). In seasonally adjusted quarterly terms, private consumption posted a mild growth of 0.6% q/q sa. which is mainly explained by inflationary pressures and higher interest rates. As for public consumption, it registered a fall of -0.2% y/y and presented a q/q variation of 7.4%, showing a greater execution of government resources by the new government.
- Investment contracted 10.3% y/y during the first quarter of 2023. In seasonally adjusted terms, it also registered a 9.2% q/q drop, its the lowest figure since 2020. This drop is mainly due to the component of machinery and equipment (-8.0% y/y), along with buildings other than housing (-0.4% y/y). In seasonally adjusted terms, the largest decline occurred in the machinery and equipment sector (-6.2% q/q, s.a.), the largest since the pandemic.
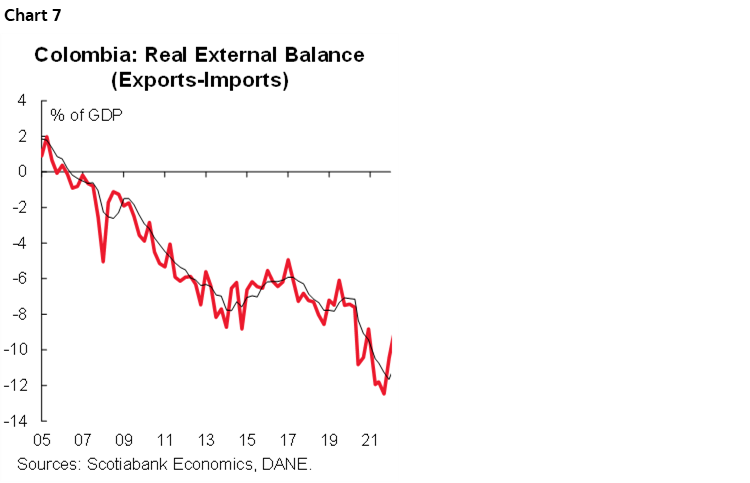
- The real external deficit in Q1-23 represented 9.0% of GDP (chart 7). Exports grew (+5.1% y/y), while imports contracted (-7.5% y/y), reflecting the impact of lower primary activities given lower production despite high external prices, which contributed to reducing the negative external deficit.
Activity data for the first quarter of 2023 showed a sharper slowdown than expected by the analyst consensus, both on the supply side and on spending. A moderation in the production and demand of durable and semi-durable goods is observed, while the sectors related to financial activities, services, and leisure are the ones that have the most positively marked economic activity.
We expect the moderation trend to continue, so we believe that this is another signal for BanRep to make 13.25% the maximum rate of this hiking cycle. Thus, our call is for rate stability at the June meeting, at 13.25%, until October, when we expect BanRep to start discussing rate cuts.
—Sergio Olarte, Santiago Moreno, & Jackeline Piraján
PERU: MARCH BROUGHT SHOWERS, WE EXPECT APRIL FLOWERS
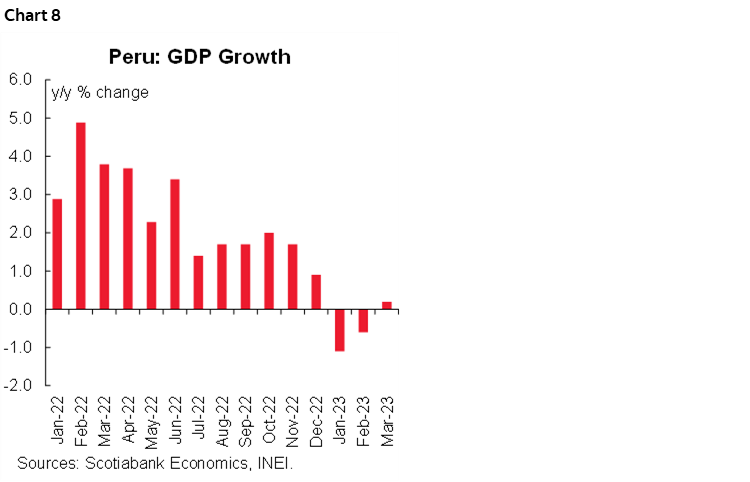
March GDP growth disappointed, coming in at 0.2% y/y, below both our expectations of 1.0%, and the market consensus at 1.3% (chart 8). The main surprise was the 9.7% y/y decline in telecommunications. Other sectors with negative growth in both y/y and m/m terms included agriculture, financial services, and construction (which plummeted 12.4% y/y). Our main concern, however, is the 7.1% y/y decline in non-resource manufacturing, with no rebound in sight (table 1). Commerce is a bit of a puzzle, up a fairly robust 3.0% y/y, but down a disquieting 4.2% in m/m terms. Of course, the whole of Q1 is difficult to interpret, given the ebb-and-flow of protests.
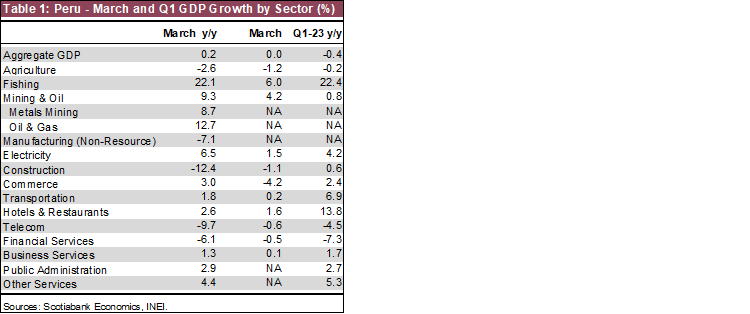
On the plus side, mining is back on track to start to lead in growth, up with moderate strength in both y/y and m/m terms and rebounding nicely from the protest months. Electricity is tracking nicely as well, although it is being supported by the energy-intensive Quellaveco mine and is thus outperforming the economy. One sector that has not suffered the longer-term impact of the protests that we had once feared is hotels and restaurants.
March GDP growth was too weak to overturn the declines of February (-0.6% y/y) and January (-1.1% y/y). Judging from the negative data for agriculture and commerce in March, growth in the month would have appeared to have been hampered by the El Niño rains and flooding.
April should be a more normal month, with no protests and more moderate rains. Early indicators for April suggest that the rebound will be moderately stronger. Mining growth will subsist thanks to Quellaveco, agriculture will be less affected by rains, construction could hardly do worse in April than March’s sharp decline. Moreover, April was a much more normal month, with no special factors such as severe weather or protests interfering. That alone should mean greater growth of at least 2.0%. Perhaps more.
The issues that appeared in Q1 are already in our forecasts, and as a result, we are maintaining our forecast of 1.9% growth for full-year 2023. The risk is that a more intense El Niño sever weather phenomenon is on the horizon. Peru’s El Niño monitoring institution released its May report giving El Niño a 66% probability of occurring in the Southern hemisphere summer that begins in December. It’s still too early to determine its intensity.
—Guillermo Arbe
DISCLAIMER
This report has been prepared by Scotiabank Economics as a resource for the clients of Scotiabank. Opinions, estimates and projections contained herein are our own as of the date hereof and are subject to change without notice. The information and opinions contained herein have been compiled or arrived at from sources believed reliable but no representation or warranty, express or implied, is made as to their accuracy or completeness. Neither Scotiabank nor any of its officers, directors, partners, employees or affiliates accepts any liability whatsoever for any direct or consequential loss arising from any use of this report or its contents.
These reports are provided to you for informational purposes only. This report is not, and is not constructed as, an offer to sell or solicitation of any offer to buy any financial instrument, nor shall this report be construed as an opinion as to whether you should enter into any swap or trading strategy involving a swap or any other transaction. The information contained in this report is not intended to be, and does not constitute, a recommendation of a swap or trading strategy involving a swap within the meaning of U.S. Commodity Futures Trading Commission Regulation 23.434 and Appendix A thereto. This material is not intended to be individually tailored to your needs or characteristics and should not be viewed as a “call to action” or suggestion that you enter into a swap or trading strategy involving a swap or any other transaction. Scotiabank may engage in transactions in a manner inconsistent with the views discussed this report and may have positions, or be in the process of acquiring or disposing of positions, referred to in this report.
Scotiabank, its affiliates and any of their respective officers, directors and employees may from time to time take positions in currencies, act as managers, co-managers or underwriters of a public offering or act as principals or agents, deal in, own or act as market makers or advisors, brokers or commercial and/or investment bankers in relation to securities or related derivatives. As a result of these actions, Scotiabank may receive remuneration. All Scotiabank products and services are subject to the terms of applicable agreements and local regulations. Officers, directors and employees of Scotiabank and its affiliates may serve as directors of corporations.
Any securities discussed in this report may not be suitable for all investors. Scotiabank recommends that investors independently evaluate any issuer and security discussed in this report, and consult with any advisors they deem necessary prior to making any investment.
This report and all information, opinions and conclusions contained in it are protected by copyright. This information may not be reproduced without the prior express written consent of Scotiabank.
™ Trademark of The Bank of Nova Scotia. Used under license, where applicable.
Scotiabank, together with “Global Banking and Markets”, is a marketing name for the global corporate and investment banking and capital markets businesses of The Bank of Nova Scotia and certain of its affiliates in the countries where they operate, including; Scotiabank Europe plc; Scotiabank (Ireland) Designated Activity Company; Scotiabank Inverlat S.A., Institución de Banca Múltiple, Grupo Financiero Scotiabank Inverlat, Scotia Inverlat Casa de Bolsa, S.A. de C.V., Grupo Financiero Scotiabank Inverlat, Scotia Inverlat Derivados S.A. de C.V. – all members of the Scotiabank group and authorized users of the Scotiabank mark. The Bank of Nova Scotia is incorporated in Canada with limited liability and is authorised and regulated by the Office of the Superintendent of Financial Institutions Canada. The Bank of Nova Scotia is authorized by the UK Prudential Regulation Authority and is subject to regulation by the UK Financial Conduct Authority and limited regulation by the UK Prudential Regulation Authority. Details about the extent of The Bank of Nova Scotia's regulation by the UK Prudential Regulation Authority are available from us on request. Scotiabank Europe plc is authorized by the UK Prudential Regulation Authority and regulated by the UK Financial Conduct Authority and the UK Prudential Regulation Authority.
Scotiabank Inverlat, S.A., Scotia Inverlat Casa de Bolsa, S.A. de C.V, Grupo Financiero Scotiabank Inverlat, and Scotia Inverlat Derivados, S.A. de C.V., are each authorized and regulated by the Mexican financial authorities.
Not all products and services are offered in all jurisdictions. Services described are available in jurisdictions where permitted by law.