- Colombia: Economic activity contracted in Q3-23 amid significant drop in investment and further slowdown of private consumption; consumer confidence improves for third consecutive month in October
- Peru: September GDP: nothing new on the horizon
Bull flattening curves are unwinding some of Wednesday’s moves on US retail sales/PPI and IG issuance, alongside USD gains generally extending from the dollar’s worst levels on Tuesday, mixed commodity prices, and US equity futures holding a range with a negative bias.
The overnight session had stronger than expected, but mixed, Australian employment data and another decline in Chinese home prices, and a so-so outturn of yesterday’s Biden-Xi meeting that saw but symbolical gestures. In other US news, the Senate approved the House’s short-term funding bill, as expected; see you in January for the next episode of US fiscal negotiation risks. In the G10 day ahead, US jobless claims at 8.30ET is the data highlight, coming at the same time as import/export price indices and forty-five minutes prior to industrial production figures. Central bank speaking appearances continue.
The MXN is the best performing key major on the day, thanks to a 0.1/2% gain that sees the cross test the 17.25 zone, on track for a 2% appreciation on the week that has the peso trading at its best levels since late–September that coincides with a dollar-negative wave since late-October. Other key FX are mixed, the AUD and NZD are down 0.2% and 0.4%, while the JPY and EUR are holding flat. SPX futures are 0.1% lower after a minor 0.2% gain yesterday, with the main Eurozone and UK indices suffering losses—especially the latter—that are more aligned with a 1.5% drop in HK and 0.8% in China. WTI/Brent are shedding 0.5%, against iron ore prices and copper up ~1% and 0.5%, respectively.
Following yesterday’s headliners, Peru and Colombia GDP (see below), we have a relatively quiet Latam day ahead where the main releases will be the results to the BCCh’s traders survey at 7.30ET and BanRep’s economists survey (time TBD); Colombia’s DANE also publishes international trade figures at 10ET. Uruguay’s central bank decides on policy today, with a 25bps cut to 9.25% expected. Brazilian markets reopen today after Wednesday holidays.
Mexico’s AMLO meets China’s Xi, Japan’s Kishida, and Canada’s Trudeau, so maybe the president will be too busy to comment on the fact that Tesla has not applied for permits from the country’s energy commission for its planned factory in Nuevo Leon. Continued delays in the construction of this plant may check the optimism about nearshoring investment in the country. In semi-related news, Starlink won a tender for internet and mobile phone services to the CFE, Mexico’s federal electricity commission, aimed at communications infrastructure in rural Mexico.
It will be interesting to see how many traders expect a return to a 75bps cut at the BCCh’s December decision. In the pre-decision survey, in October, the median trader saw an 8.25% policy rate at year-end—but this was coming off an expected 75bps cut in October versus the 50bps that was actually announced. Last month’s inflation data and a decent appreciation of the CLP—which admittedly looked shaky until a few days ago—may motivate a bigger cut by the central bank, we’ll see if traders agree. For reference, the median expected a 50bps cut in January, which will likely remain unchanged in today’s release.
As for BanRep’s economists survey, it could have been that after yesterday’s weak GDP data there would be an even greater consensus among those polled that rate cuts will begin in December, by more than 25bps. The October edition of the survey had the median economist seeing a 12.75% reference rate, i.e. a 50bps cut, though there is a chance that—prior to yesterday’s soft economic data—still-sticky inflation and the caution demonstrated by some peers (namely the BCCh) meant that at the time of the survey some economists had actually pushed their projection for a first reduction to January, or reduced the expected cut size in December. Our team believes that Q3 GDP figures tilt the balance in favour of a 25 or 50bps cut next month, though it remains a close call amid minimum wage negotiations and upside inflation risks.
We’re also keeping a close eye on the reaction in markets to Petro’s request to end the country’s fiscal rule as expressed (somewhat off the cuff) in a public appearance yesterday; he also said BanRep needs to cut interest rates, coupled with countercyclical public spending. These comments were similar to those made last night by Fin Min, and BanRep board member, Bonilla who said that the country needs to reactivate investment rather than focus its attention on debt repayments.
—Juan Manuel Herrera
COLOMBIA: ECONOMIC ACTIVITY CONTRACTED IN Q3-23 AMID SIGNIFICANT DROP IN INVESTMENTS AND FURTHER SLOWDOWN OF PRIVATE CONSUMPTION
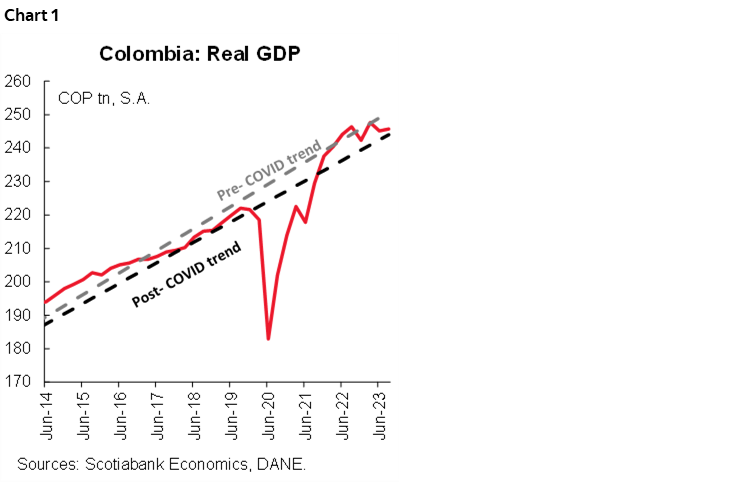
Data released this Wednesday, November 15th, by the National Statistics Administration (DANE) show that Colombia’s real GDP contracted by 0.3% YoY in 3Q-2023, lower than our forecast and market consensus (0.4% YoY and 0.5% YoY, respectively). Manufacturing, retail sales, and construction were the three sectors that contributed most to the GDP contraction, offset by public administration, mining and quarrying, agriculture, and leisure-related activities. On a seasonally adjusted basis (chart 1), there was a modest growth of 0.2% QoQ, representing a recovery from the -1 % QoQ decline in the previous quarter. According to the Economic Activity Index (ISE), Colombia weakened significantly in September as some services-related sectors, such as leisure and financial services, started to deliver weaker results; this is something to keep an eye on.
From the demand side, in Q3-2023, private consumption continued moderating. Demand for durable and semi-durable goods delivered a very weak performance (-12,8% YoY and -7.2% YoY, respectively). In comparison, consumption of non-durable goods such as food accelerated (+0.6% YoY expansion), while services consumption slowed (+0.4% YoY). However, the main draw in the Q3-2023 GDP came from a significant drop in investments (-33.5% YoY), which is significantly explained by a drop or more in inventories, while fixed capital formation fell by 11% YoY, both in machinery and equipment investment and in construction (residential and non-residential).
Although the headline could generate some concern, previous results show that the economic activity is moving to a more sustainable level, closing the output gap, which could contribute to reducing demand pressures on inflation in the future. According to Scotiabank Economics calculations, the current GDP level implies a neutral output gap. However, the previous dynamic is not as compatible with unemployment and inflation results that reflect some resiliency signals with solid job creation and very sticky service prices.
Today’s economic activity data and recent inflation data could tilt the balance towards a potential rate cut of between 25 and 50 bps at BanRep’s December 19th meeting. However, having a rate cut in December remains a close call, so it is essential to continue monitoring other relevant indicators such as the minimum wage negotiation, El Niño weather phenomenon impact and potential increases in regulated prices, and the evolution of services-related inflation.
Highlights
From the supply side:
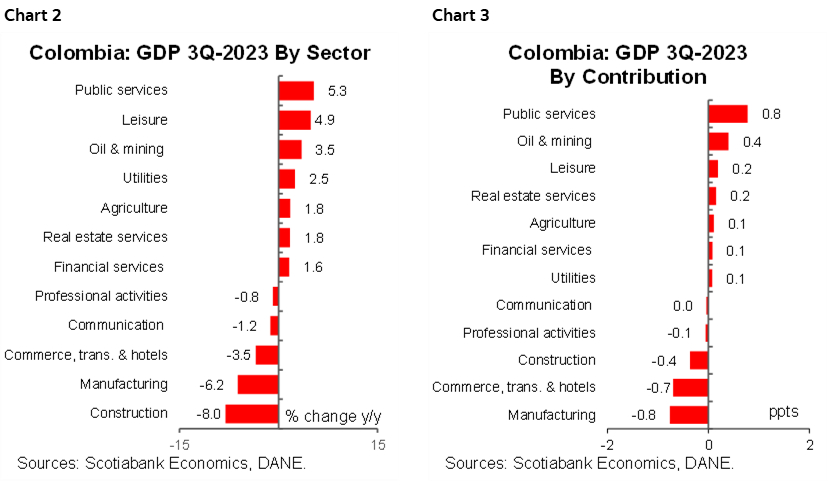
- The sectors that contracted the most during the third quarter were manufacturing (-6.2% YoY and a contribution of -0.8 pp), commerce, transport and accommodation (-3.5% YoY and a contribution of -0.7 pp), and construction (-8% YoY and a contribution of -0.4 pp). Thus, these sectors represented -1.9 pp of the total GDP variation in the third quarter.
- On the other hand, the sectors that most compensated for the fall with the most significant expansions and contributions came from the activities of public administration and defense, education, human health activities (+5.3% YoY and 0.8 pp), exploitation of mines and quarries (3.5% YoY and 0.4 pp), agriculture (+1.8% YoY and 0.2 pp) and artistic and entertainment activities (4.9% YoY and 0.2 pp). These sectors contributed positively by 1.6 pp to the total variation (chart 2 and chart 3).
- In seasonally adjusted terms, construction was the sector that contracted the most with an inter-monthly variation of -2.7% QoQ, followed by manufacturing and entertainment services (-1.6% QoQ and -0.9% QoQ respectively). On the other hand, the exploitation of mines (+2% QoQ), agriculture (+1.2% QoQ), public administration and defense activities, education and health (+0.9% QoQ) were the sectors that grew the most.
From the expenditure side:
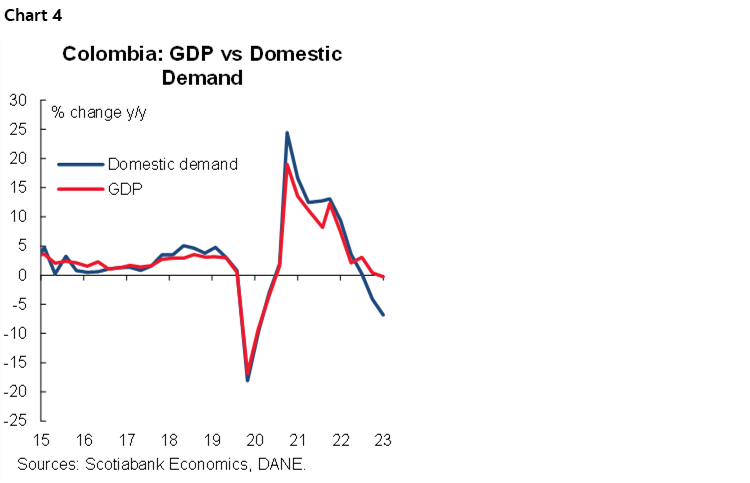
- Domestic demand contracted by 6.8% YoY in Q3-2023 (chart 4), for the second consecutive quarter and reaching contraction rates not seen since 2020. Additionally, on a seasonally adjusted basis, domestic demand contracted by 2.2% QoQ, for the fifth consecutive quarter.
- Final consumption expenditure continued to contribute positively to growth, albeit at a slower pace (0.7% YoY and a contribution of 0.6 pp). In particular, household consumption grew by 0.4% YoY (driven by defensive goods with +0.6% YoY and 0.2pp and services with 2.2% YoY and 1.2 pp, offsetting the fall in durables and semi-durables), while general government spending grew by 1.9% YoY (driven by its three components: collective consumption expenditure, individual market, and individual non-market).
- In seasonally adjusted quarterly terms, final consumption expenditure recorded a growth of 1.1% QoQ, which was attributed to a decrease in public consumption expenditure which contracted by 5.4% QoQ. On the other hand, final household consumption expenditure grew by 0.4% QoQ, driven by spending on non-durable goods and services (+0.3% QoQ each), which offset the falls in both spending on durable and semi-durable goods (-2.1% QoQ and -1.5% QoQ, respectively).
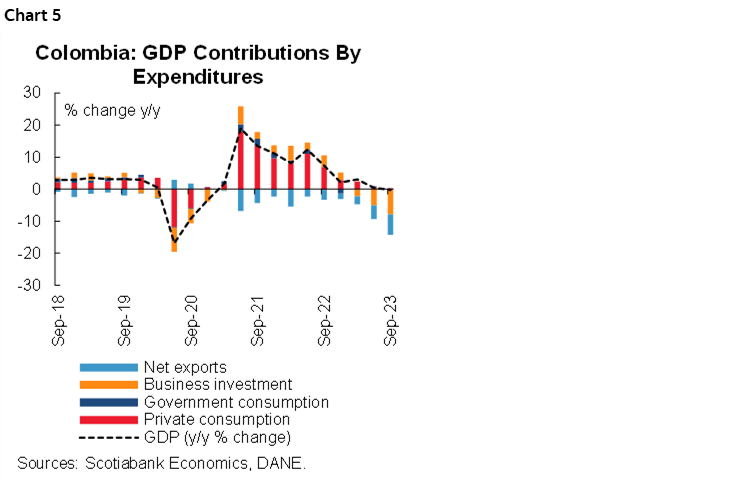
- Gross capital formation contracted by 33.5% YoY and contributed negatively with -8 pp to the total GDP variation during the third quarter of 2023, even surpassing the maximum levels recorded during the pandemic (chart 5). This decline is mainly associated with a contraction in gross fixed capital formation (investments), which contracted by 11.0% YoY driven by the fall in machinery and equipment (-15.8% YoY), followed by non-residential buildings and housing (-13% YoY and -3.2% YoY, respectively). It is worth noting that inventories contraction was of more than 100%, which dragged 5.7 ppts to the overall economy performance. Something that reflects the effect of weaker demand.
- In seasonally adjusted terms, it also recorded a decrease of -4.4% QoQ, a better record compared to the previous quarter when it contracted 25.6% QoQ. On the other hand, gross fixed capital formation contracted by 1.5% QoQ, a smaller decrease than in the previous quarter (-6% QoQ in Q2-2023). Within this component, the most significant declines occurred in non-residential buildings (-5% QoQ) and machinery and equipment (-1.8% QoQ), both completing four consecutive quarters in negative territory. On the other hand, the housing sector had a slight boost by growing 3.7% QoQ.
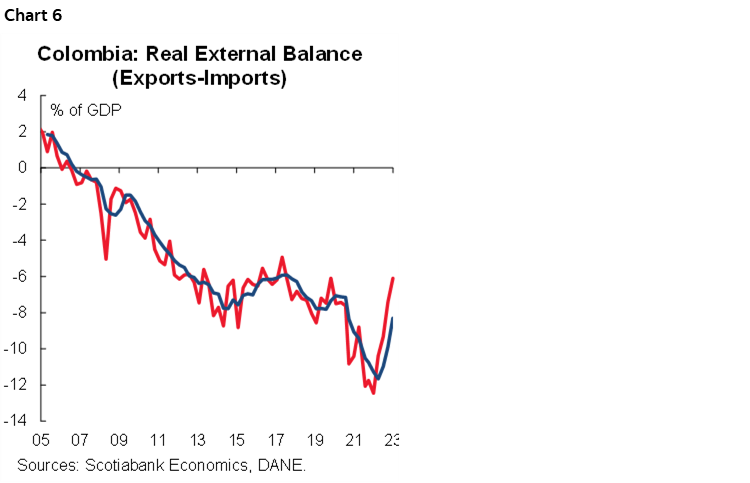
- The constant external deficit in Q3-2023 represented 6.1% of GDP (chart 6). Exports grew by 4.2% YoY with a contribution of 1 pp, while imports contracted by 21.5% YoY and a contribution of 6.2 pp, reflecting the impact of the demand reduction, contributing to the reduction of the negative external deficit.
Economic Activity Indicator (ISE):
- In September 2023, the ISE showed a decrease of -0.1% YoY (chart 7), due to a contraction in manufacturing (-5.2% YoY and -0.6 pp), commerce, transport and accommodation (-2.8% YoY and -0.6 pp), construction (-3% YoY and -0.1pp) and artistic and entertainment activities (-4.6% YoY and -0.3 pp), the latter recording the lowest level not seen since the pandemic. On the other hand, the sectors that most compensated for the fall with the most significant growths and contributions were the activities of public administration and defense, education, human health activities (+4% YoY and 0.7 pp), agriculture (+3% YoY and 0.3 pp) and exploitation of mines and quarries (6.4% YoY and 0.3 pp).
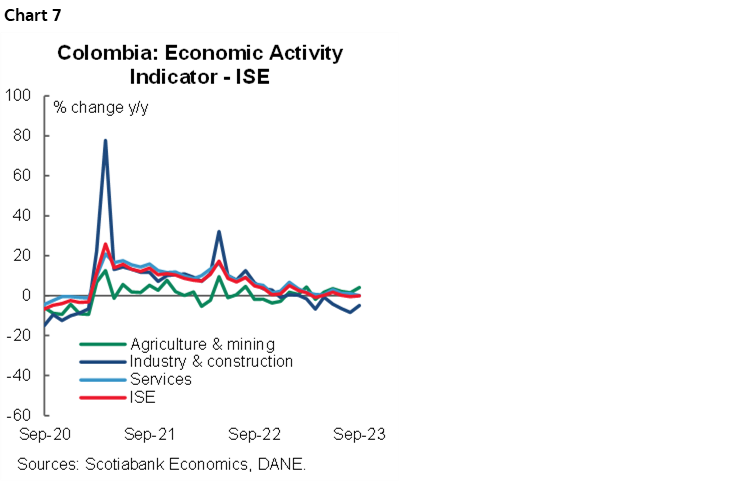
- In seasonally adjusted terms, the ISE showed a growth of 0.1% MoM in September, driven by a growth of +0.8% MoM in primary activities, and of +0.3% MoM and +0.5% MoM in secondary and tertiary activities respectively. By sectors, the greatest expansion occurred in artistic and entertainment activities (+2.8% MoM), while the construction sector was the one that recorded the greatest contraction (-2.6% MoM).
—Jackeline Piraján & Santiago Moreno
COLOMBIA: CONSUMER CONFIDENCE IMPROVES FOR THIRD CONSECUTIVE MONTH IN OCTOBER
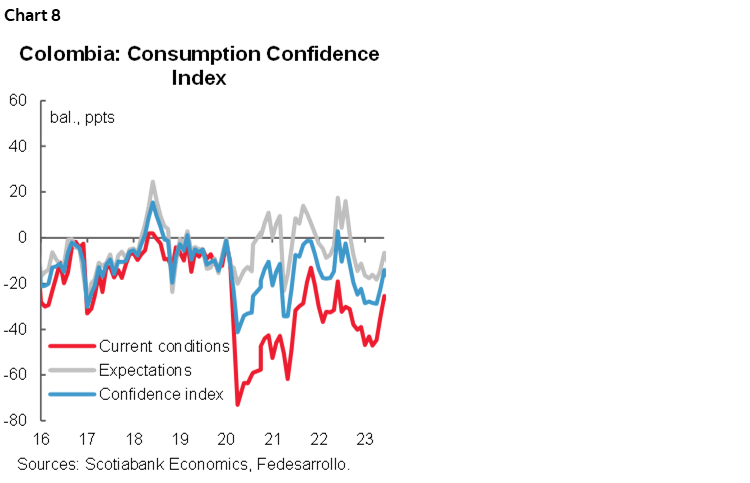
Colombia’s Consumer Confidence Index (CCI) stood at -14.0% in October, an increase of 3.9 percentage points versus September (-18.8 %). The improvement was driven by a 7.2 percentage point increase in the Consumer Expectations Index component. Meanwhile, the Economic Conditions Index deteriorated by 1.1 percentage points (chart 8). It is worth noting that this survey has referenced the period before regional elections; that said, it will be relevant to monitor if the confidence index continues improving in forthcoming months.
The Consumer Confidence Index (CCI) presented a similar improvement to the balance recorded in June of this year (-14.1%). This time, the performance was driven by a significant increase in consumer expectations. The results reflect an improvement in the perception of economic conditions in general and in the country in a 12-month period. However, it contrasts with a deterioration in expectations about the economic conditions of their households, which is associated with the deterioration in the willingness to buy durable goods and vehicles.
Even though the latest inflation data have shown a decrease in the price of vehicles and durable goods, the willingness to buy vehicles by households stood at -65.6% and the willingness to buy durable goods at -33.8%, which represents a decrease in both indicators of 6.2 ppts and 0.3 ppts, respectively. On the other hand, the willingness to buy housing showed an increase of 9.6 ppts, standing at -45.8%.
Looking at the October details:
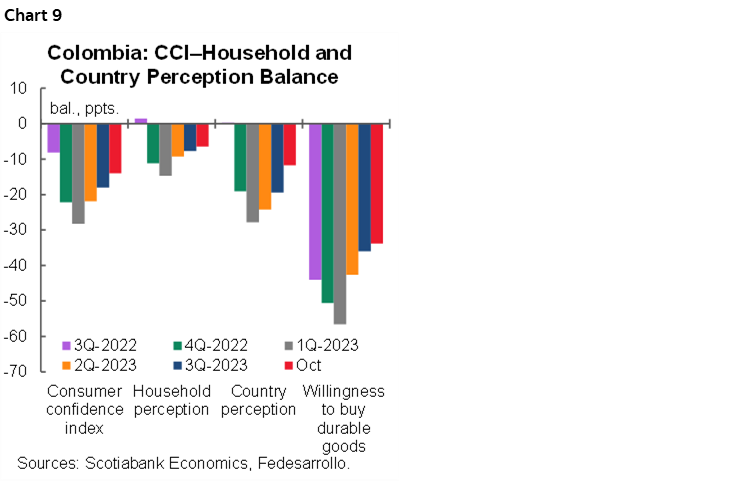
- The Economic Conditions Index stood at -29.9%, dropping 1.1 percentage points from the previous month. Although inflation has eased in recent months, high interest rates continue to put pressure on households’ financial burden. Although in the previous month this indicator was the main contributor to an increase in the Consumer Confidence Index, this time, the perception of households regarding current economic conditions compared to those of a year ago fell from -24% in September to -26% in October, adding to the slight deterioration in the willingness to buy durable goods, which stood at -33.8% (chart 9).
- The expectations index stood at -3.5%, an improvement of 7.2 percentage points versus September. Households improved their perception in a 12-month frontier on the overall economic conditions to -16.1%, the lowest level since September 2022, added to which the perception of the country’s economic conditions in the same time frontier stood at -7.3%, representing an increase of 5.3 ppts vs. the previous record (-12.6%). This could be associated to a better outlook, especially in an exchange rate that has managed to stabilize near 4,000 pesos, which could be reflecting a greater confidence in the current government.
- By cities, the Consumer Confidence Index improved significantly in the capital city, Bogota, going from -16.9% in September to -9.4% in October. The city of Cali also showed a positive variation from -13.8% to -8.6%. On the other hand, the city that reported the greatest deterioration was Barranquilla, with a drop of 12.8 ppts to -21.8%.
- By socioeconomic levels, the middle and low-income groups presented improvements in the indicator. The low-income group had a CCI of -12.4%, registering an increase of 5.3 ppts with respect to the -17.7% of the previous month. In the middle-income group, confidence stood at -12.3%, an increase of 3.8 ppts from the previous month. Meanwhile, the high-income group registered a decrease of 8 ppts to -43.8%.
Consumer confidence completed three months in a row of improvement. Although the results show signs of a better outlook for the future, current economic conditions do not seem to be helping households to increase their willingness to buy durable goods. Inflation data show a decrease in the prices of durable goods; however, the monetary policy adopted by the Central Bank has significantly contracted the demand for goods. This is reflected in the behaviour of retail sales, which in September showed a contraction of 9.3% YoY, in addition to a slowdown in general economic activity, which in September contracted by -0.1% YoY.
—Daniela Silva
PERU: SEPTEMBER GDP: NOTHING NEW ON THE HORIZON
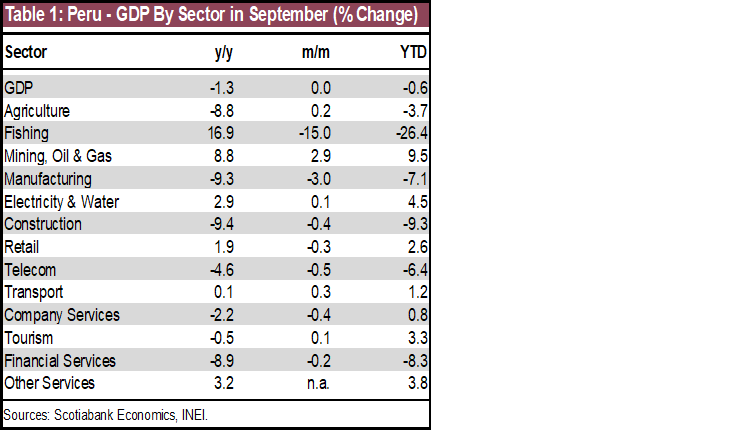
The GDP result for September reflects the downturn that Peru’s economy is currently going through. The 1.3% YoY drop was not only the second largest decline so far in 2023, but it was even more pronounced than the -0.8% drop of our most recent estimate and the -0.6% that the market consensus expected. With the September result, GDP fell 1.0% YoY in 3Q23, completing three consecutive quarters of decline. In addition, the accumulated GDP in the last 12 months as of September stood at 0%, on the way to the -0.2% that we project at the end of 2023.
Although one would be tempted to think that the negative evolution is due to the impact on primary sectors of the El Niño climate event, the reality is that most of the decline is due to weak domestic demand. In fact, only the agricultural sector was affected (table 1), particularly agro-export products such as blueberries and avocado, due to lower yields as a result of high temperatures associated with El Niño. What’s more, if it were not for the mining and oil & gas sector, GDP in September would have fallen an additional 1 p.p. (chart 10).
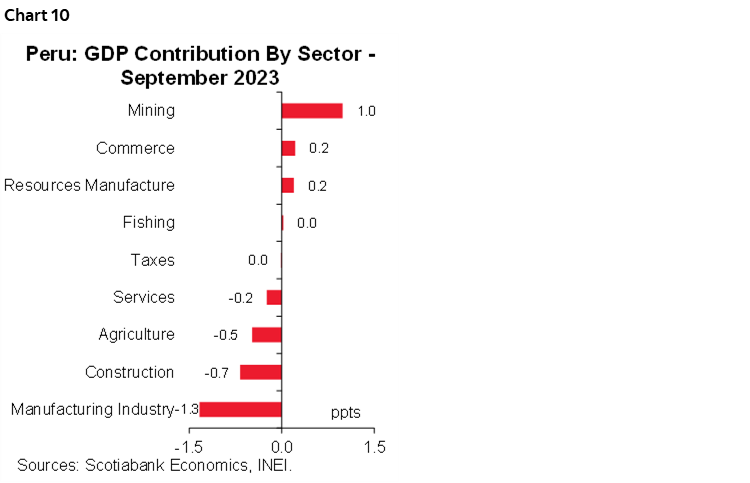
Weak domestic demand affected the non-resource sectors, particularly manufacturing industry and construction, which together subtracted 2 p.p. from GDP growth in September. We continue to be extremely concerned about the evolution of manufacturing, which has been affected not only by the weakness of private consumption and the fall in investment, but also by lower exports demand, particularly in the textile and clothing industry.
We estimate that the October GDP growth result will continue to be negative, but less so than in September. The early start of the second anchovy fishing season should benefit the fishing and resource processing sectors, although its low weight within aggregate GDP would limit its positive impact. Something similar would happen with the greater production of oil & gas (+2.8%). On the other hand, we predict that sectors linked to domestic demand such as manufacturing Industry, construction and services will have continued declining in October. The latter, and the decreasing trend in inflation, reinforces our expectation that the BCRP will cut its reference interest rate by an additional 25bps at its meeting on December 14th.
—Pablo Nano
DISCLAIMER
This report has been prepared by Scotiabank Economics as a resource for the clients of Scotiabank. Opinions, estimates and projections contained herein are our own as of the date hereof and are subject to change without notice. The information and opinions contained herein have been compiled or arrived at from sources believed reliable but no representation or warranty, express or implied, is made as to their accuracy or completeness. Neither Scotiabank nor any of its officers, directors, partners, employees or affiliates accepts any liability whatsoever for any direct or consequential loss arising from any use of this report or its contents.
These reports are provided to you for informational purposes only. This report is not, and is not constructed as, an offer to sell or solicitation of any offer to buy any financial instrument, nor shall this report be construed as an opinion as to whether you should enter into any swap or trading strategy involving a swap or any other transaction. The information contained in this report is not intended to be, and does not constitute, a recommendation of a swap or trading strategy involving a swap within the meaning of U.S. Commodity Futures Trading Commission Regulation 23.434 and Appendix A thereto. This material is not intended to be individually tailored to your needs or characteristics and should not be viewed as a “call to action” or suggestion that you enter into a swap or trading strategy involving a swap or any other transaction. Scotiabank may engage in transactions in a manner inconsistent with the views discussed this report and may have positions, or be in the process of acquiring or disposing of positions, referred to in this report.
Scotiabank, its affiliates and any of their respective officers, directors and employees may from time to time take positions in currencies, act as managers, co-managers or underwriters of a public offering or act as principals or agents, deal in, own or act as market makers or advisors, brokers or commercial and/or investment bankers in relation to securities or related derivatives. As a result of these actions, Scotiabank may receive remuneration. All Scotiabank products and services are subject to the terms of applicable agreements and local regulations. Officers, directors and employees of Scotiabank and its affiliates may serve as directors of corporations.
Any securities discussed in this report may not be suitable for all investors. Scotiabank recommends that investors independently evaluate any issuer and security discussed in this report, and consult with any advisors they deem necessary prior to making any investment.
This report and all information, opinions and conclusions contained in it are protected by copyright. This information may not be reproduced without the prior express written consent of Scotiabank.
™ Trademark of The Bank of Nova Scotia. Used under license, where applicable.
Scotiabank, together with “Global Banking and Markets”, is a marketing name for the global corporate and investment banking and capital markets businesses of The Bank of Nova Scotia and certain of its affiliates in the countries where they operate, including; Scotiabank Europe plc; Scotiabank (Ireland) Designated Activity Company; Scotiabank Inverlat S.A., Institución de Banca Múltiple, Grupo Financiero Scotiabank Inverlat, Scotia Inverlat Casa de Bolsa, S.A. de C.V., Grupo Financiero Scotiabank Inverlat, Scotia Inverlat Derivados S.A. de C.V. – all members of the Scotiabank group and authorized users of the Scotiabank mark. The Bank of Nova Scotia is incorporated in Canada with limited liability and is authorised and regulated by the Office of the Superintendent of Financial Institutions Canada. The Bank of Nova Scotia is authorized by the UK Prudential Regulation Authority and is subject to regulation by the UK Financial Conduct Authority and limited regulation by the UK Prudential Regulation Authority. Details about the extent of The Bank of Nova Scotia's regulation by the UK Prudential Regulation Authority are available from us on request. Scotiabank Europe plc is authorized by the UK Prudential Regulation Authority and regulated by the UK Financial Conduct Authority and the UK Prudential Regulation Authority.
Scotiabank Inverlat, S.A., Scotia Inverlat Casa de Bolsa, S.A. de C.V, Grupo Financiero Scotiabank Inverlat, and Scotia Inverlat Derivados, S.A. de C.V., are each authorized and regulated by the Mexican financial authorities.
Not all products and services are offered in all jurisdictions. Services described are available in jurisdictions where permitted by law.