- Chile: December CPI fell 0.5% m/m to 3.9% y/y
- Peru: Happy New Year!
It’s been more of the same, meaning not much in terms of macro drivers, in Asia hours and early Europe as markets continue to digest debt supply somewhat erratically while waiting for the release of US CPI on Thursday. Tokyo inflation was pretty much in line, German industrial production disappointed yet again in November data, while Eurozone unemployment came in lower than expected.
Global curves are steepening though only marginally in the US compared to a much clearer selloff in EGBs and gilts given their busy auction calendar and in a catch-up to post-Europe weakness in USTs. US equity futures are correcting a small share of the gains made in US trading yesterday, SPX futures are down 0.3%. WTI and Brent are similarly unwinding a decent share of yesterday’s steep drop, rising 2%, while iron ore and copper are marginally weaker. The USD is stronger against most majors but in small ranges for most currencies, including the MXN that sits flat at writing.
Following yesterday’s surprising miss in Chilean CPI (see below) that triggered a strong rally in Chilean front-end rates and a 1.5% drop in the CLP , we have Mexican and Colombian inflation out today at 7ET and 18ET, respectively, as the data highlights. The BCCh’s traders’ survey results published yesterday showed the median still expecting a 75bps cut at the next meeting, but based on price action yesterday and the opinion of economists there is a chance that the central bank may consider a larger cut—though pronounced CLP weakness would reduce the odds of this. In Chile, we’ll also get a name for who will replace Garcia at the BCCh.
In the case of Mexican inflation, we already have data for the first half of December so the bar is high for a miss/beat in the full month data that is large enough to motivate a repricing of the timing of the first Banxico rate cut—which remains likely to come in March. Our economists project a 4.56% y/y and 0.61% that is roughly equal to the Bloomberg median, representing an acceleration from the 4.32% recorded in November while holding a ~0.6% m/m increase. As for core inflation, we see only a small deceleration to 5.20% from 5.30% (0.55% m/m), so data remain on a positive overall trend, but Banxico cannot yet be confident enough to tee up the start of easing more clearly.
As for Colombia, 2023 is expected to have ended with the first single digit year-on-year headline inflation print since June 2022. We estimate that inflation slowed to 9.40% (9.45% median) from 10.15% y/y in November on a 0.47% m/m rise in prices (0.58% median). Core is still seen in double digits around the mid-10s given sticky indexation and minimum-wage effects. Though the sub-10% print is encouraging in a way, it will likely be the January data that are more important for policy rate expectations. That will be when base effects become very favourable and when we see the effects of indexation on overall price growth. With that, BanRep could have more certainty about the path for inflation and maybe consider a larger cut, if warranted.
—Juan Manuel Herrera
CHILE: DECEMBER CPI FELL 0.5% M/M, FOR A 3.9% Y/Y PACE
- Another downside surprise for the BCCh scenario would lead to the assessment of a cut of between 75 and 125 basis points at the January meeting
On Monday, January 8th, the statistical agency (INE) released December CPI, which fell 0.5% m/m, below market expectations (-0.1% m/m) and reversing the upside surprises registered in November, closing the year with a y/y inflation of 3.9%, which is very close to our 3.7% projection that we maintained for all of 2023. This figure (last record of the current CPI basket) confirms our early diagnosis of transitory effects registered in November that would be strongly reversed in the December CPI. This led us to project ahead of the market that December inflation would be negative, which was then internalized by asset prices.
This would put year-on-year inflation at 3% or below during Q1-24, as we have been forecasting for months, well ahead of the latest December IPoM, which expects inflation to return to target during Q4-24. In our view, the monetary authority’s diagnosis observed a further surprise, which reveals that monetary policy is still behind the curve. We estimate that, at the next meeting on January 31st, the central bank would assess cuts of between 75 and 125 bps, slightly more than the central scenario of the recent corridor (between 50 and 75 bps).
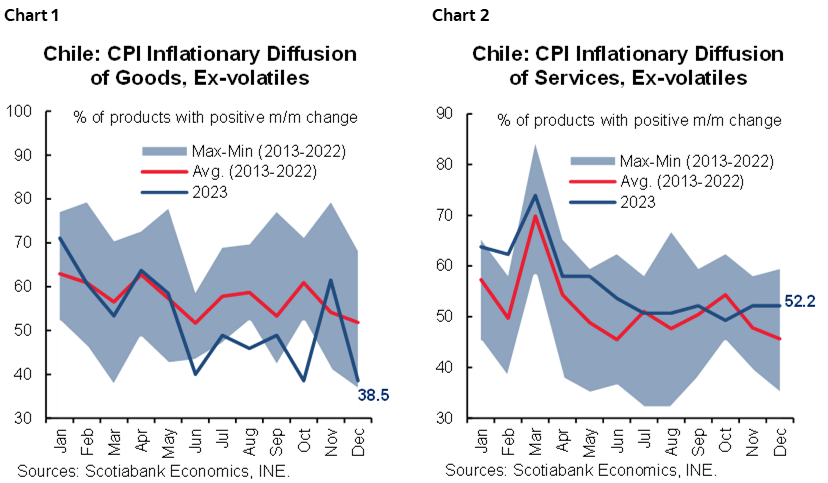
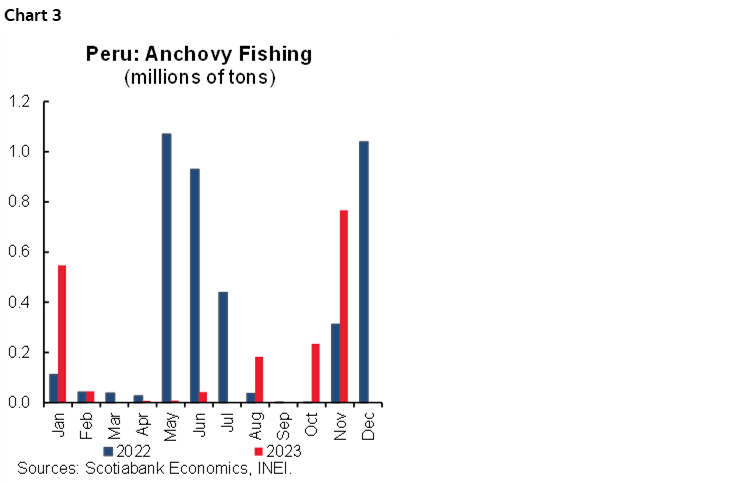
Ex-volatile (core) inflation again surprised the Central Bank’s baseline scenario. The core CPI fell 0.2% m/m to 5.4%, which is well below the 5.8% projected by the Central Bank in its December IPoM. In terms of composition, the negative variation was not only explained by reversals in prices of volatile products that had risen in November, but also by declines in prices of goods in the component that excludes volatile products (charts 1 and 2). It should be recalled that, in the December meeting, the Central Bank acknowledged that the core component had accumulated downward differences since the September IPoM, which led to an advance in the convergence of inflation to the target for the first half of 2024, but not total inflation according to the Central Bank. At Scotiabank, we reaffirm our total inflation projection at—or below—3% during the first quarter of this year.
We project year-over-year inflation to stabilize slightly below 4% in January and February. The new basket will start to be implemented for the January CPI, to be released on February 8th, bringing with it a higher weight of food and a lower weight of education. Although in the next two CPIs we could see year-on-year inflation stabilize at its current level or slightly below, in March it would fall sharply again to be at or below the 3% target. In this sense, we reiterate that in March we would see a lower upward impact of education services in the CPI, which usually represents about 70% of the month’s inflation.
—Aníbal Alarcón
PERU: HAPPY NEW YEAR!
2024 seems to have arrived with better tidings than 2023. Over the past few days the Government has released information on the growth evolution of the resource sectors (here called “primary” sectors) for November. The numbers were better than we had been expecting. So much so, in fact, that the data has made us hopeful that November’s GDP growth may have been positive, breaking with six consecutive months in negative territory.
This does not necessarily mean a turning point—it will be a challenge for December’s GDP to grow due to the expected drop in fishing GDP—but it seems to anticipate that the worst of the slowdown in economic activity will have come to an end.
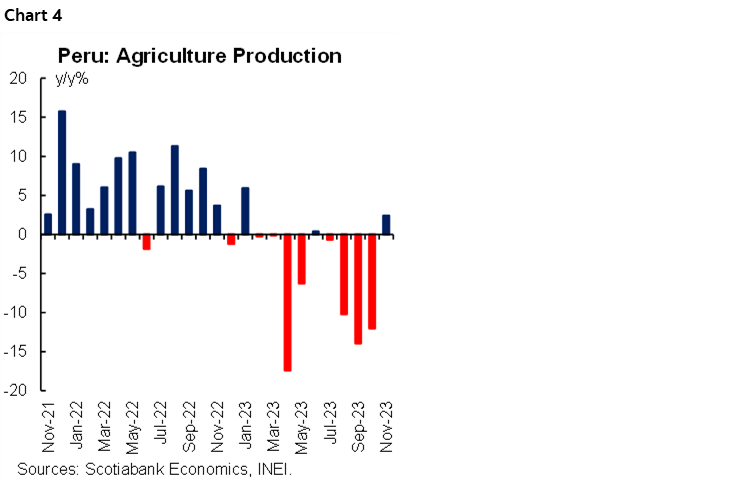
The improvement in November would have had to do in part with a collateral benefit from the arrival of the El Niño Phenomenon (FEN). Indeed, given the probability that the FEN will become more intense as summer progresses in the southern hemisphere—which would have made it difficult to catch species such as anchovy—the Government chose to bring the start of the fishing season forward to October. As a result, in November fishing GDP rose 60.9% y/y, thanks to a greater number of fishing days—in November 2022 only seven days were recorded versus thirty days in 2023—which allowed the capture of 766,000 mt compared to 311,000 mt in November 2022 (see chart 3).
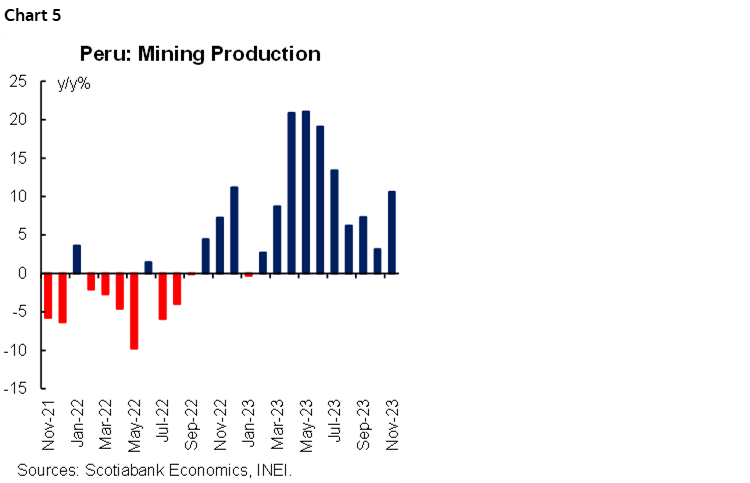
Likewise, agricultural & livestock GDP growth, was up a positive 1.2% y/y in November, breaking with four consecutive months of decline, thanks to the unexpected rebound in agricultural production (+2.4%), which had just recorded three months of double-digit decline (see chart 4) as a consequence of the impact of high temperatures associated with FEN on crop yields.
The greatest component of agricultural growth in November was the greater production of grapes (+27.6%)—mainly for export—as high temperatures brought the harvest period forward by almost three weeks, benefitting November over December. Therefore, the steep increase in production in November does not mean that total grape production for the entire campaign will grow, but rather, that it will end ahead of its usual March timeframe. In addition, greater rice production (+22.9%) was also due to higher temperatures which allowed for the development of the complementary campaign (“small campaign”) on the north coast, which normally harvests between November and January.
Finally, the mining and oil & gas sector surprised with a stronger than expected 8.0% y/y growth, led by mining production (+10.6), which registered its highest growth since July (see chart 5). This result is even more commendable since the positive statistical effect on copper production from the start of the Quellaveco megaproject culminated in September 2023, ending the year-on-year positive base effect. Precisely, copper production led growth (+11.7%), followed by gold production (+9.7%)—which has been showing a recovery since August. Molybdenum also contributed, up 19.5%, which makes more sense as Quellaveco’s molybdenum plant began its operations in May 2023.
—Pablo Nano
DISCLAIMER
This report has been prepared by Scotiabank Economics as a resource for the clients of Scotiabank. Opinions, estimates and projections contained herein are our own as of the date hereof and are subject to change without notice. The information and opinions contained herein have been compiled or arrived at from sources believed reliable but no representation or warranty, express or implied, is made as to their accuracy or completeness. Neither Scotiabank nor any of its officers, directors, partners, employees or affiliates accepts any liability whatsoever for any direct or consequential loss arising from any use of this report or its contents.
These reports are provided to you for informational purposes only. This report is not, and is not constructed as, an offer to sell or solicitation of any offer to buy any financial instrument, nor shall this report be construed as an opinion as to whether you should enter into any swap or trading strategy involving a swap or any other transaction. The information contained in this report is not intended to be, and does not constitute, a recommendation of a swap or trading strategy involving a swap within the meaning of U.S. Commodity Futures Trading Commission Regulation 23.434 and Appendix A thereto. This material is not intended to be individually tailored to your needs or characteristics and should not be viewed as a “call to action” or suggestion that you enter into a swap or trading strategy involving a swap or any other transaction. Scotiabank may engage in transactions in a manner inconsistent with the views discussed this report and may have positions, or be in the process of acquiring or disposing of positions, referred to in this report.
Scotiabank, its affiliates and any of their respective officers, directors and employees may from time to time take positions in currencies, act as managers, co-managers or underwriters of a public offering or act as principals or agents, deal in, own or act as market makers or advisors, brokers or commercial and/or investment bankers in relation to securities or related derivatives. As a result of these actions, Scotiabank may receive remuneration. All Scotiabank products and services are subject to the terms of applicable agreements and local regulations. Officers, directors and employees of Scotiabank and its affiliates may serve as directors of corporations.
Any securities discussed in this report may not be suitable for all investors. Scotiabank recommends that investors independently evaluate any issuer and security discussed in this report, and consult with any advisors they deem necessary prior to making any investment.
This report and all information, opinions and conclusions contained in it are protected by copyright. This information may not be reproduced without the prior express written consent of Scotiabank.
™ Trademark of The Bank of Nova Scotia. Used under license, where applicable.
Scotiabank, together with “Global Banking and Markets”, is a marketing name for the global corporate and investment banking and capital markets businesses of The Bank of Nova Scotia and certain of its affiliates in the countries where they operate, including; Scotiabank Europe plc; Scotiabank (Ireland) Designated Activity Company; Scotiabank Inverlat S.A., Institución de Banca Múltiple, Grupo Financiero Scotiabank Inverlat, Scotia Inverlat Casa de Bolsa, S.A. de C.V., Grupo Financiero Scotiabank Inverlat, Scotia Inverlat Derivados S.A. de C.V. – all members of the Scotiabank group and authorized users of the Scotiabank mark. The Bank of Nova Scotia is incorporated in Canada with limited liability and is authorised and regulated by the Office of the Superintendent of Financial Institutions Canada. The Bank of Nova Scotia is authorized by the UK Prudential Regulation Authority and is subject to regulation by the UK Financial Conduct Authority and limited regulation by the UK Prudential Regulation Authority. Details about the extent of The Bank of Nova Scotia's regulation by the UK Prudential Regulation Authority are available from us on request. Scotiabank Europe plc is authorized by the UK Prudential Regulation Authority and regulated by the UK Financial Conduct Authority and the UK Prudential Regulation Authority.
Scotiabank Inverlat, S.A., Scotia Inverlat Casa de Bolsa, S.A. de C.V, Grupo Financiero Scotiabank Inverlat, and Scotia Inverlat Derivados, S.A. de C.V., are each authorized and regulated by the Mexican financial authorities.
Not all products and services are offered in all jurisdictions. Services described are available in jurisdictions where permitted by law.