- US job gains continue at a robust pace…
- ….while wage growth accelerated
- The outcome reinforces Federal Reserve guidance
- Are multiple job holders distorting the gains?
- US Nonfarm payrolls, m/m 000s // UR (%), November, SA:
- Actual: 263 / 3.7
- Scotia: 205 / 3.6
- Consensus: 200 / 3.7
- Prior: 284 / 3.7 (revised from 261 / 3.7)
US job growth continued at a fairly robust pace last month as layoffs likely held back the pace of gains that would have been even more powerful otherwise. Wage growth accelerated.
The beat to consensus and my estimate was within the 90% confidence interval around nonfarm estimates (+/- 120k) but that never fusses markets. They just looked at the beat relative to the fear factor that’s waiting for the other shoe to drop and sold everything. The S&P is down by just ½% on the day but the two-year Treasury yield is up 13bps and the 10 year is up 4bps in a bear flattener. Terminal rate pricing edged up by about 12bps and has reversed about half of the decline following Chair Powell’s speech. The dollar initially strengthened but has given back most of that now.
There are probably no direct implications for the Federal Reserve’s script into the meeting the week after next. They’ve already largely pre-determined that the fed funds rate will go up by 50bps and the expected terminal rate will go “somewhat higher” which sounds like a consensus view around about 5%. One data point won’t change this for the Fed especially given concern toward forward-looking downside risks into 2023.
DETAILS EMPHASIZE WAGE GAINS
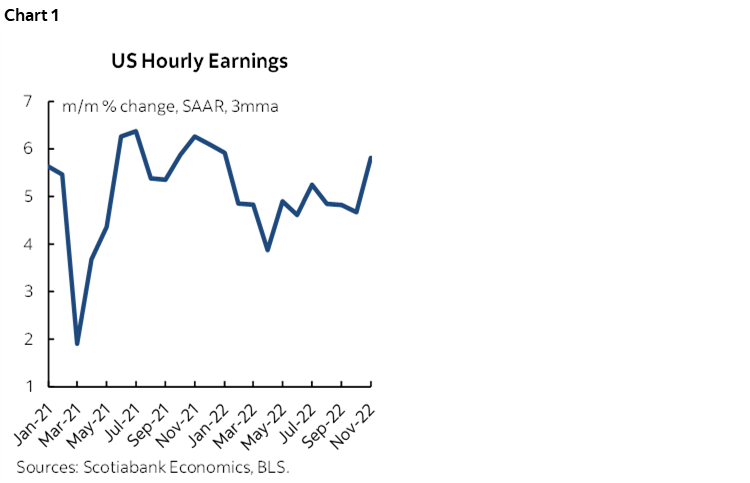
Wage growth accelerated. It was up by 0.6% m/m seasonally adjusted which translates into 6.8% at an annualized rate. That’s a resumption of the quickest wage gain since late last year (chart 1). It’s just one month of acceleration so far but the baseline gains leading into that month were already fairly elevated. The prior month’s gain was also revised up to about 0.5% m/m SA which translates into 5.7% m/m SAAR.
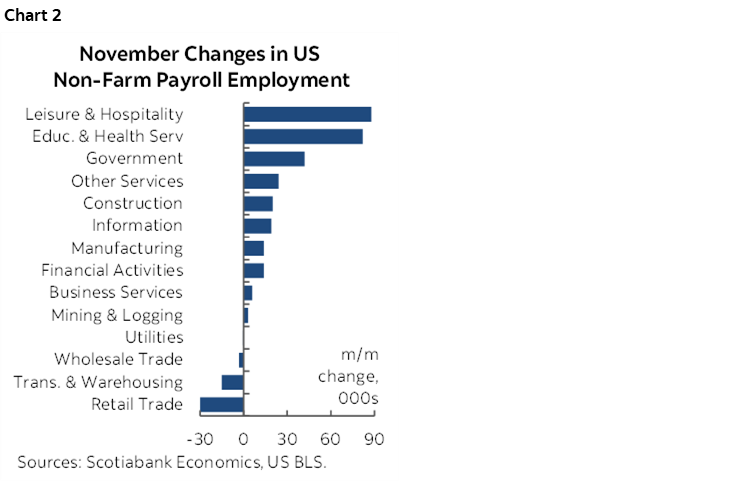
There was high breadth to the gain (chart 2). Services employment was up by 184k with goods up 37k, construction up 20k and manufacturing was up 14k. Within services, education/health up 82k, leisure/hospitality up 88l, government up 42k all state/local. Retail down 30k which goes against the strong holiday season angle (3 consecutive declines)
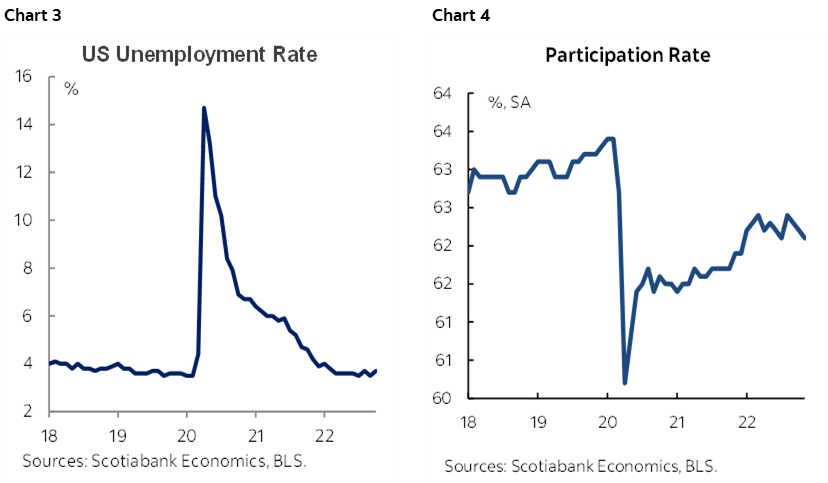
The unemployment rate held steady at 3.7% (chart 3). It is derived from the companion household survey that showed a bigger decline in the labour force (-186k) than the decline in employment (138k) from that survey. The participation rate slipped (chart 4). The household survey has a higher margin of error around it than payrolls but it also captures off-payroll small business employers.
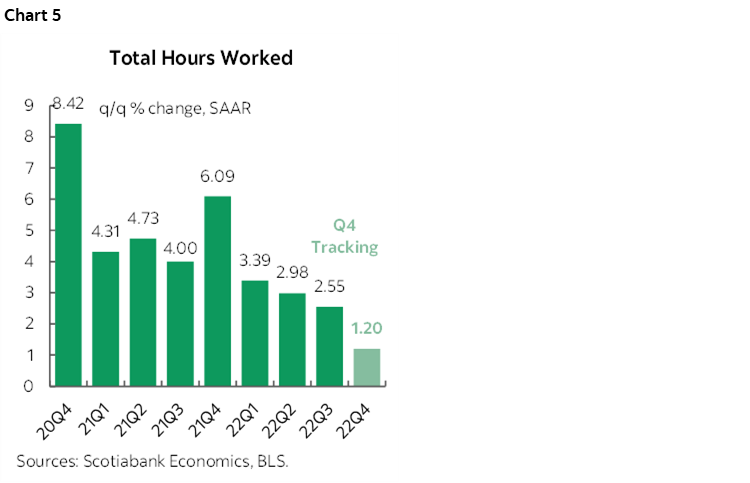
Hours worked slipped by 0.1% m/m SA. They are tracking a gain of just over 1% q/q at an annualized rate (chart 5). Since GDP is an identity defined as hours times labour productivity this is supportive of Q4 GDP growth.
MULTIPLE JOB HOLDERS NOT THE CULPRIT
It’s worth taking a closer look at an issue that has drawn criticism of the payroll numbers this year. Do they overstate job growth in the US economy because of double counting?
On the one hand it’s true that nonfarm counts jobs, not workers (so double/triple etc counting risk) versus the household survey that tracks bodies and is therefore not susceptible to double counting jobs. The other household survey difference is that it also captures employers without formal payrolls better (ie: small biz).
The evidence points to how the household survey of employment fell by 138k in November with a 186k drop in the size of the labour force. So on the surface that might suggest that the discrepancy between the two job measures is due to double counting.
But we need to look at the household survey’s details to see if double counting was really an issue.
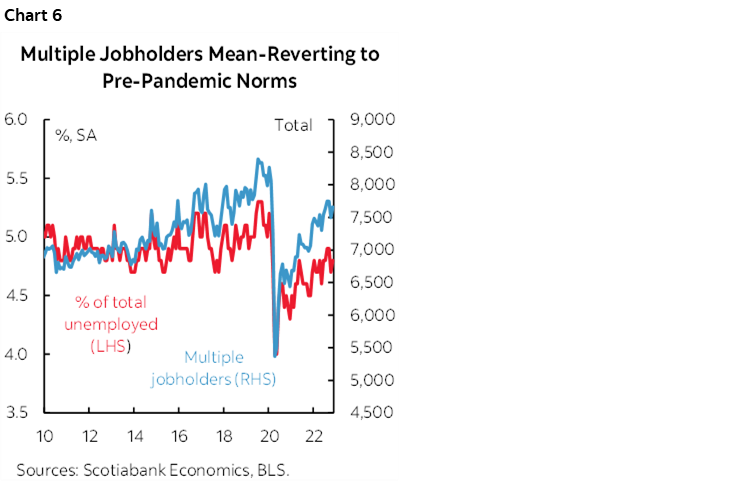
The household survey’s measure of multiple job holders has been mostly moving sideways since about mid-year. It has also mean-reverted toward pre-pandemic norms after getting crushed in the depths of the pandemic (chart 6). One cannot dismiss job gains because of unusual gains by multiple job holders and therefore treat payrolls as fake data. A job's a job in my books so if we're just mean-reverting then that's a.o.k. by me. Americans are doing what they have to in reverting to prior ways of paying the bills.
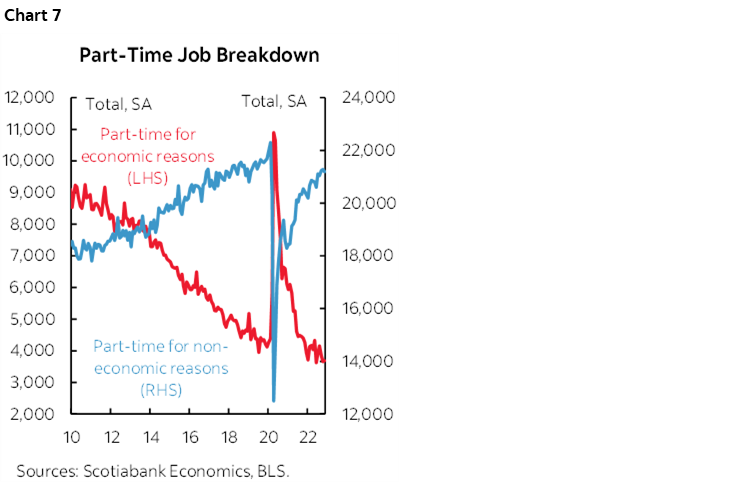
Further, I like looking at the household survey’s measure of folks who are working part-time for economic reasons which was flat (+25k) in November after a 183k drop in October which doesn't lean toward more people having to take on multiple part-time jobs and inflate the payrolls data for economic reasons. Part-time voluntary jobs (not for econ reasons) were down 77k in Nov and up only 41k. What has happened is that American part-time jobs for non-economic reasons have gone back up toward pre-pandemic levels but part-time for economic reasons has gone back down toward pre-pandemic levels (chart 7).
Another problem is that the household survey is wildly volatile and with much wider confidence bands than nonfarm. It was up by about 650k in August and Sept and is now down by 466k in Oct/Nov. The trend is volatile but still tentatively up.
DISCLAIMER
This report has been prepared by Scotiabank Economics as a resource for the clients of Scotiabank. Opinions, estimates and projections contained herein are our own as of the date hereof and are subject to change without notice. The information and opinions contained herein have been compiled or arrived at from sources believed reliable but no representation or warranty, express or implied, is made as to their accuracy or completeness. Neither Scotiabank nor any of its officers, directors, partners, employees or affiliates accepts any liability whatsoever for any direct or consequential loss arising from any use of this report or its contents.
These reports are provided to you for informational purposes only. This report is not, and is not constructed as, an offer to sell or solicitation of any offer to buy any financial instrument, nor shall this report be construed as an opinion as to whether you should enter into any swap or trading strategy involving a swap or any other transaction. The information contained in this report is not intended to be, and does not constitute, a recommendation of a swap or trading strategy involving a swap within the meaning of U.S. Commodity Futures Trading Commission Regulation 23.434 and Appendix A thereto. This material is not intended to be individually tailored to your needs or characteristics and should not be viewed as a “call to action” or suggestion that you enter into a swap or trading strategy involving a swap or any other transaction. Scotiabank may engage in transactions in a manner inconsistent with the views discussed this report and may have positions, or be in the process of acquiring or disposing of positions, referred to in this report.
Scotiabank, its affiliates and any of their respective officers, directors and employees may from time to time take positions in currencies, act as managers, co-managers or underwriters of a public offering or act as principals or agents, deal in, own or act as market makers or advisors, brokers or commercial and/or investment bankers in relation to securities or related derivatives. As a result of these actions, Scotiabank may receive remuneration. All Scotiabank products and services are subject to the terms of applicable agreements and local regulations. Officers, directors and employees of Scotiabank and its affiliates may serve as directors of corporations.
Any securities discussed in this report may not be suitable for all investors. Scotiabank recommends that investors independently evaluate any issuer and security discussed in this report, and consult with any advisors they deem necessary prior to making any investment.
This report and all information, opinions and conclusions contained in it are protected by copyright. This information may not be reproduced without the prior express written consent of Scotiabank.
™ Trademark of The Bank of Nova Scotia. Used under license, where applicable.
Scotiabank, together with “Global Banking and Markets”, is a marketing name for the global corporate and investment banking and capital markets businesses of The Bank of Nova Scotia and certain of its affiliates in the countries where they operate, including; Scotiabank Europe plc; Scotiabank (Ireland) Designated Activity Company; Scotiabank Inverlat S.A., Institución de Banca Múltiple, Grupo Financiero Scotiabank Inverlat, Scotia Inverlat Casa de Bolsa, S.A. de C.V., Grupo Financiero Scotiabank Inverlat, Scotia Inverlat Derivados S.A. de C.V. – all members of the Scotiabank group and authorized users of the Scotiabank mark. The Bank of Nova Scotia is incorporated in Canada with limited liability and is authorised and regulated by the Office of the Superintendent of Financial Institutions Canada. The Bank of Nova Scotia is authorized by the UK Prudential Regulation Authority and is subject to regulation by the UK Financial Conduct Authority and limited regulation by the UK Prudential Regulation Authority. Details about the extent of The Bank of Nova Scotia's regulation by the UK Prudential Regulation Authority are available from us on request. Scotiabank Europe plc is authorized by the UK Prudential Regulation Authority and regulated by the UK Financial Conduct Authority and the UK Prudential Regulation Authority.
Scotiabank Inverlat, S.A., Scotia Inverlat Casa de Bolsa, S.A. de C.V, Grupo Financiero Scotiabank Inverlat, and Scotia Inverlat Derivados, S.A. de C.V., are each authorized and regulated by the Mexican financial authorities.
Not all products and services are offered in all jurisdictions. Services described are available in jurisdictions where permitted by law.