- A massive job gain is driving Canada beyond maximum inclusive employment
- Records are being broken or challenged across multiple measures
- Stale? Commodities versus uncertainty
- The BoC has a deep credibility problem…
- ...and needs to accelerate its exits
- ...perhaps starting with a shock hike in April and full balance sheet run-off
CDN jobs / UR, 000s / %, SA, February
Actual: 337k / 5.5
Scotia: 100 / 6.5
Consensus: 128 / 6.2
Prior: -200 / 6.5
A jobs bonanza merits an expedited pace of policy exits by the Bank of Canada that is falling further and further behind the inflation fight. Pending next week’s inflation figures, the case for a 50bps move (75 anyone?) on April 13th is going up and at the same time that we expect the BoC to end reinvestment of maturing GoC bonds. The whole front-end of the Canadian rates complex is significantly underpricing a tightening cycle.
Please see the summary table of highlights.

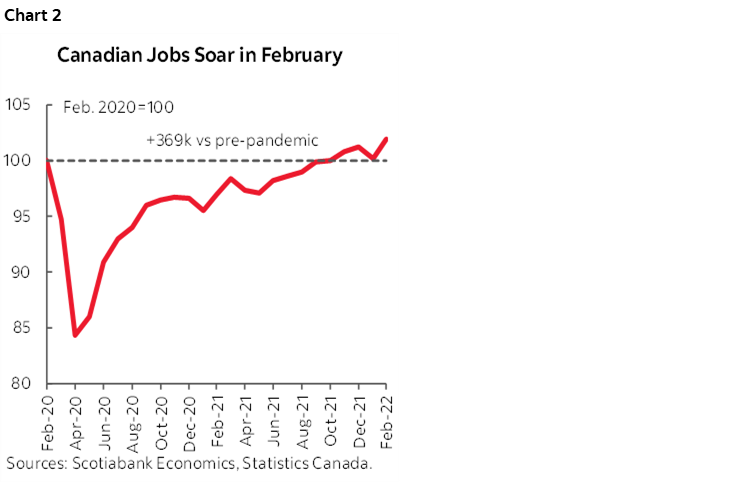
Canada not only recovered the 200k jobs lost in January but also added another 137k to put an exclamation point on the release. That indicates that the rebound was about more than just easing omicron restrictions. There is an antsy population of folks and businesses chomping at the bit to get back to a sense of normalcy out there.
Canada is now 369k above pre-pandemic employment levels (chart 2). Who is can boast such a claim? Well, Australia can. The US can’t. Nor can the UK to name a few.
Most details held up rather well. Like the US, this time wages did not perform well which I’ll come back to, but I’ll also offer cautions against over-reacting to that part of the release.
Almost all of the job gain came through private sector payrolls that were up by 347k. Public sector payroll jobs were little changed (+8k). Self-employed positions fell by ~19k.
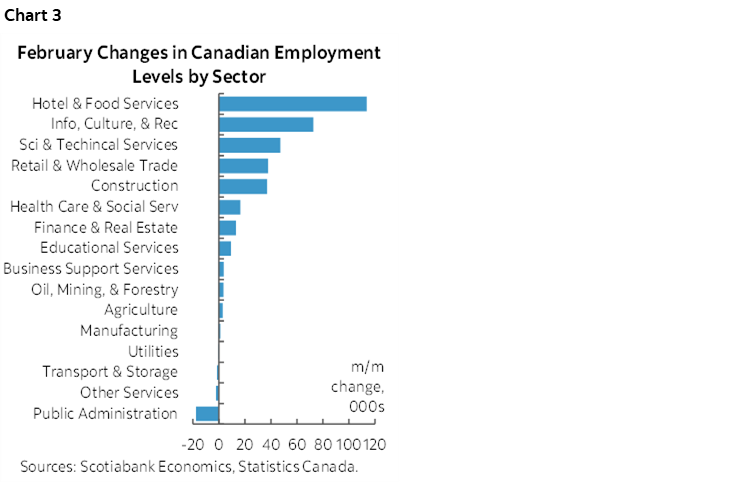
Chart 3 shows the breakdown of job growth by sector. Services employment was up by 293k with goods sector jobs up 44k and led by construction jobs (+37k). Within services, the gains were marked by considerable breadth. Accommodation and food services led the way at +114k, followed by info/culture/rec jobs that were up by 73k, followed by prof/scientific/technical (lawyers, scientists, docs etc) employment that was up 47k and with wholesale/retail up 38k and the FIRE sector that was up 13k.
A minor dent is that part-time jobs led with a gain of 215k, but full-time jobs were still up by an impressive 122k.
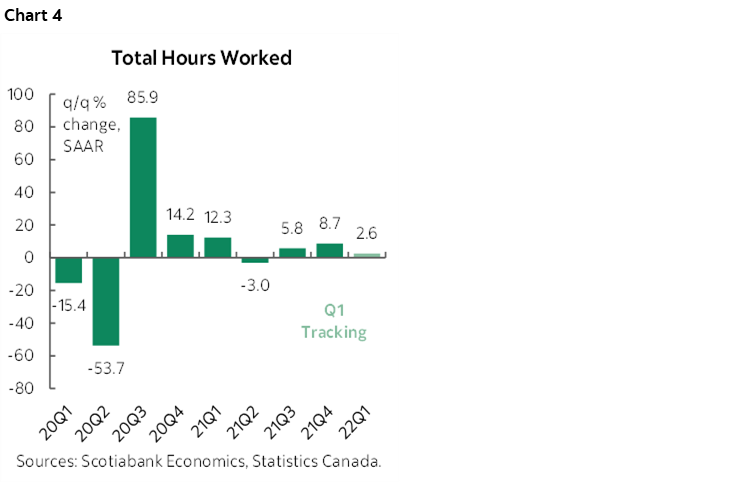
Hours worked were up by a whopping 3.6% m/m in February. That was enough to push hours worked up 2.6% q/q in seasonally adjusted terms at an annualized rate (SAAR). See chart 4. That’s incredibly strong for February GDP tracking purposes and solid for Q1 GDP tracking purposes notwithstanding the fact it is slower than the unsustainable 8.7% rise in Q4/Q3.
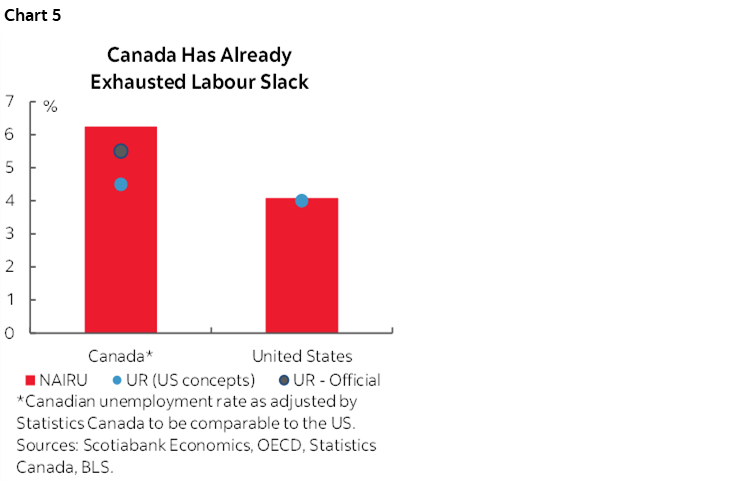
The unemployment rate fell by a full percentage point to just 5.5%. Adjusted to US measurement concepts, Canada's UR is now 4.5% (versus 3.8% in the US).
That puts Canada’s official unemployment rate and the unofficial measure adjusted to US measurement concepts below the OECD’s estimate of Canada’s non-inflationary unemployment rate as shown in chart 5. The US unemployment rate sits on such an estimate. The NAIRU estimates are marked by high uncertainty, but the more Canada pushes below them, the likelier it is that the job market is becoming tighter and tighter relative to Canadian norms for structural rates of unemployment in absolute terms and relative to the US.
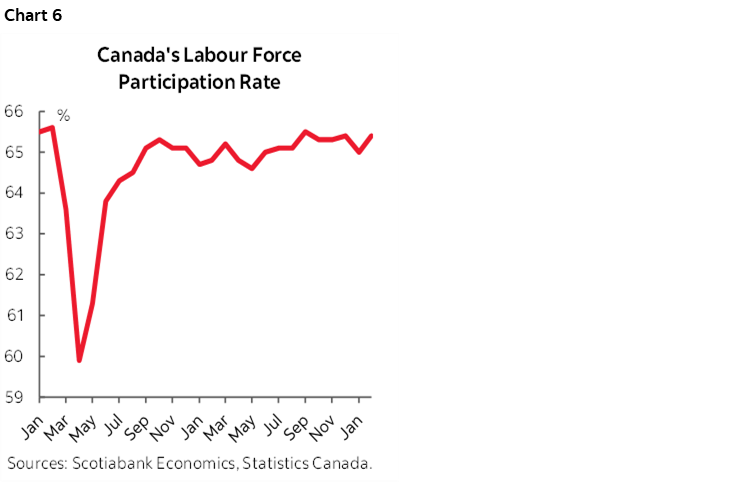
The participation rate is just 0.2 ppts below the pre-pandemic level (chart 6). The Official unemployment rate is just 0.1 ppts above the all-time low that was set in May 2019.
The main source of ongoing weakness lies in self-employment that is still down 246k since the pandemic. Some of that is perhaps explainable in that a tightening labour market on the upswing may be more likely to lure more self-employed workers back to payroll positions but with some viewing that as anathema to them. Lots of self-employed jobs are wonderful contributors to the economy, but the cycle’s influence can’t be ignored.
Compared to the start of the pandemic, full-time jobs are up by 283k and part-time jobs are up 86k.
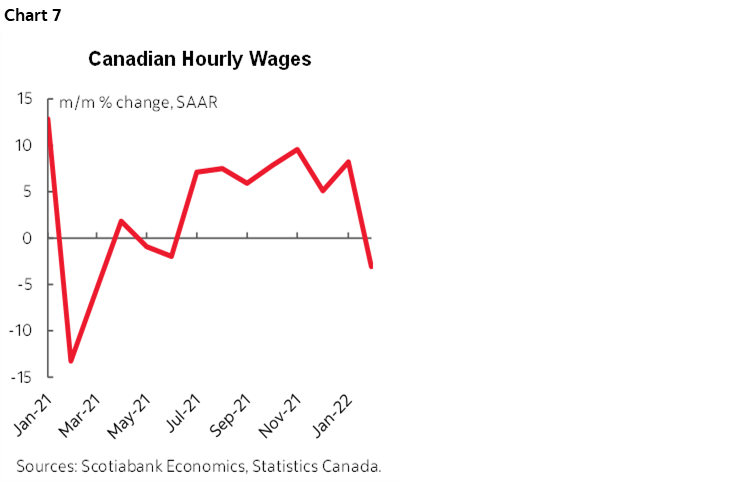
Wage growth stalled. The reason the wage growth figure for permanent employees expressed in year-over-year terms picked up to 3.3% y/y (from 2.7% prior) had to do with year-ago base effects and prior month-over-month gains. The month-over-month growth in average wages of permanent employees during February, however, fell by -3.1% SAAR. That's a sizable dent in my view and it doesn’t appear to be a compositional issue. Remember that wages are reported for all working people. At the margin the composition of the incremental change in pt/ft jobs in one month wouldn't go far in explaining such a dip in overall wages. The breakdown of wages also supports the view that it wasn’t just weak due to more of a weight on poorer paid part-timers as wages were flat m/m for full-time workers and down 0.2% m/m for part-time.
How big of a deal should we make this drip in wages in February? Park it in the back of your mind for now while bearing in mind the following points:
- It’s just one month of soft wages against a strong trend in month-over-month gains (chart 7).
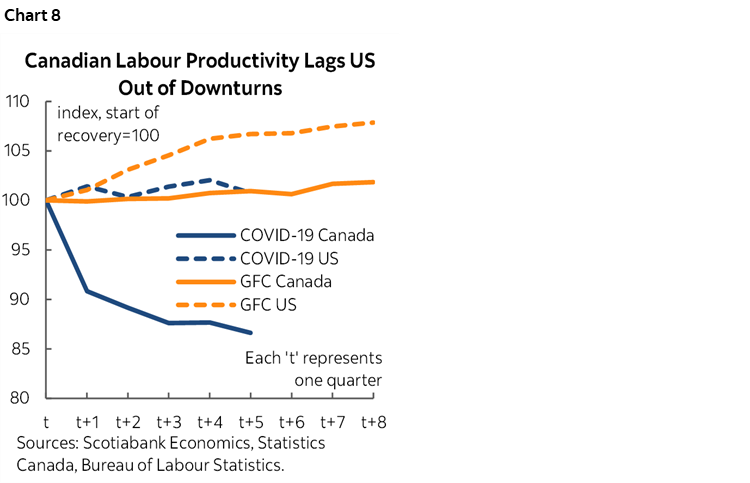
- When looking at the wage figures, also bear in mind that labour productivity is sucking Don River water these days. It’s the cost to Canada’s explosive jobs rebound. See chart 8. So while I didn't like to see stalled wage growth, the fact that jobs got heaped on probably means that the productivity problems are continuing into 2022. Falling absolute levels of productivity are inflationary and there is a variety of highly uncertain drivers across public policy influences and private sector causes.
- Still, Statscan made an interesting observation in that compared to the US, the Canadian job-changing rate in aggregate isn't really breaking out. It was 0.7% in February, down a tick from the prior month and in line with the pre-pandemic experiences. This metric measures the share of workers who changed jobs between months. I suspect that some industries are probably experiencing higher rates than others… That could be an important signal in that the wage search process in aggregate in Canada is perhaps not as supportive of wage pressures as it appears to be in the US so far.
Provincially the gain was led by Ontario +194k with Toronto up 116k. Quebec was up 82k with Montreal up 37k. That all makes sense since that's where the effects of restrictions were greatest.
Chart 9 shows the breakdown of the cumulative jobs recovery to date. Some sectors are well above pre-pandemic employment levels. Some remain well below and may struggle to get workers going forward.

STALE VERSUS THE WAR-LIFT TO COMMODITIES
Some will say the report is stale. It’s a pre-war assessment and we face higher uncertainty now. That’s fair to a degree. But while I wouldn't say that the Ukraine war is good for Canada per se, in a perverse sort of way and within reasonable bounds it kind of is. The commodities lift to the terms of trade of a commodities producer is a strong growth impulse that is offsetting heightened uncertainty. The starting point is that there is no capacity left and Canada is shifting into excess demand when inflation is already soaring and taking measures of expectations up with it.
The BoC's job is inflation, it has been utterly failing to date, and already had some significant catch-up to do even before soaring commodities. With higher oil prices threatening to add on the order of ~2 percentage points to inflation going forward, we’re venturing into uncharted waters for Canadian inflation risk during the inflation-targeting era. Multiple measures of inflation expectations are above the BoC’s target including survey-based evidence and market-based expectations. Folks are spending less time debating what’s driving inflation in terms of supply-side, demand-side, commodity or idiosyncratic factors and more time engaging in extrapolative behaviour. Adaptive expectations are taking over as the BoC has been far too slow to respond. The next thing to watch for in this regard will be the April 4th editions of the BoC’s twin business and consumer surveys where the emphasis will be upon the measures of inflation expectations given that the survey-period is likely to have run from about mid-February to early March.
DISCLAIMER
This report has been prepared by Scotiabank Economics as a resource for the clients of Scotiabank. Opinions, estimates and projections contained herein are our own as of the date hereof and are subject to change without notice. The information and opinions contained herein have been compiled or arrived at from sources believed reliable but no representation or warranty, express or implied, is made as to their accuracy or completeness. Neither Scotiabank nor any of its officers, directors, partners, employees or affiliates accepts any liability whatsoever for any direct or consequential loss arising from any use of this report or its contents.
These reports are provided to you for informational purposes only. This report is not, and is not constructed as, an offer to sell or solicitation of any offer to buy any financial instrument, nor shall this report be construed as an opinion as to whether you should enter into any swap or trading strategy involving a swap or any other transaction. The information contained in this report is not intended to be, and does not constitute, a recommendation of a swap or trading strategy involving a swap within the meaning of U.S. Commodity Futures Trading Commission Regulation 23.434 and Appendix A thereto. This material is not intended to be individually tailored to your needs or characteristics and should not be viewed as a “call to action” or suggestion that you enter into a swap or trading strategy involving a swap or any other transaction. Scotiabank may engage in transactions in a manner inconsistent with the views discussed this report and may have positions, or be in the process of acquiring or disposing of positions, referred to in this report.
Scotiabank, its affiliates and any of their respective officers, directors and employees may from time to time take positions in currencies, act as managers, co-managers or underwriters of a public offering or act as principals or agents, deal in, own or act as market makers or advisors, brokers or commercial and/or investment bankers in relation to securities or related derivatives. As a result of these actions, Scotiabank may receive remuneration. All Scotiabank products and services are subject to the terms of applicable agreements and local regulations. Officers, directors and employees of Scotiabank and its affiliates may serve as directors of corporations.
Any securities discussed in this report may not be suitable for all investors. Scotiabank recommends that investors independently evaluate any issuer and security discussed in this report, and consult with any advisors they deem necessary prior to making any investment.
This report and all information, opinions and conclusions contained in it are protected by copyright. This information may not be reproduced without the prior express written consent of Scotiabank.
™ Trademark of The Bank of Nova Scotia. Used under license, where applicable.
Scotiabank, together with “Global Banking and Markets”, is a marketing name for the global corporate and investment banking and capital markets businesses of The Bank of Nova Scotia and certain of its affiliates in the countries where they operate, including; Scotiabank Europe plc; Scotiabank (Ireland) Designated Activity Company; Scotiabank Inverlat S.A., Institución de Banca Múltiple, Grupo Financiero Scotiabank Inverlat, Scotia Inverlat Casa de Bolsa, S.A. de C.V., Grupo Financiero Scotiabank Inverlat, Scotia Inverlat Derivados S.A. de C.V. – all members of the Scotiabank group and authorized users of the Scotiabank mark. The Bank of Nova Scotia is incorporated in Canada with limited liability and is authorised and regulated by the Office of the Superintendent of Financial Institutions Canada. The Bank of Nova Scotia is authorized by the UK Prudential Regulation Authority and is subject to regulation by the UK Financial Conduct Authority and limited regulation by the UK Prudential Regulation Authority. Details about the extent of The Bank of Nova Scotia's regulation by the UK Prudential Regulation Authority are available from us on request. Scotiabank Europe plc is authorized by the UK Prudential Regulation Authority and regulated by the UK Financial Conduct Authority and the UK Prudential Regulation Authority.
Scotiabank Inverlat, S.A., Scotia Inverlat Casa de Bolsa, S.A. de C.V, Grupo Financiero Scotiabank Inverlat, and Scotia Inverlat Derivados, S.A. de C.V., are each authorized and regulated by the Mexican financial authorities.
Not all products and services are offered in all jurisdictions. Services described are available in jurisdictions where permitted by law.