PROVINCIAL BUDGET 2022 ROUNDUP
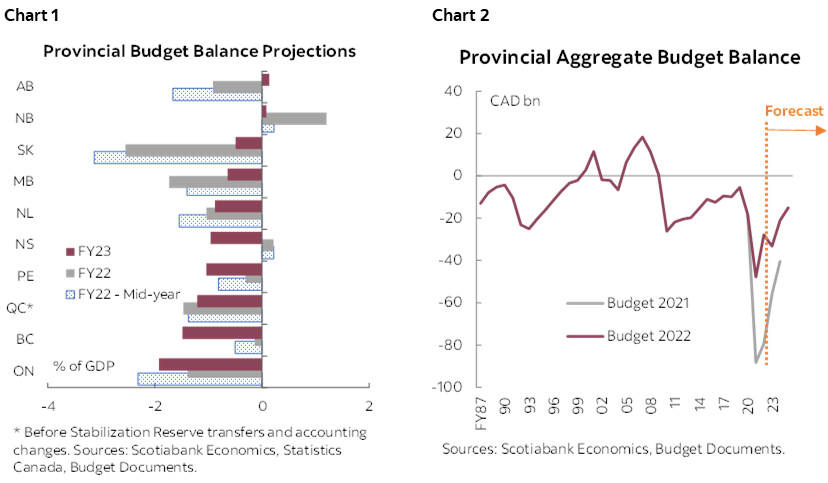
- Provinces continued to see improved fiscal positions owing to strong nominal growth and surging commodity prices. Deficit projections add up to a total of -$33.2 bn in FY23 and -$21 bn in FY24—respective reductions of $22.7 bn (0.9% of nominal GDP) and $19.4 bn (0.7% of GDP) versus last budget.
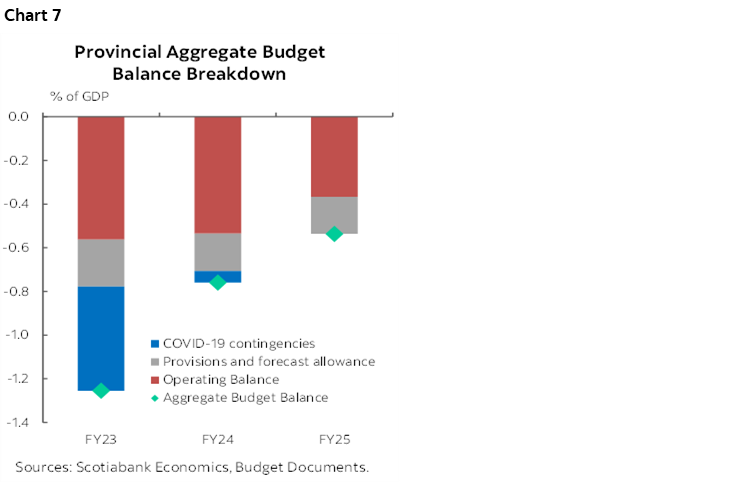
- Aggregate deficits are expected to remain elevated this fiscal year, before trending down slowly in the medium-term future. Provinces project a total deficit of -1.3% of GDP in FY23, slightly wider than FY22’s -1.2% shortfall, which is expected to decline gradually to -0.5% of GDP in FY25.
- Provinces continue to bank most of the revenue windfalls despite easing some of the spending restraints in the near term.
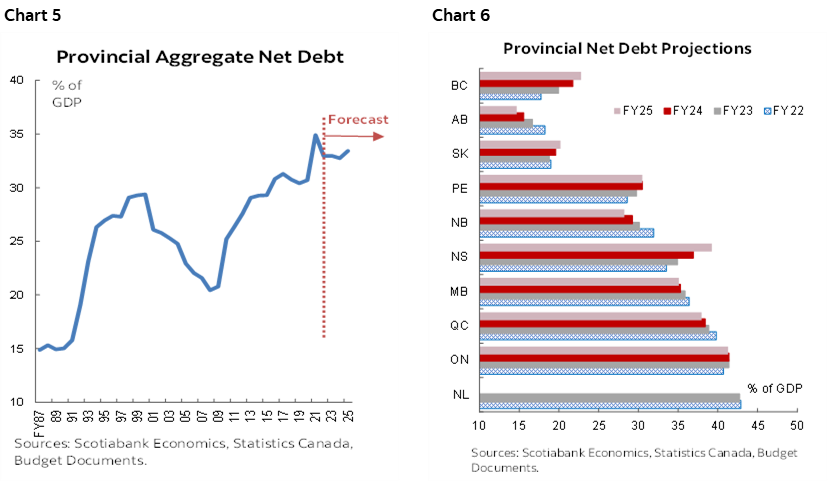
- Provinces’ combined debt burden is expected to stabilize but remain elevated by FY25 at close to 33% as a share of GDP.
- About $18 bn has been set aside as contingencies and provisions in FY23, followed by another $6.2 bn in FY24 and $4.8 bn in FY25, providing sizable buffer for future spending needs.
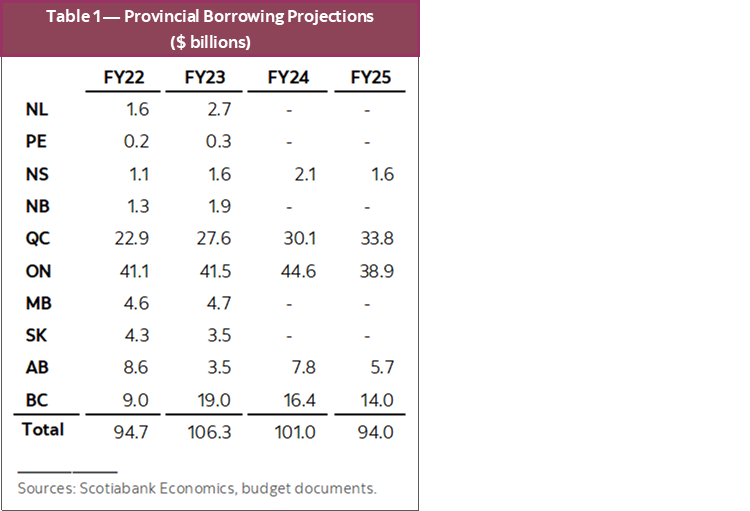
- Provinces’ borrowing requirements are also expected to total $106 bn in FY23, up from $95 bn in FY22.
- Provinces showed relative spending discipline against improved fiscal outlooks. Overall, they foresee gradual improvement in budget balances following the prudent fiscal paths outlined in Budget 2022, while mounting economic headwinds could pose further challenges to provinces’ consolidation effort.
FISCAL OUTLOOK IMPROVED FROM COAST TO COAST
Provinces’ fiscal outlook saw successive improvements since a year ago (chart 1). Collectively, the provinces reduced their FY22 deficit estimates by a total of $12.2 bn after slashing it by half in the mid-year updates last fall. FY23 deficit forecast also saw a 41% reduction versus the last budget, bringing the aggregate deficit to -1.25% of nominal GDP instead of -2.3% anticipated in the last budget. Outer-year budget balance projections have also improved, bringing the provinces closer to balance by FY25 (chart 2).
All provinces anticipate revenue windfalls in light of a stronger-than-anticipated economic rebound, robust nominal growth and lofty commodity prices (chart 3). The oil producers saw the highest revenue windfalls in FY22. Other than BC, Saskatchewan and Nova Scotia—which expect total revenues to decline by 1–2% in FY23, most provinces expect revenue gains to continue into the ongoing fiscal year. Permanent tax relief measures introduced in Ontario, New Brunswick and Manitoba will erode some revenue growth, but only to a limited extent. In aggregate, provinces expect revenues to grow by 1.8% in FY23 after an estimated 12.3% increase in FY22.
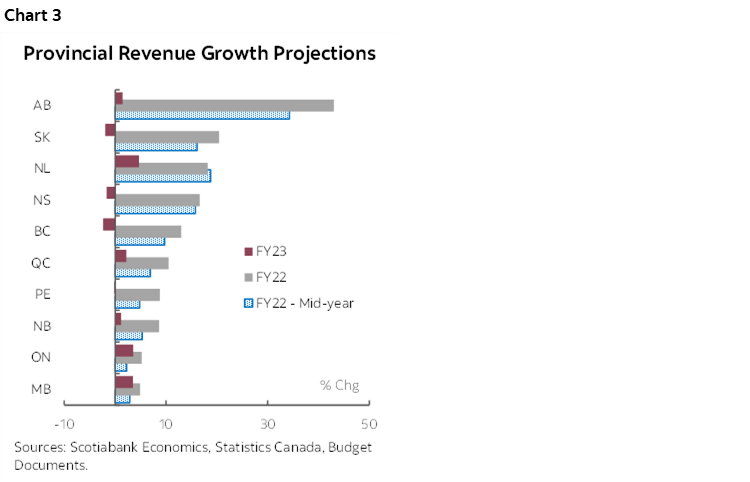
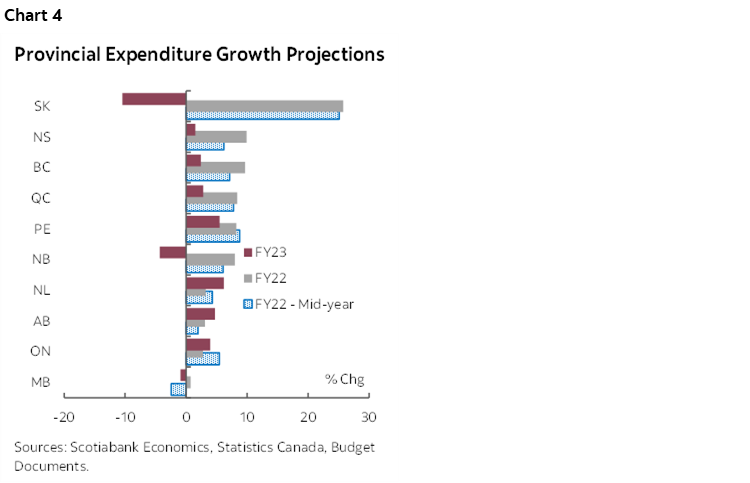
Provinces foresee different levels of spending pressures in the near term, which absorb some revenue gains (chart 4). With COVID-19 expenses coming in lower than expected, many provinces—namely Ontario, Manitoba, Nova Scotia and New Brunswick—plan to temporarily lift spending in areas facing acute pressures including cost of living assistance and health care and raise their spending profiles in the near-term. Boasting the most sizable revenue windfalls, Alberta also eased expenditure restraint planned initially and raised program spending by $8 bn over FY22–24 (0.7% of GDP). Saskatchewan expects to largely improve its fiscal position in FY23 once the impact of a one-time overshoot in crop insurance indemnities and emergency drought assistance subsides. Provinces’ lifted spending profiles still err on the side of caution, with additional expenditure predominantly capped by revenue growth.
FISCAL IMPROVEMENT MARGINALLY HELPS REDUCE PROVINCIAL DEBT BURDEN
Provincial aggregate debt burden is expected to pull back slowly from its peak in FY21 (chart 5). Aggregate net debt is expected to remain elevated, edging down incrementally to just below 32.7% as a share of GDP by FY24—still historically high. Provinces with high debt burden such as Quebec and Manitoba seem to be making an effort to improve, projecting steady reduction in debt as a share of output beyond FY22 (chart 6). Ontario—the province with the highest debt-to-GDP ratio in FY22—intend to keep the ratio flat through FY25 with some updated fiscal anchors. Nova Scotia and BC both foresee notable increases in debt burden as a share of GDP through FY25.
REVENUE OUTLOOK CONTINUES TO BE CONSERVATIVE
Half of the provinces set aside sizable contingencies and forecast allowances in the plan (chart 7). Contingencies and allowances tally up to over 50% of aggregate deficit in FY23, and around 30% in FY24 and FY25. The prudence provides provinces with fiscal flexibility in the face of domestic and global economic uncertainties related to aggressive monetary policy tightening, the war in Ukraine and a slowdown in China.
Conservative oil price assumptions leave room for further upside. Alberta’s WTI price projections were completed before the Russian invasion of Ukraine, averaging 70 USD/bbl in FY23 and 69 USD/bbl in FY24. Saskatchewan assumes higher WTI prices averaging 79 USD/bbl in 2022 and dropping to 73 USD/bbl in 2023. These assumptions are well below the year-to-date average WTI price of 98 USD/bbl as of May 16, 2022. Per provinces’ own sensitivity estimates, a 20 USD/bbl difference suggests at least $10 bn in bottom-line improvements for these two provinces. Potential gains for Newfoundland and Labrador are likely limited by continued production decline in the province.
BULK OF POLICY MEASURES TARGET HEALTH CARE AND AFFORDABILITY
Fiscal policies are shifting away from pandemic support and gradually moving to bridging the gaps in the health care system, facilitating a green transition, improving affordability and other priorities. Health care spending got a sizable boost across the board, mainly targeting health system capacity expansions. Ontario, Quebec and Alberta all focus on staff retention and hospital capacity. BC and New Brunswick intend to improve their respective medical system efficiency by focusing on urgent and primary care, and both increase health care spending by over 5% in FY23. Manitoba and Saskatchewan focus on targeting diagnostic and surgical backlogs. Some jurisdictions also allocated extra capital investments for hospital capacity expansion, notably BC and Nova Scotia.
Overall, most cost-of-living assistance measures are broad-based and should have limited fiscal impact. Among the eight provinces that introduced relief measures, Quebec’s signature one-time assistance payment is the broadest-based, and Ontario’s license plate renewal fee exemption has a more lasting negative fiscal impact due to its permanence. Other broad-based policies—represented by Alberta’s electricity bill rebate—are smaller in scale and less likely to spur further inflation pressure. New Brunswick, Ontario and Manitoba are among those that carried out targeted tax cuts, offering some much-needed relief from the near-term inflation pressure. Against rising energy fuel prices, cost-of-living policy measures largely tilt towards benefiting the driving population, and consist of two main categories—temporary removal of gas and fuel taxes (Ontario and Alberta) and a relief of vehicle-related fees (Ontario, BC, Saskatchewan, Manitoba and Newfoundland and Labrador). Though stimulative, these affordability measures have a limited collective fiscal impact of roughly 0.3% of GDP, with Quebec’s $500 payment accounting for the highest share at around 0.6% of GDP—the bulk of the impact is set to subside beyond FY23 and limited targeting suggests low fiscal multipliers.
Efforts intending to improve housing affordability across the country mainly consist of property taxes and housing investments. Ontario increased its non-resident speculation tax to 20% and expanded its coverage across the province. Nova Scotia added a 2% non-resident provincial property tax but later reversed the decision. Given the structural imbalance of supply and demand, the impact of non-resident speculative tax is likely limited. More effective policies with a focus on increasing supply should be prioritized. BC sets an example by boosting the level of investments in housing programs to close to $1.3 bn per year by FY25. Following recommendations from the Housing Affordability Task Force, Ontario proposed a series of measures to accelerate building in partnership with municipalities—a well-informed step forward in the government’s long-term housing strategy.
LONGER TERM
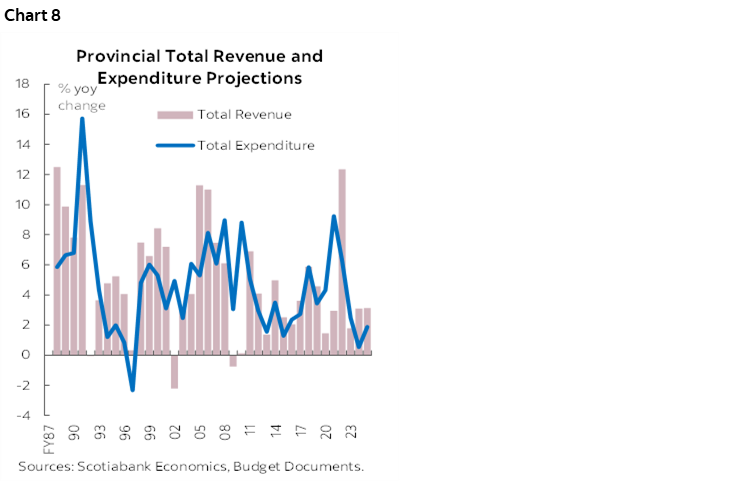
Outer-year deficits are set to narrow despite receding economic growth momentum. Provinces all expect nominal growth to slow down rapidly from a weighted average of 7.1% in FY23 to 1.7% in FY25. FY23 aggregate revenue forecast is 1.8% higher than in FY22, and is projected to grow at a healthy pace of around 3% thereafter. By keeping expenditure growth well below this rate, most provinces plan to bank on continued revenue gains and gradually reduce their shortfalls (chart 8). Under the current plan, aggregate provincial deficit is expected to decline gradually to around 0.5% of GDP in FY25.
Growth uncertainties and spending pressure could further cloud the optimistic outlook. More revenue headwinds linked to high inflation, geopolitical tension, a slowdown in China, and other economic risks could dampen growth. With Canada leading population growth among the G7 countries, this could add to pressure on the tight baseline expenditure projections. Additional spending promises could also ramp up in the upcoming general elections in Ontario and Quebec, though signs of a spending boost appear relatively measured in Ontario’s party platforms released so far.
Provinces collectively showing relative restraint against improved fiscal outlooks should be a positive signal for markets. All provinces except for Nova Scotia and Manitoba project paths back to balance, though mostly over extended time frames and some underpinned by variable assumptions, suggesting there is little appetite across-the-board for aggressive consolidation at this point. Overall, budget balance forecasts are heading in the right direction from a better starting point, and with sizable prudence still built into the outlook.
BORROWING REQUIREMENTS TO REMAIN ELEVATED
Provinces plan to borrow more in the upcoming years as most of them stepped up capital spending (table 1). FY23 borrowing requirements are expected to come in at a total of $106 bn, up from $95 bn in FY22. The four largest provinces expect to increase their aggregate borrowing requirements by another $7 bn in FY24. The actual borrowings in these years could eventually be lower considering the amount of contingencies and provision built into the budgets.
GLOBAL RISK SENTIMENTS DRIVE PROVINCIAL SPREADS
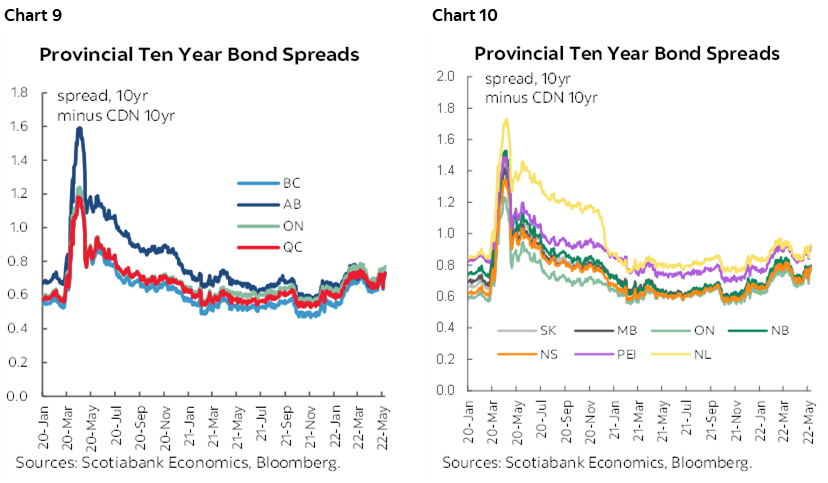
In the current environment, we expect provincial bond market movements will largely be driven by global risk factors. For example, provincial 10-year spreads are on a widening trajectory since mid-April in light of a series of risk-off events (chart 9 & 10). Commodity price outlook has kept the widening of provincial bond spreads more contained in oil-producing provinces relative to Ontario’s spreads. Over the longer run, improvements in provinces’ aggregate fiscal trajectory and anticipated lower supply should put downward pressure on provincial spreads.
DISCLAIMER
This report has been prepared by Scotiabank Economics as a resource for the clients of Scotiabank. Opinions, estimates and projections contained herein are our own as of the date hereof and are subject to change without notice. The information and opinions contained herein have been compiled or arrived at from sources believed reliable but no representation or warranty, express or implied, is made as to their accuracy or completeness. Neither Scotiabank nor any of its officers, directors, partners, employees or affiliates accepts any liability whatsoever for any direct or consequential loss arising from any use of this report or its contents.
These reports are provided to you for informational purposes only. This report is not, and is not constructed as, an offer to sell or solicitation of any offer to buy any financial instrument, nor shall this report be construed as an opinion as to whether you should enter into any swap or trading strategy involving a swap or any other transaction. The information contained in this report is not intended to be, and does not constitute, a recommendation of a swap or trading strategy involving a swap within the meaning of U.S. Commodity Futures Trading Commission Regulation 23.434 and Appendix A thereto. This material is not intended to be individually tailored to your needs or characteristics and should not be viewed as a “call to action” or suggestion that you enter into a swap or trading strategy involving a swap or any other transaction. Scotiabank may engage in transactions in a manner inconsistent with the views discussed this report and may have positions, or be in the process of acquiring or disposing of positions, referred to in this report.
Scotiabank, its affiliates and any of their respective officers, directors and employees may from time to time take positions in currencies, act as managers, co-managers or underwriters of a public offering or act as principals or agents, deal in, own or act as market makers or advisors, brokers or commercial and/or investment bankers in relation to securities or related derivatives. As a result of these actions, Scotiabank may receive remuneration. All Scotiabank products and services are subject to the terms of applicable agreements and local regulations. Officers, directors and employees of Scotiabank and its affiliates may serve as directors of corporations.
Any securities discussed in this report may not be suitable for all investors. Scotiabank recommends that investors independently evaluate any issuer and security discussed in this report, and consult with any advisors they deem necessary prior to making any investment.
This report and all information, opinions and conclusions contained in it are protected by copyright. This information may not be reproduced without the prior express written consent of Scotiabank.
™ Trademark of The Bank of Nova Scotia. Used under license, where applicable.
Scotiabank, together with “Global Banking and Markets”, is a marketing name for the global corporate and investment banking and capital markets businesses of The Bank of Nova Scotia and certain of its affiliates in the countries where they operate, including; Scotiabank Europe plc; Scotiabank (Ireland) Designated Activity Company; Scotiabank Inverlat S.A., Institución de Banca Múltiple, Grupo Financiero Scotiabank Inverlat, Scotia Inverlat Casa de Bolsa, S.A. de C.V., Grupo Financiero Scotiabank Inverlat, Scotia Inverlat Derivados S.A. de C.V. – all members of the Scotiabank group and authorized users of the Scotiabank mark. The Bank of Nova Scotia is incorporated in Canada with limited liability and is authorised and regulated by the Office of the Superintendent of Financial Institutions Canada. The Bank of Nova Scotia is authorized by the UK Prudential Regulation Authority and is subject to regulation by the UK Financial Conduct Authority and limited regulation by the UK Prudential Regulation Authority. Details about the extent of The Bank of Nova Scotia's regulation by the UK Prudential Regulation Authority are available from us on request. Scotiabank Europe plc is authorized by the UK Prudential Regulation Authority and regulated by the UK Financial Conduct Authority and the UK Prudential Regulation Authority.
Scotiabank Inverlat, S.A., Scotia Inverlat Casa de Bolsa, S.A. de C.V, Grupo Financiero Scotiabank Inverlat, and Scotia Inverlat Derivados, S.A. de C.V., are each authorized and regulated by the Mexican financial authorities.
Not all products and services are offered in all jurisdictions. Services described are available in jurisdictions where permitted by law.