Central banks & macro data: Holds expected from Banxico and the BanRep; macro data on the ongoing recovery
Mexico: Industrial production continued recovery in October
Peru: October trade figures came in strong; November fiscal accounts broadly in line with expectations
CENTRAL BANKS & MACRO DATA: HOLDS EXPECTED FROM BANXICO AND BANREP; MACRO DATA ON THE ONGOING RECOVERY
I. Final holds of 2020 expected from Banxico and the BanRep
The final monetary-policy decisions of 2020 are due this week from Mexico’s Banxico (Dec. 17) and Colombia’s BanRep (Dec. 18), with minutes from Brazil’s BCB (Dec. 15), followed by its quarterly Inflation Report (Dec. 17). For more details, see our December 13 edition of the Latam Weekly..
- Brazil. The BCB is scheduled on Tuesday, December 15, to publish the minutes from its Copom meeting on Wednesday, December 9, where the Committee voted unanimously to keep the Selic rate unchanged at 2.00% for a fourth time in a row (chart 1) amidst rising annual inflation readings (chart 2). The BCB’s December Inflation Report is due to follow on Thursday, December 17, and deliver revised macroeconomic forecasts.
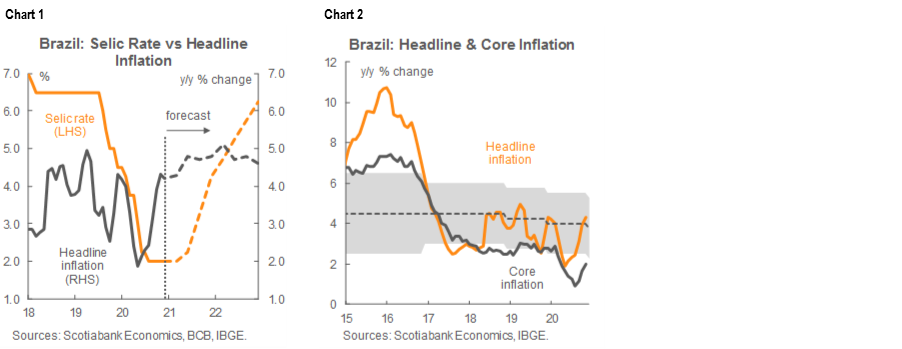
- Mexico. The last scheduled monetary-policy meeting of Banxico’s Board is planned for Thursday, December 17, where our team in CDMX expects the central bank to keep its benchmark policy rate on hold at 4.25% (chart 3) in view of our projection that inflation will remain in the upper half of the target range over the forecast horizon (chart 4). The minutes of the meeting are scheduled for publication on Thursday, January 7.
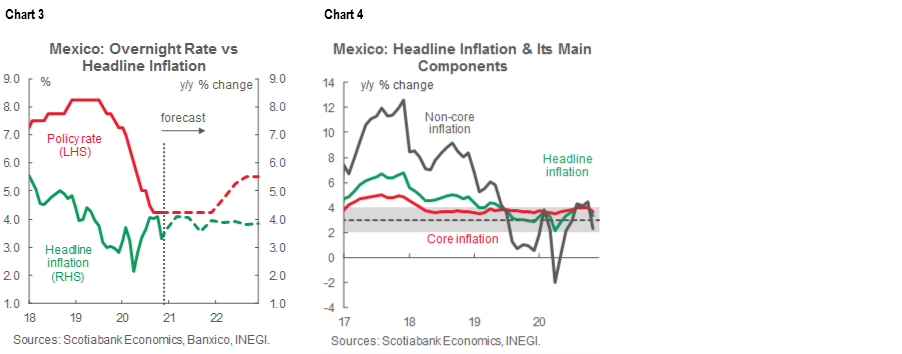
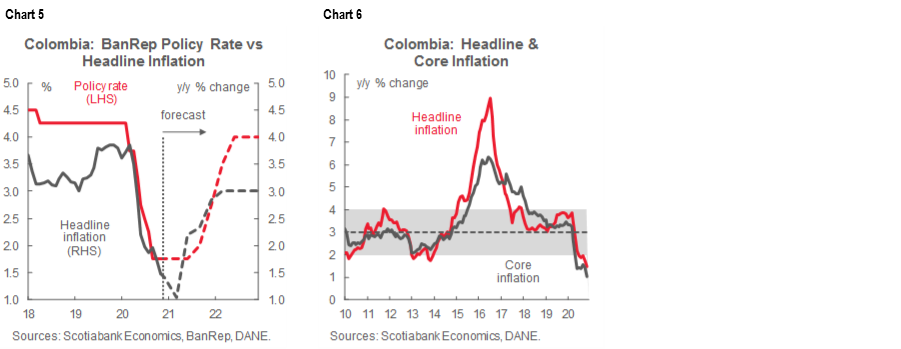
- Colombia. In the last major Latam central-bank risk event for 2020, the BanRep Board will meet on Friday, December 18, and our economists in Bogota expect the headline policy rate to be held at 1.75% (chart 5) at the end of a relatively quiet discussion focused on administrative issues. Below-target inflation (chart 6) is expected to be transitory. The minutes from the Friday, December 18, meeting are due to be published on Monday, December 21, under the BanRep’s usual calendar.
II. Macro data on the ongoing recovery
- Argentina. November inflation (due for release Dec. 15) is expected to stay above 3% m/m sa, but level effects imply that annual inflation would still come down from 37.2% y/y in October to 36.5% y/y. The Q3 GDP print (Dec. 16) is stale since the monthly GDP proxy anticipates it closely.
- Brazil. The October GDP proxy (Dec. 14) came in weaker than expected at 0.86% m/m sa, versus a consensus of 1.05% m/m sa, despite support from robust fiscal stimulus. This pulled the annual comparison down from -0.77% y/y in September to -2.61%y/y.
- Chile. No tier-1 data are due for release this week.
- Colombia. October manufacturing, industrial production, and retail sales data (Dec. 14) together continued to show improvements under the “new normal” re-opening scheme. October trade data (Dec. 18) are likely to show increased international demand for Colombia’s key exports combined with renewed domestic demand for imports.
- Mexico. Q3 aggregate supply and demand data (Dec. 18) should be aligned with the already-released Q3 GDP data.
- Peru. The October monthly GDP proxy (Dec. 15) is expected to lift annual growth from -7.0% y/y in September to around
-5.5% to -5.0% y/y.
Do see the December 13 Latam Weekly for our full risk calendar and detailed forecasts.
—Brett House
MEXICO: INDUSTRIAL PRODUCTION CONTINUED RECOVERY IN OCTOBER
On Friday, December 11, INEGI released data for October industrial production (IP) that showed a fifth straight month of sequential gains with monthly growth of 1.95% m/m sa, up from 0.61% m/m sa in September (revised from 0.0% m/m sa) and significantly better than the 0.6% m/m sa expected in the Bloomberg consensus. This narrowed IP’s annual contraction further from the -30.43% y/y nadir in May. In October, IP was down -3.30% y/y in annual terms (chart 7), better than the -6.10% y/y recorded in September and above the -5.5% y/y in the consensus.
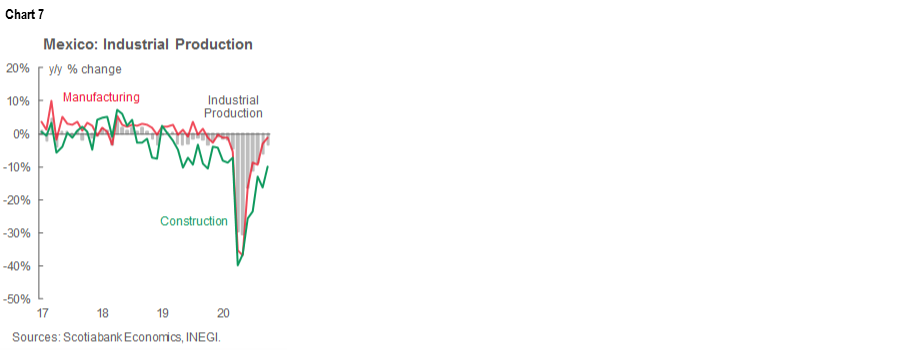
According to INEGI’s press release, the monthly increase was the result of a strong rise in construction activity and the generation, transmission and distribution of electricity, water and gas.
- The construction industry grew by 3.6% m/m sa in October, driven by a 6% m/m sa increase in the building segment; at the same time, public works grew by 1.0% m/m sa and specialized construction was flat on the month. This brought annual growth in construction up from -16.2% y/y in September to -8.8% y/y (chart 7, again).
- Utilities showed an increase of 1.8% m/m sa, lifting them in annual terms from -6.7% y/y in September to -4.2% y/y.
- Manufacturing industries advanced 1.8% m/m sa in October, a fifth straight month of sequential increases. This put manufacturing down only -1.3% y/y in annual terms, better than the -3.1% y/y notched up in September, but still a 13th straight month in which manufacturing has been off from a year prior.
- Mining grew 1% m/m sa in October, up from the 0.3% m/m growth we saw in September. This narrowed mining’s annual contraction from -2.5% y/y in September to -1.1% y/y in October.
—Paulina Villanueva
PERU: OCTOBER TRADE FIGURES CAME IN STRONG; NOVEMBER FISCAL ACCOUNTS BROADLY IN LINE WITH EXPECTATIONS
The BCRP published trade, terms of trade, and fiscal balance figures for October on Thursday, December 10.
I. October trade figures came in strong
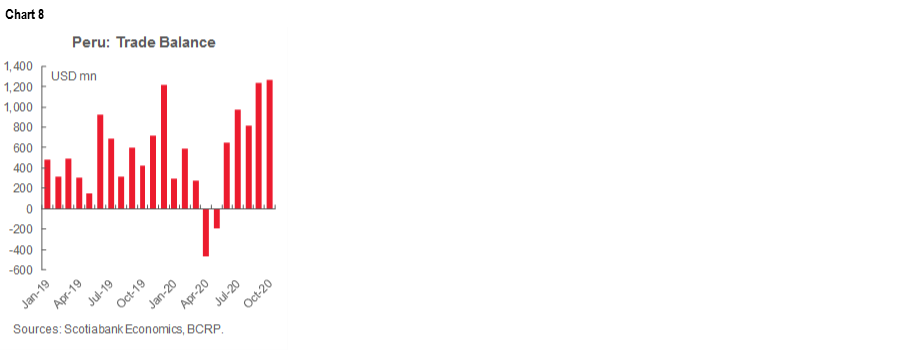
Peru registered a USD 1.26 bn trade surplus in October (chart 8). This was the largest one-month surplus since December 2011 and was more than double our expectations for the month. As a result, the cumulative January-to-October surplus rose to USD 5.4 bn, and hit our forecast for the full year of 2020. Commodity prices have been playing in Peru’s favour. Mining exports, up 13% y/y in October, led the 8.3% y/y increase in aggregate exports, although agro-industrial exports also gained. By the same token, the main component behind the -13% y/y decrease in imports was by far, fuel (oil), down nearly -61% y/y. In contrast, consumer goods imports were down only -2.1% y/y.
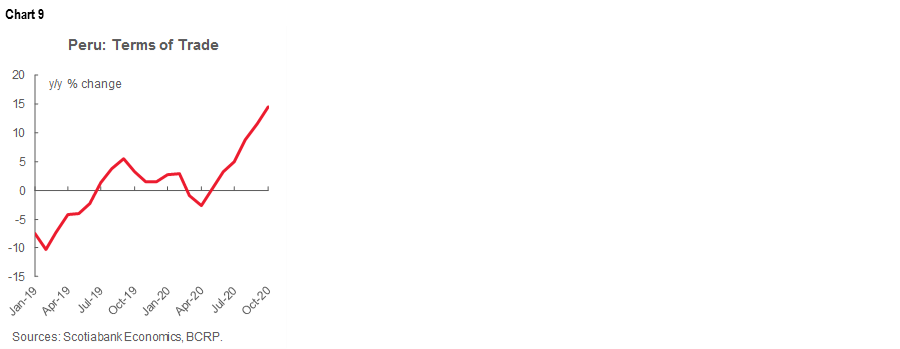
Terms of trade rose 14.4% y/y in October (chart 9). This was a very strong result that was driven by both a 10% y/y increase in metal export prices and a -3.7% y/y decline in import prices, mainly in oil and soft commodities. Terms of trade have improved far beyond expectations this year, and given metal price trends, should have continued strengthening in November and December. This is good news for Peru’s macro balances, both external and fiscal. The impact on the country’s external accounts is already being felt, and will require us to revise our balance-of-payments forecasts; similarly, the effects on Peru’s fiscal accounts will be seen in 2021 and 2022.
II. November fiscal accounts broadly in line with expectations
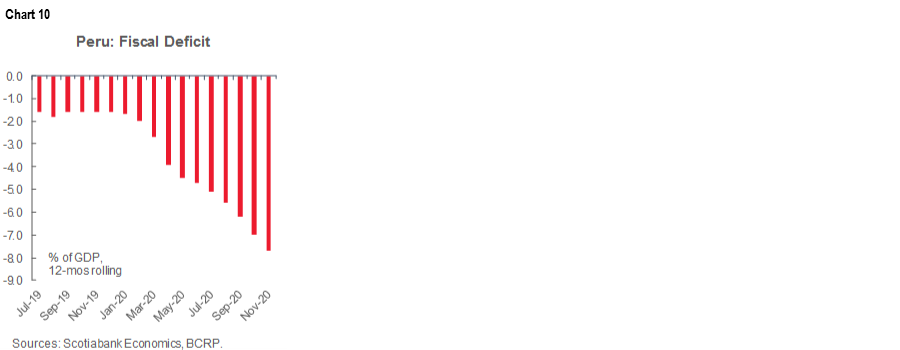
The 12-month rolling fiscal deficit widened to -7.7% of GDP in November, from -7.1% in October, according to data released at the end of last week by the Peruvian authorities (chart 10). With one month remaining in the year, this was broadly in line with our forecast of -8.6% of GDP for all of 2020 given that December normally sees fiscal spending soar to meet year-end deadlines. Even so, we are more likely to come in a little short of our deficit forecast, than long. Still, in general terms, fiscal accounts are playing out pretty much as we have been expecting. Government spending was up 10.3% y/y in the YTD to November, while revenue was down -17.9% y/y YTD. The trends are changing, however. While revenue fell only -9.8% y/y in November, spending rose 26% y/y and higher spending is now contributing more than declining revenue to the deficit. Both trends are a reflection of improving domestic demand.
—Guillermo Arbe
DISCLAIMER
This report has been prepared by Scotiabank Economics as a resource for the clients of Scotiabank. Opinions, estimates and projections contained herein are our own as of the date hereof and are subject to change without notice. The information and opinions contained herein have been compiled or arrived at from sources believed reliable but no representation or warranty, express or implied, is made as to their accuracy or completeness. Neither Scotiabank nor any of its officers, directors, partners, employees or affiliates accepts any liability whatsoever for any direct or consequential loss arising from any use of this report or its contents.
These reports are provided to you for informational purposes only. This report is not, and is not constructed as, an offer to sell or solicitation of any offer to buy any financial instrument, nor shall this report be construed as an opinion as to whether you should enter into any swap or trading strategy involving a swap or any other transaction. The information contained in this report is not intended to be, and does not constitute, a recommendation of a swap or trading strategy involving a swap within the meaning of U.S. Commodity Futures Trading Commission Regulation 23.434 and Appendix A thereto. This material is not intended to be individually tailored to your needs or characteristics and should not be viewed as a “call to action” or suggestion that you enter into a swap or trading strategy involving a swap or any other transaction. Scotiabank may engage in transactions in a manner inconsistent with the views discussed this report and may have positions, or be in the process of acquiring or disposing of positions, referred to in this report.
Scotiabank, its affiliates and any of their respective officers, directors and employees may from time to time take positions in currencies, act as managers, co-managers or underwriters of a public offering or act as principals or agents, deal in, own or act as market makers or advisors, brokers or commercial and/or investment bankers in relation to securities or related derivatives. As a result of these actions, Scotiabank may receive remuneration. All Scotiabank products and services are subject to the terms of applicable agreements and local regulations. Officers, directors and employees of Scotiabank and its affiliates may serve as directors of corporations.
Any securities discussed in this report may not be suitable for all investors. Scotiabank recommends that investors independently evaluate any issuer and security discussed in this report, and consult with any advisors they deem necessary prior to making any investment.
This report and all information, opinions and conclusions contained in it are protected by copyright. This information may not be reproduced without the prior express written consent of Scotiabank.
™ Trademark of The Bank of Nova Scotia. Used under license, where applicable.
Scotiabank, together with “Global Banking and Markets”, is a marketing name for the global corporate and investment banking and capital markets businesses of The Bank of Nova Scotia and certain of its affiliates in the countries where they operate, including; Scotiabank Europe plc; Scotiabank (Ireland) Designated Activity Company; Scotiabank Inverlat S.A., Institución de Banca Múltiple, Grupo Financiero Scotiabank Inverlat, Scotia Inverlat Casa de Bolsa, S.A. de C.V., Grupo Financiero Scotiabank Inverlat, Scotia Inverlat Derivados S.A. de C.V. – all members of the Scotiabank group and authorized users of the Scotiabank mark. The Bank of Nova Scotia is incorporated in Canada with limited liability and is authorised and regulated by the Office of the Superintendent of Financial Institutions Canada. The Bank of Nova Scotia is authorized by the UK Prudential Regulation Authority and is subject to regulation by the UK Financial Conduct Authority and limited regulation by the UK Prudential Regulation Authority. Details about the extent of The Bank of Nova Scotia's regulation by the UK Prudential Regulation Authority are available from us on request. Scotiabank Europe plc is authorized by the UK Prudential Regulation Authority and regulated by the UK Financial Conduct Authority and the UK Prudential Regulation Authority.
Scotiabank Inverlat, S.A., Scotia Inverlat Casa de Bolsa, S.A. de C.V, Grupo Financiero Scotiabank Inverlat, and Scotia Inverlat Derivados, S.A. de C.V., are each authorized and regulated by the Mexican financial authorities.
Not all products and services are offered in all jurisdictions. Services described are available in jurisdictions where permitted by law.