Argentina: The price-wage spiral continues
Colombia: October exports remained at four-year low; Q3 balance of payments reflected shift in external financing
Mexico: Strong remittance inflows continued in October; Banxico’s November survey pointed to a slightly smaller 2020 GDP contraction; October public finances imply some setbacks left to come
Peru: November inflation surprised to the upside; leading growth indicators for October were mixed, but mostly positive
ARGENTINA: THE PRICE-WAGE SPIRAL CONTINUES
Argentine wage growth continued to accelerate in September, notching up a fourth month in a row, up from 2.0% m/m in August to 2.5% m/m (chart 1). Public-sector wages led the gains at 3.2% m/m, which represented some catch-up from slower previous months. Private wages outside the registered system also led increases at 2.3% m/m, a bit of a slowdown from the torrid 3.7% m/m and 4.2% m/m paces set in August and July, respectively. Wages are tracking the recent acceleration in sequential price inflation and are set to go higher as Economy Minister Guzman has promised that public-sector salaries, pensions, and benefits will see real gains in 2021—which would inflame Argentina’s inflationary pressures further and deepen the challenges already bedevilling negotiations with the IMF on a new borrowing arrangement and adjustment program.

—Brett House
COLOMBIA: OCTOBER EXPORTS REMAINED AT FOUR-YEAR LOW; Q3 BALANCE OF PAYMENTS REFLECTED SHIFT IN EXTERNAL FINANCING
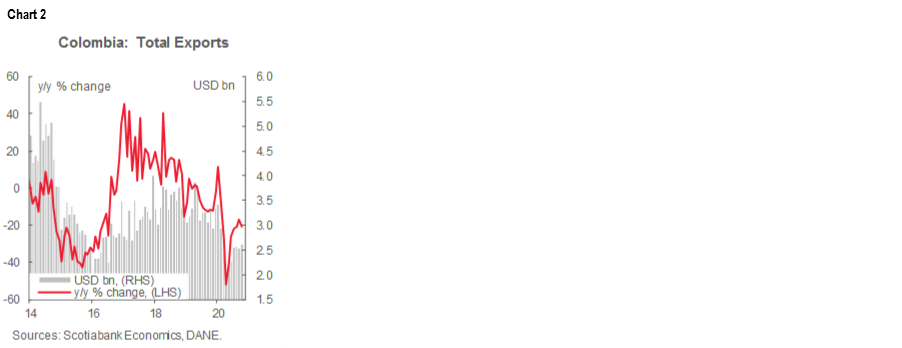
I. October exports were down by -21.0% y/y and remained close to the four year low
According to DANE’s release on Tuesday, December 1, October’s monthly exports amounted to USD 2.6 bn (-21.0% y/y, chart 2). October exports broadly remained at the same level as in the previous three months, which puts them around their lowest point in four years. The annual contraction was a bit greater than the -17.5% y/y we saw in September. Oil and mining exports remained the main source of the annual pullback since these exports were down -42.7% y/y, similar to September’s -42.4% y/y. Agricultural exports increased by 2.8% y/y, while manufacturing exports were still down by -5.4% y/y.
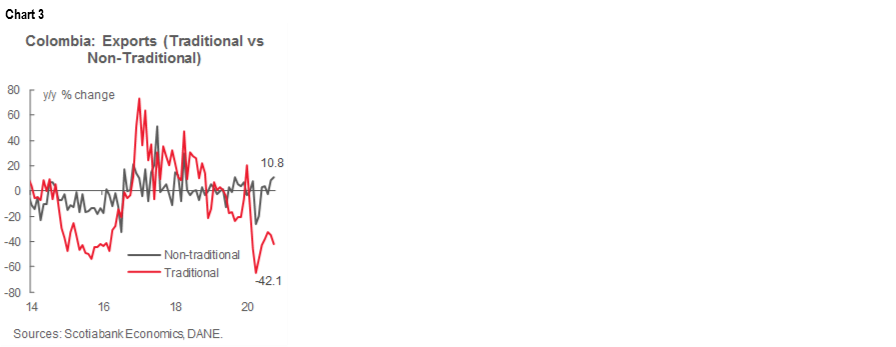
Traditional exports were down by -42.1% y/y in October (chart 3), worse than last month’s figure and the weakest level in four years. Oil-related exports represented 28% of total exports compared with 40% of total exports in 2019. The oil and mining sector provided a drag on total exports since both production and prices have weakened from 2019. Prospects for the sector are mixed, especially for coal due to the structural decline in global demand. Coffee exports fell by -11.9% y/y owing to lower volumes. Non-traditional exports amounted to USD 1.47 bn in October, a 10.8% y/y increase (chart 3, again) stemming from significant gains in exports of gold (up 125.7% y/y) and other agricultural products such as palm oil (47.1% y/y) and bananas (10.9% y/y) exports.
October’s export numbers showed stagnation in exports at the same levels we saw in Q3. Better oil prices would help future export dynamics, but new COVID-19 waves across the world could dent demand. The impact of still-dampened exports on the current account should be moderate due to a simultaneous deterioration in exports and imports resulting from automatic stabilizers in the economy.
II. The current account deficit remained low due to remittance inflows, while the primary financing source was government debt
On Tuesday, December 1, BanRep also released Q3-2020 current account data where the deficit stood at USD 1.77 bn (versus USD -1.65 bn in Q2), equivalent to -2.7% of GDP, the narrowest in terms of total economic activity since Q4-2017 (chart 4). In Q3, the trade deficit widened, while income-account outflows increasingly aligned with better exports behaviour—which highlighted that the current account’s relative stability was supported by higher remittances inflows, which stood at USD 2.6 bn, slightly below the peak registered in Q4-2019. On the other side of the BoP, the financial account’s main sources of funding came from new government indebtedness via multilaterals and global-bonds issuance, while net FDI posted net outflows for the first time since 2013. That said, YTD up to September, the current account deficit stood at USD -6.06 bn (-3.1% of GDP), USD 4.5 bn, smaller than in the comparable period of 2019 (i.e., USD -10.6 bn, -4.4% of GDP). We expect the current account deficit to stabilize in the last quarter of this year and end 2020 at -3.2% of GDP, in line with 2020’s historic contraction in domestic demand.
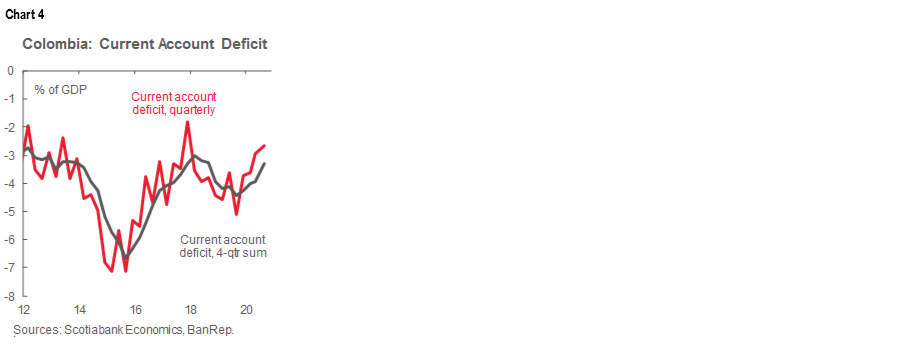
Looking at the numbers in more detail, the Q3 current account deficit widened by USD -121 mn q/q from Q2 to hit the aforementioned USD -1.77 bn (2.7% of GDP).
- The trade deficit widened by USD -700 mn to USD -3.1 bn, especially in the goods balance.
- Total exports contracted on an annual basis by -30.9% y/y, although in sequential terms they rose by 14.4% q/q to USD 8.9 bn due to better oil exports.
- Imports contracted proportionately less on annual basis (-28% y/y) and the quarterly rebound was stronger than in exports, rising 17.7% q/q to USD 12.03 bn, as a result of the domestic re-opening strategy.
- Total combined exports and imports remained at their lowest level since 2010.
- Additionally, income account outflows increased from the previous quarter as better export dynamics boosted profits across Colombia’s main economic sectors, especially in manufacturing, commerce, restaurants and hotels, and financial activities. In the coming quarters, income-account outflows should keep growing as domestic activity strengthens and oil export values rise, which together imply greater repatriation of profits. That said, these outflows could be offset by persistently higher remittance inflows. In Q3, remittance inflows curbed the current account deficit as they increased by USD 549 mn q/q, putting them at levels similar to what we last saw at end-2019.
On the financing side, capital inflows to the public sector, due to monetization of external debt and offshore purchases of local debt, stood at USD 4.36 bn, while net FDI posted outflows for the first time since 2013 and stood at USD -33.2 mn in Q3-2020. International reserves increased by USD 250 mn. It should be noted that FDI is no longer the main contributor to financing the current account deficit (chart 5), and we expect this trend to continue for the rest of 2020, while in 2021, better economic activity should lead to new inflows. YTD up to September, FDI inflows stood at USD 5.45 bn (down -50% y/y and equivalent to 2.8% of GDP), while net portfolio investment came in at USD 4.1 bn (3.1% of GDP). Portfolio flows YTD reflected public external debt issuance (USD 6.2 bn), which was partially offset by outflows from local equity investments (USD -447 mn) and payments on external private debt (USD 1.2 bn). Within the FDI flows, 26% was in the financial sector, 25% in the oil and mining sectors, 14% in the energy sector, 11% in commerce and hotels, 11% in the manufacturing industry, and 13% in other areas. FDI is diversifying, with inflows increasing outside the oil and mining sectors.

The current account results for Q3-2020 reflected domestic re-opening dynamics, where a wider trade deficit and higher-income account outflows were partially offset by near-record remittance inflows. In the coming months, export values should improve as oil prices rebounded recently. On the financing side, FDI turned negative in Q3, and new external public indebtedness through multilateral borrowing and debt issuance became a leading source of funding for Colombia’s balance of payments. According to the government’s Fiscal Framework, external financing sources should amount to around USD 16 bn in 2020, which should be enough to cover entirely the -3.2% of GDP current account deficit expected for the year.
Finally, despite the expected narrowing in the current account deficit projected in 2020, we forecast it to widen again in 2021. Colombia’s economic recoveries typically feature an increase in the external deficit via capital-goods imports. However, these imports are usually financed through higher FDI.
—Sergio Olarte & Jackeline Piraján
MEXICO: STRONG REMITTANCE INFLOWS CONTINUED IN OCTOBER; BANXICO’S NOVEMBER SURVEY POINTED TO A SLIGHTLY SMALLER 2020 GDP CONTRACTION; OCTOBER PUBLIC FINANCES IMPLY SOME SETBACKS LEFT TO COME
I. Strong remittance inflows continued in October
On Tuesday, December 1, INEGI released data on income remittances in October, an important source of foreign exchange resources that also has a strong impact on consumption. Remittances in dollars and pesos (USD 3.6 bn and MXN 76.9 bn, respectively) continued to report record levels for a tenth month of the year (chart 6) and for the period January to October (USD 33.6 bn and MXN 717.6 bn).
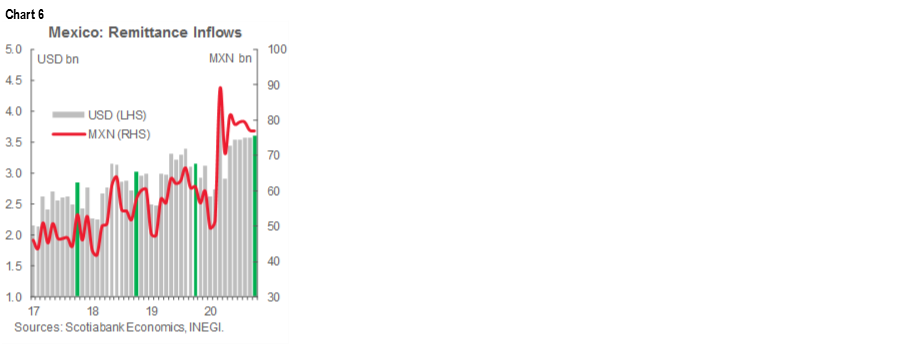
A number of analyses agree on the main factors that have driven remittances to Mexico to historic highs in the face of more pessimistic forecasts that pandemic-related lockdowns would cut remittance flows. Fiscal supports granted by the US government to its workers have helped: in some states, such as California, there are even funds to support undocumented migrants. It is also noteworthy that Mexican migrants have sought to take on jobs in sectors considered essential; that said, even in cases where employment has been reduced, the proportion of income that Mexican migrants are remitting home has gone up as they’ve tapped domestic savings to sustain transfers.
Finally, the deputy Governor of the Bank of Mexico, Javier Guzmán Calafell, has noted that “In the absence of this flow of remittances, the contraction of consumption and the economy would have been more severe”, adding that Mexico could see a total of USD 40 bn in remittance flows in 2020. This amount is similar to the number anticipated by President López Obrador, who estimated that 2020 will be a record year for remittances.
II. Banxico’s November survey pointed to a slightly smaller 2020 GDP contraction
According to the Banxico Survey of Expectations for November, released on Monday, December 1, private-sector economic analysts have edged back their expectations for 2020’s GDP contraction for a fourth consecutive time, on this occasion from -9.44% y/y to -9.10% y/y. In the same sense, the economic rebound expected in 2021 was also revised upward from 3.21% y/y to 3.29% y/y. These figures are closely in line with our forecasts of a -9.1% y/y contraction in 2020 and growth of 3.3% y/y in 2021 (see the November 28 Latam Weekly).
Looking at the Survey’s other details:
- Expectations for both headline and core inflation at the end of 2020 decreased to 3.63% y/y (previously 3.92% y/y) and 3.77% y/y (previously 3.92% y/y), respectively. For the end of 2021, headline inflation expectation edged up a tick to 3.61% y/y (previously 3.60% y/y) and core inflation remained unchanged at 3.48% y/y. We emphasize that, on the horizon where monetary policy operates, both headline and core inflation expectations remain within Banxico’s target range;
- Exchange-rate projections for the end of 2020 and 2021 strengthened from November’s survey and the Mexican currency is expected to end 2020 at USDMXN 20.57 (previously USDMXN 21.74) and USDMXN 21.20 (USDMXN 22.05), respectively;
- As for monetary policy, from the fourth quarter of 2020 to the second quarter of 2021, most analysts anticipate that the interbank funding rate will be held at 4.25%, although for the second quarter of 2021 a small fraction expects it to go lower;
- The outlook for the labour market has become less negative, with a loss of -832k jobs (versus -902k previously) expected in 2020, with a recovery of 360k jobs in 2021; and
- Regarding the factors that could hinder Mexico’s economic growth in the next six months, the most-cited issues were related to domestic economic conditions (46%), governance (25%), and external conditions (20%).
III. October public finances imply some setbacks left to come
On Monday, November 30, the Secretary of Finance presented an update on public finances as of October. During the period from January to October 2020, the main public balance sheet accumulated a deficit of MXN -327 bn, some MXN 104 bn less than the deficit that was programmed.
Meanwhile, the primary balance for January to October YTD showed a surplus of MXN 176 bn, considerably higher than the programmed surplus of MXN 101 bn, although -42% y/y lower than that recorded for the same period a year earlier. In the details:
- Total revenues amounted to nearly MXN 4.2 tn during the first ten months of 2020, a fall of -4.9% y/y and an undershoot of MXN 281.8 bn with respect to the program. Oil revenues during January to October amounted to only MXN 448.7 bn, a decline of -43% y/y and well below the MXN 808.2 bn programmed in the budget. The drop in oil revenues was partially offset by a MXN 77.6 bn increase in non-oil revenues; and
- Total net expenses between January and October amounted to just over MXN 4.6 tn, which meant an under-spend of MXN 364.1 mn pesos and a decrease of -2.0% y/y in real terms, a reflection of austerity measures.
Even with the extraordinary use of funds and trusts, in which the FEIP (i.e., the Budget Revenue Stabilization Fund) is included, there was still a slight decrease in total income, which implies that we could see further weakness in the last two months of the year. There is little room to maneuver to expand the fiscal envelope at the end of the year. A substantial deficit in the Public Sector Financial Requirements for 2020 is expected, which would maintain pressure on public finances for the rest of the year.
—Paulina Villanueva
PERU: NOVEMBER INFLATION SURPRISED TO THE UPSIDE; LEADING GROWTH INDICATORS FOR OCTOBER WERE MIXED, BUT MOSTLY POSITIVE
I. November inflation surprised to the upside
We are raising our end-2020 inflation forecast from 1.5% y/y to 2.0% y/y (chart 7). At the same time, we are maintaining our forecast for end-2021 at 2.0% y/y. This move comes after the November inflation result, published on Tuesday, December 1 by the National Statistics Institute, INEI.
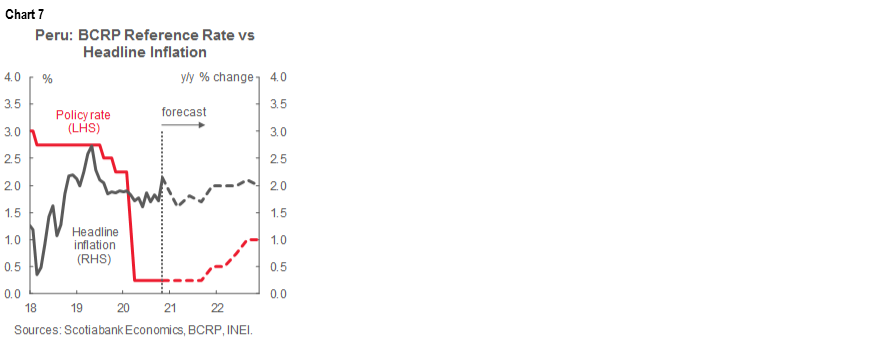
Lima inflation surprised to the upside in November, rising 0.52% m/m according to INEI, above market and our expectations (0.04% m/m according to Bloomberg). The prices of perishable food rose, mainly during the first half of November, due to protests by agricultural workers; this impact should be temporary. Higher local fuel prices and re-adjustments to water and electricity regulatory prices also had an impact.
The pace of yearly inflation accelerated from 1.7% y/y in October to 2.1% y/y in November. However, isolating volatile components—such as food and energy, core inflation remained around 1.7% y/y, reflecting a more stable structural component in inflation.
We anticipate a more moderate inflation rate in December for two reasons: November’s rise in perishable food prices should reverse and the usual Christmas-linked increase in inflation should be more subdued due to weak domestic demand. Still, with inflation now trending at 2.1% y/y, our end-2020 1.5% y/y forecast no longer seems feasible and we are raising our call to 2.0% y/y.
II. Leading growth indicators for October were mixed, but mostly positive
The National Statistics Institute published leading indicators for October GDP on Tuesday, December 1. The official aggregate figure will be published on December 15. The most recent figure was a -9.4% y/y contraction in September. The leading indicators just published point to a more modest contraction of between -4.5% y/y and -5.5% y/y in October.
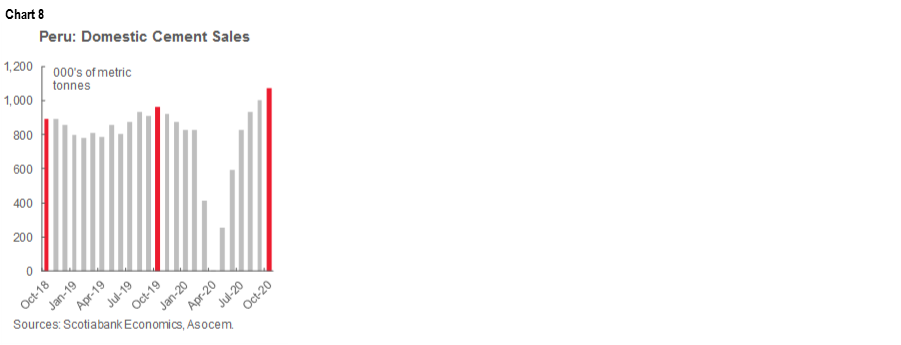
Perhaps the main positive leading indicator was cement sales, which soared for the second consecutive month, increasing 11.3% y/y (7.5% m/m) in October, after having already risen 9.7% y/y in September (chart 8). This is in line with other indicators that point to a booming real estate market.
Government spending rose 14.5% y/y in October. Government spending has been showing positive growth since July, but October was the largest increase since January, and, in fact the greatest level of monthly spending this year, at PEN 9.1 bn.
Mining and oil & gas fell -2.8%, y/y in October (11% m/m). This was, however, a sharp improvement over the -12.2% y/y contraction in September and -11.1% y/y pullback in August. Copper output rose 1.9% y/y and has returned to pre-COVID-19 levels, along with other metals, but this was more than compensated for by a continued contraction in precious metals, which is more a structural issue (i.e., mine depletion).
Fishing rose 12.4% y/y. However, October was still an out-of-season month. The fishing season begins in November, and, since the catch was poor last year, we are expecting strong annual growth beginning in November.
Electricity volumes declined by a mild -0.4% y/y in October and is nearly back at pre-COVID-19 levels. Finally, the VAT sales tax intake was nearly on par with pre-COVID-19 levels, down only -0.1% y/y. This is a good harbinger for consumption. The VAT improvement is significant, having climbed from -44% y/y at its trough in May during the lockdown.
Exports also increased in October, by 0.8% y/y, according to partial results. If confirmed, this will be the first positive monthly result this year. What was particularly interesting is that non-mining exports rose 19% y/y. The breakdown was not given, but much of this must logically involve agro-industrial exports.
—Guillermo Arbe & Mario Guerrero
DISCLAIMER
This report has been prepared by Scotiabank Economics as a resource for the clients of Scotiabank. Opinions, estimates and projections contained herein are our own as of the date hereof and are subject to change without notice. The information and opinions contained herein have been compiled or arrived at from sources believed reliable but no representation or warranty, express or implied, is made as to their accuracy or completeness. Neither Scotiabank nor any of its officers, directors, partners, employees or affiliates accepts any liability whatsoever for any direct or consequential loss arising from any use of this report or its contents.
These reports are provided to you for informational purposes only. This report is not, and is not constructed as, an offer to sell or solicitation of any offer to buy any financial instrument, nor shall this report be construed as an opinion as to whether you should enter into any swap or trading strategy involving a swap or any other transaction. The information contained in this report is not intended to be, and does not constitute, a recommendation of a swap or trading strategy involving a swap within the meaning of U.S. Commodity Futures Trading Commission Regulation 23.434 and Appendix A thereto. This material is not intended to be individually tailored to your needs or characteristics and should not be viewed as a “call to action” or suggestion that you enter into a swap or trading strategy involving a swap or any other transaction. Scotiabank may engage in transactions in a manner inconsistent with the views discussed this report and may have positions, or be in the process of acquiring or disposing of positions, referred to in this report.
Scotiabank, its affiliates and any of their respective officers, directors and employees may from time to time take positions in currencies, act as managers, co-managers or underwriters of a public offering or act as principals or agents, deal in, own or act as market makers or advisors, brokers or commercial and/or investment bankers in relation to securities or related derivatives. As a result of these actions, Scotiabank may receive remuneration. All Scotiabank products and services are subject to the terms of applicable agreements and local regulations. Officers, directors and employees of Scotiabank and its affiliates may serve as directors of corporations.
Any securities discussed in this report may not be suitable for all investors. Scotiabank recommends that investors independently evaluate any issuer and security discussed in this report, and consult with any advisors they deem necessary prior to making any investment.
This report and all information, opinions and conclusions contained in it are protected by copyright. This information may not be reproduced without the prior express written consent of Scotiabank.
™ Trademark of The Bank of Nova Scotia. Used under license, where applicable.
Scotiabank, together with “Global Banking and Markets”, is a marketing name for the global corporate and investment banking and capital markets businesses of The Bank of Nova Scotia and certain of its affiliates in the countries where they operate, including; Scotiabank Europe plc; Scotiabank (Ireland) Designated Activity Company; Scotiabank Inverlat S.A., Institución de Banca Múltiple, Grupo Financiero Scotiabank Inverlat, Scotia Inverlat Casa de Bolsa, S.A. de C.V., Grupo Financiero Scotiabank Inverlat, Scotia Inverlat Derivados S.A. de C.V. – all members of the Scotiabank group and authorized users of the Scotiabank mark. The Bank of Nova Scotia is incorporated in Canada with limited liability and is authorised and regulated by the Office of the Superintendent of Financial Institutions Canada. The Bank of Nova Scotia is authorized by the UK Prudential Regulation Authority and is subject to regulation by the UK Financial Conduct Authority and limited regulation by the UK Prudential Regulation Authority. Details about the extent of The Bank of Nova Scotia's regulation by the UK Prudential Regulation Authority are available from us on request. Scotiabank Europe plc is authorized by the UK Prudential Regulation Authority and regulated by the UK Financial Conduct Authority and the UK Prudential Regulation Authority.
Scotiabank Inverlat, S.A., Scotia Inverlat Casa de Bolsa, S.A. de C.V, Grupo Financiero Scotiabank Inverlat, and Scotia Inverlat Derivados, S.A. de C.V., are each authorized and regulated by the Mexican financial authorities.
Not all products and services are offered in all jurisdictions. Services described are available in jurisdictions where permitted by law.