- A sales beat in February and upward revisions...
- ...were offset by bleak guidance for March...
- ...that may be due to a services rotation...
- ...and poor data quality
- On net, treat the figures with even greater care than usual
- Retail sales, headline / ex-autos, February, m/m % change:
- Actual: -0.2 / -0.7
- Scotia: -0.6 / na
- Consensus: -0.6 / 0.0
- Prior: 1.6 / 0.9 (revised up from 1.4 / 0.9)
- March ‘flash’ guidance: -1.4
Canadian retailers had a strong first quarter overall but momentum waned over February and March which bakes in a potential reversal in Q2. Data quality is even more suspect than usual and sends a chilling caution ahead of more important macroeconomic reports on the path to the June 7th BoC meeting. When combined with a possible rotation to services spending that is not captured in this report we should be very careful about drawing overly hasty conclusions on the state of the Canadian consumer.
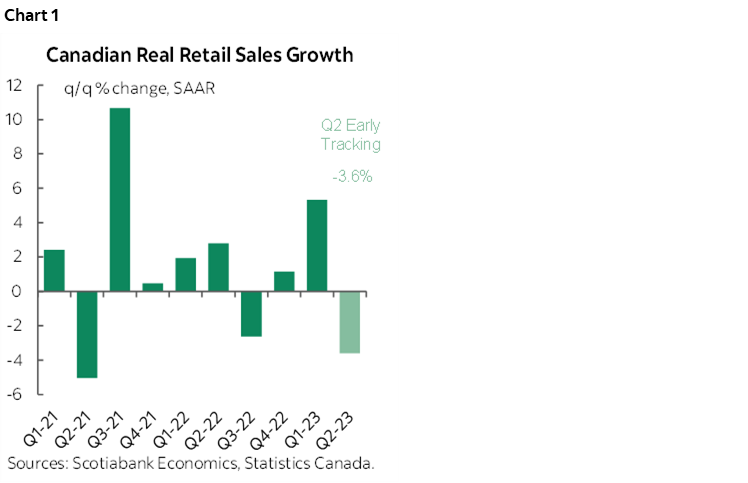
Chart 1 shows quarterly tracking. Sales volumes were up by about 5% q/q SAAR in Q1 assuming that the March estimate is accurate and was mostly due to lower volumes. The second quarter has a drop of around 3½% q/q SAAR baked in based upon the first quarter average and the way the quarter ended and hence before we get an Q2 data.
February’s drop in the value of sales was -0.2% m/m and was not a bad as the initial estimate (-0.6%) while the prior month’s 1.4% gain was revised up to 1.6%. On net that makes for a better than expected set of numbers so far.
The rub lies in the preliminary ‘flash’ guidance for March that fell by 1.4% and the quality of the data.
A record low 28.4% response rate from retailers was tallied for this estimate for March. The average response rate for the preliminary estimates has been just over double that since Statcan started offering flash estimates during the pandemic.
This very low sampling rate serves as a caution when interpreting the data. Chart 2 shows the historical sampling rates along with the monthly revisions to the initial flash readings versus the current estimates for those months. Note the general downward trend in response rates (red dots) that is the first caution on the waning quality of these readings.
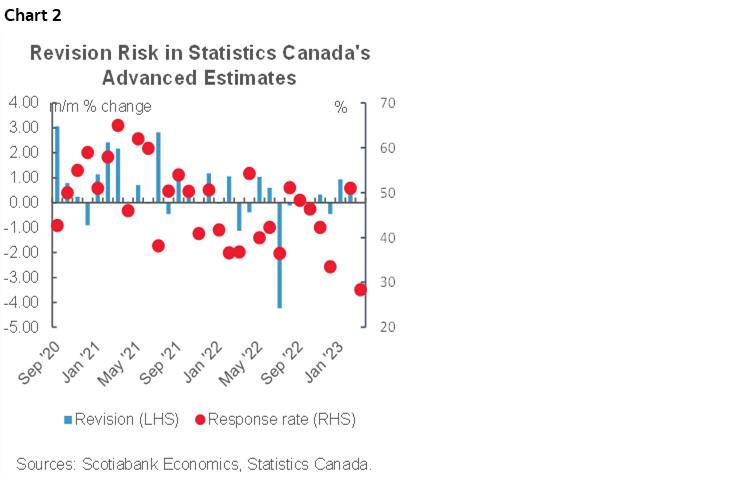
Secondly, I’m left wondering why a record low response rate was recorded this time. Was it because of March break? The prior two months of March saw response rates of 65% in 2021 and 37% in 2022. Maybe more folks travelled and retailers were busier this year and hence slower to respond to Statcan. Still, we’re talking about March break vacations that occurred a month ago or slightly longer which should have given enough time.
Or is it the effect of the strike? The PSAC strike did not start until this past Wednesday and one hopes that anticipation of the strike and its commencement did not get in the way of providing quality estimates. Statcan did not provide an explanation for the record low response rate.
Whatever the case, it serves as a caution on the path to far more important macroeconomic data like next week’s GDP and the next CPI report in the lead up to the BoC’s June 7th decisions and communications.
The reason the low response rate matters is that three of the biggest revisions to the initial estimate also had abnormally low response rates (but not as low as this one). Revisions are shown as the blue bars in chart 2. Two of those occasions revised up the initial guidance by about three full percentage points and one revised it down by 4 full percentage points.
Higher retail prices in February played a significant role as the dollar value fell -0.2% m/m but volumes fell by -0.7% m/m implying that prices were up by the 0.5% m/m difference which is roughly consistent with the more retail-oriented parts of the month’s CPI report. We don’t know how much of the 1.4% m/m drop in the value of sales in March was due to volumes versus prices, but it’s probable that it was due to lower volumes based off CPI.
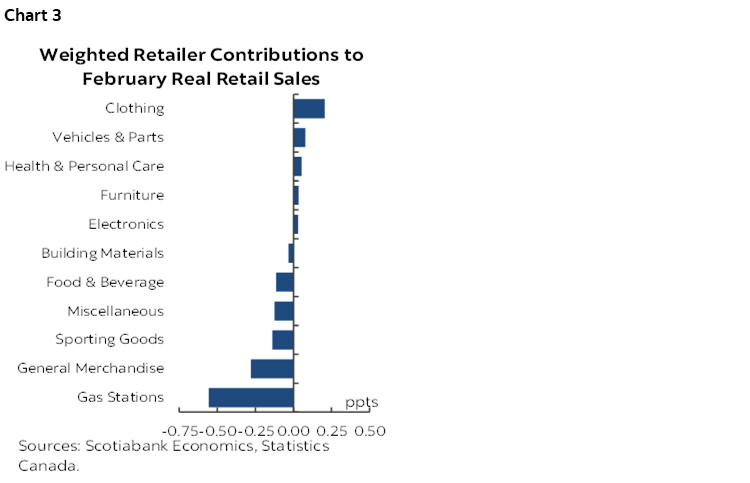
Chart 3 shows the weighted contributions to the decline in the volume of sales during February. Basically folks bought a higher volume of vehicles/parts and clothing and smaller amounts of a few other things in February, and less volume at gas stations and in the general merchandise and sporting goods categories.
There is also the caution that retail sales are only about half of total consumer spending and don't capture most services. In Canada, you won't find restaurants and bars in these numbers, or travel/tourism related activities etc. It's a bit different than elsewhere such as in the US where eating/drinking establishments are included in US retail sales.
So, if March break saw a pick-up in restaurants, travel, etc then the overall picture for consumer spending could be different than what was portrayed today as a substitution effect out of goods into services may have occurred. Flight data and shaky restaurant indicators may be indicating as much.
Toss in data quality issues and I’m not sure we truly learned a whole lot about the state of the Canadian consumer in today’s figures.
DISCLAIMER
This report has been prepared by Scotiabank Economics as a resource for the clients of Scotiabank. Opinions, estimates and projections contained herein are our own as of the date hereof and are subject to change without notice. The information and opinions contained herein have been compiled or arrived at from sources believed reliable but no representation or warranty, express or implied, is made as to their accuracy or completeness. Neither Scotiabank nor any of its officers, directors, partners, employees or affiliates accepts any liability whatsoever for any direct or consequential loss arising from any use of this report or its contents.
These reports are provided to you for informational purposes only. This report is not, and is not constructed as, an offer to sell or solicitation of any offer to buy any financial instrument, nor shall this report be construed as an opinion as to whether you should enter into any swap or trading strategy involving a swap or any other transaction. The information contained in this report is not intended to be, and does not constitute, a recommendation of a swap or trading strategy involving a swap within the meaning of U.S. Commodity Futures Trading Commission Regulation 23.434 and Appendix A thereto. This material is not intended to be individually tailored to your needs or characteristics and should not be viewed as a “call to action” or suggestion that you enter into a swap or trading strategy involving a swap or any other transaction. Scotiabank may engage in transactions in a manner inconsistent with the views discussed this report and may have positions, or be in the process of acquiring or disposing of positions, referred to in this report.
Scotiabank, its affiliates and any of their respective officers, directors and employees may from time to time take positions in currencies, act as managers, co-managers or underwriters of a public offering or act as principals or agents, deal in, own or act as market makers or advisors, brokers or commercial and/or investment bankers in relation to securities or related derivatives. As a result of these actions, Scotiabank may receive remuneration. All Scotiabank products and services are subject to the terms of applicable agreements and local regulations. Officers, directors and employees of Scotiabank and its affiliates may serve as directors of corporations.
Any securities discussed in this report may not be suitable for all investors. Scotiabank recommends that investors independently evaluate any issuer and security discussed in this report, and consult with any advisors they deem necessary prior to making any investment.
This report and all information, opinions and conclusions contained in it are protected by copyright. This information may not be reproduced without the prior express written consent of Scotiabank.
™ Trademark of The Bank of Nova Scotia. Used under license, where applicable.
Scotiabank, together with “Global Banking and Markets”, is a marketing name for the global corporate and investment banking and capital markets businesses of The Bank of Nova Scotia and certain of its affiliates in the countries where they operate, including; Scotiabank Europe plc; Scotiabank (Ireland) Designated Activity Company; Scotiabank Inverlat S.A., Institución de Banca Múltiple, Grupo Financiero Scotiabank Inverlat, Scotia Inverlat Casa de Bolsa, S.A. de C.V., Grupo Financiero Scotiabank Inverlat, Scotia Inverlat Derivados S.A. de C.V. – all members of the Scotiabank group and authorized users of the Scotiabank mark. The Bank of Nova Scotia is incorporated in Canada with limited liability and is authorised and regulated by the Office of the Superintendent of Financial Institutions Canada. The Bank of Nova Scotia is authorized by the UK Prudential Regulation Authority and is subject to regulation by the UK Financial Conduct Authority and limited regulation by the UK Prudential Regulation Authority. Details about the extent of The Bank of Nova Scotia's regulation by the UK Prudential Regulation Authority are available from us on request. Scotiabank Europe plc is authorized by the UK Prudential Regulation Authority and regulated by the UK Financial Conduct Authority and the UK Prudential Regulation Authority.
Scotiabank Inverlat, S.A., Scotia Inverlat Casa de Bolsa, S.A. de C.V, Grupo Financiero Scotiabank Inverlat, and Scotia Inverlat Derivados, S.A. de C.V., are each authorized and regulated by the Mexican financial authorities.
Not all products and services are offered in all jurisdictions. Services described are available in jurisdictions where permitted by law.