- Core inflation is still hot, but climbed at a slower pace in July
- Used vehicle prices were the main driver of cooler core CPI
- Airfare, clothing, health insurance, cell phone bills also eased
- Grocery prices are rising strongly
- Shelter costs face most of the upside risk into 2022
- A full-cycle view on inflation’s drivers still leaves major risks ahead
US CPI, m/m % // y/y %, July:
Actual: 0.5 / 5.4
Scotia: 0.5 / 5.4
Consensus: 0.5 / 5.3
Prior: 0.9 / 5.4
US core CPI, m/m % // y/y %, July:
Actual: 0.3 / 4.3
Scotia: 0.6 / 4.5
Consensus: 0.4 / 4.3
Prior: 0.9 / 4.5
US core inflation did not land sharply higher than expected for the first time in four months. Headline CPI readings were in line with expectations, but core inflation was a little softer than expected. That doesn’t mean that core inflation was soft last month, but it does provide one month’s relief in what remains a full cycle debate over transitory and longer-lived drivers.
At an annualized rate, the 0.3% m/m seasonally adjusted rise in US core inflation translates into a 4% pace which continues to strongly overshoot the Fed’s run slightly hotter revised goals statement. As chart 1 shows, that annualized pace pulled back, but it was still strong. Chart 2 shows the year-over-year increases in core CPI and the connection with core PCE that will arrive on August 27th.
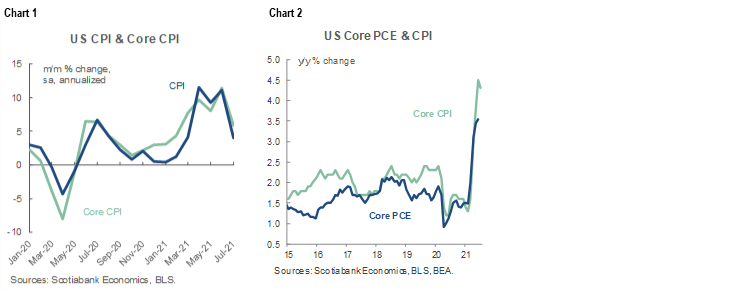
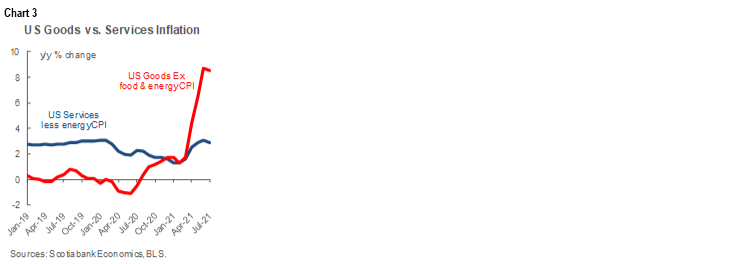
Chart 3 shows that both core goods CPI and core services CPI registered slightly softer increases last month.
The main driver of the softer core inflation reading was used vehicle prices that contributed less than a tenth of a percentage point to the month-over-month change in core CPI during July. Chart 4 shows how used vehicle price increases sharply decelerated last month to +0.2% m/m after three straight months of large gains in the 7–10% m/m range. That stands in stark contrast to the prior couple of months when, for example, used vehicles contributed 0.4% in weighted terms to the 0.9% rise in core prices during June. That used vehicle price inflation dropped out in July was known in advance through industry guidance. Chart 5 shows how expensive used vehicles have become relative to new vehicles which has put an affordability squeeze on the used segment and limits its ability to serve as an escape valve on new vehicle shortages going forward.
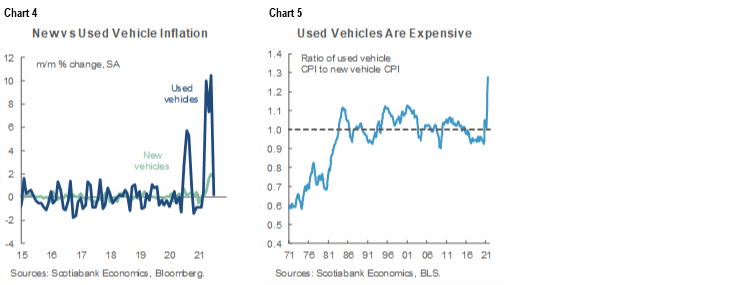
Nothing else accelerated by enough to offset the deceleration in used vehicle price inflation. Chart 4 also shows that new vehicle price inflation was fairly stable (+1.7% m/m) and in line with the pattern over the past several months. Given how unaffordable used vehicles have become relative to history, we could see faster increases in new vehicle prices going forward as something to monitor.
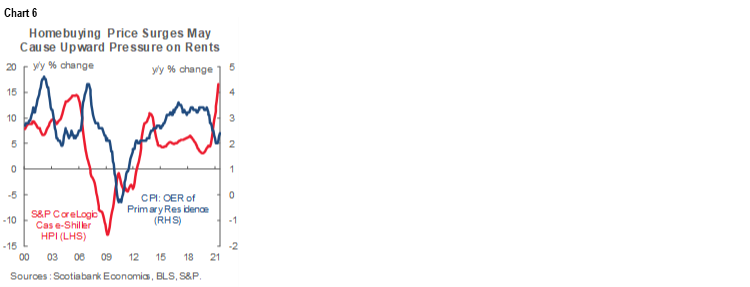
Shelter prices were up by 0.4% m/m which is in line with the multi-month trend but not accelerating off an otherwise rapid annualized pace. Within shelter, owners equivalent rent was up by 0.3% m/m again and lodging away from home (ie: accommodations) saw another strong gain of 6% m/m. Chart 6 shows that much of the upside risk to OER likely likes ahead in lagged reaction to rising house prices.
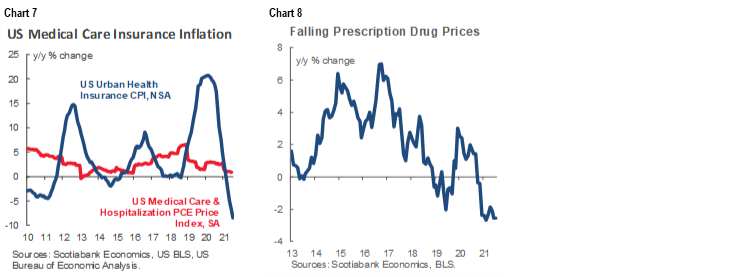
Medical care contributions to inflation also continued to ebb. Medical care commodities were up only 0.2% m/m while medical care services were up by just 0.3% m/m. Overall medical care services inflation continues to decline in year-over-year terms. Chart 7 shows one of the drivers. Chart 8 shows the continued drag from prescription drug prices. Medical disinflation runs against many years of pre-pandemic pressures and may be transitory in response to one-off adjustments to policy changes and given the year-over-year rates are based off high prices early in the pandemic.
Airfare inflation also ebbed. After gains of 7% m/m in May and 2.7% m/m in June, prices were flat (-0.1%) in July. Chart 9 also shows how volatile the pattern is so it’s unlikely this driver has gone away.

There was also some relief in terms of cell phone bills (chart 10). Given early pandemic effects, this disinflationary pattern will be monitored to see if it is more than just re-basing to when bills were soaring early on in the pandemic.

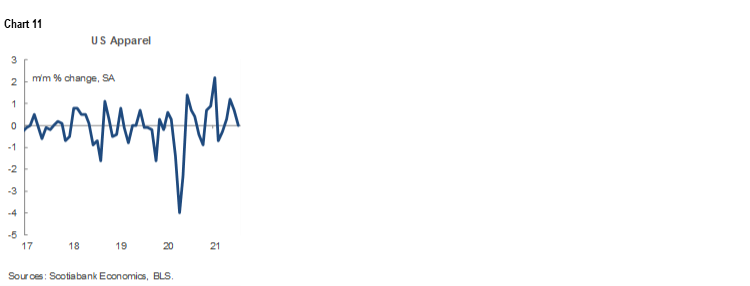
Clothing prices dropped out as a driver (0% m/m) after a couple of months of notable gains along a noisy trend (chart 11). Depending upon what happens to restrictions, we’re likely to see the trend remain pointed toward significant but volatile gains.
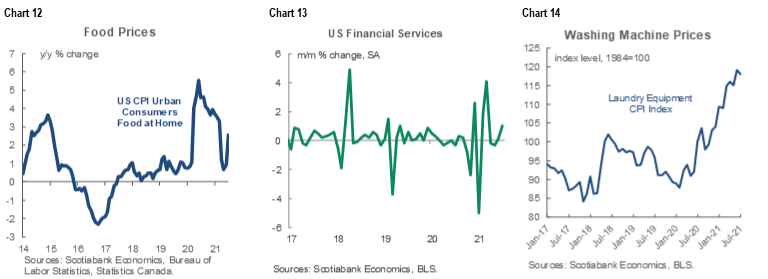
On the flip side, food at home (ie: groceries) price inflation accelerated last month (chart 12) and so did financial services pricing (chart 13) while appliances eased a touch along a prolonged upward trend (chart 14).
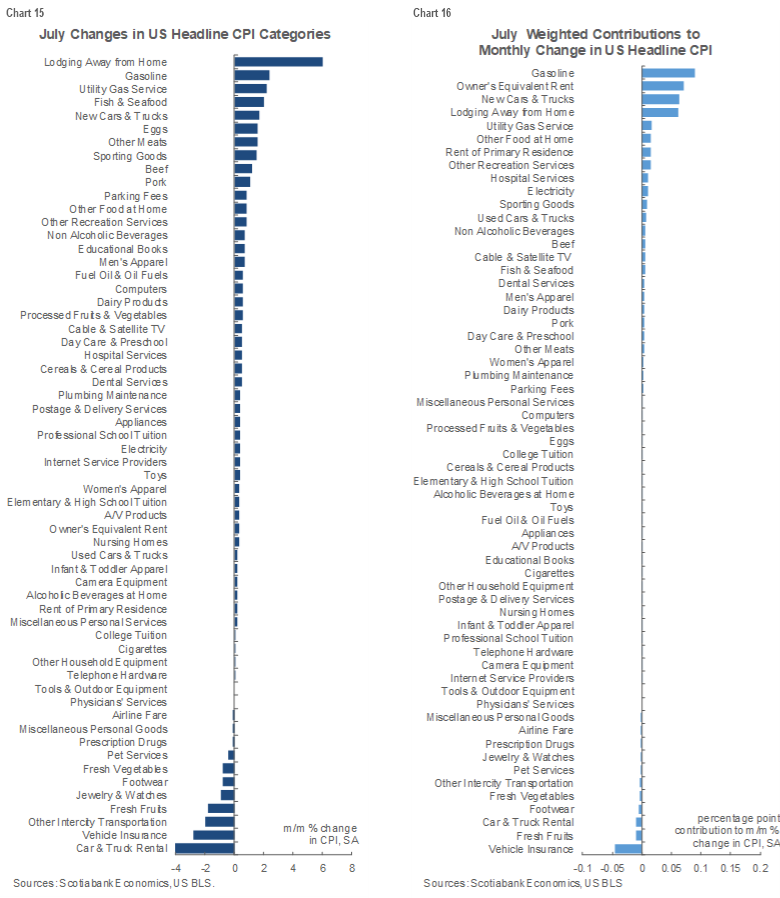
Charts 15 and 16 break down seasonally adjusted price changes by component in unweighted (chart 15) and weighted (chart 16) contribution terms.
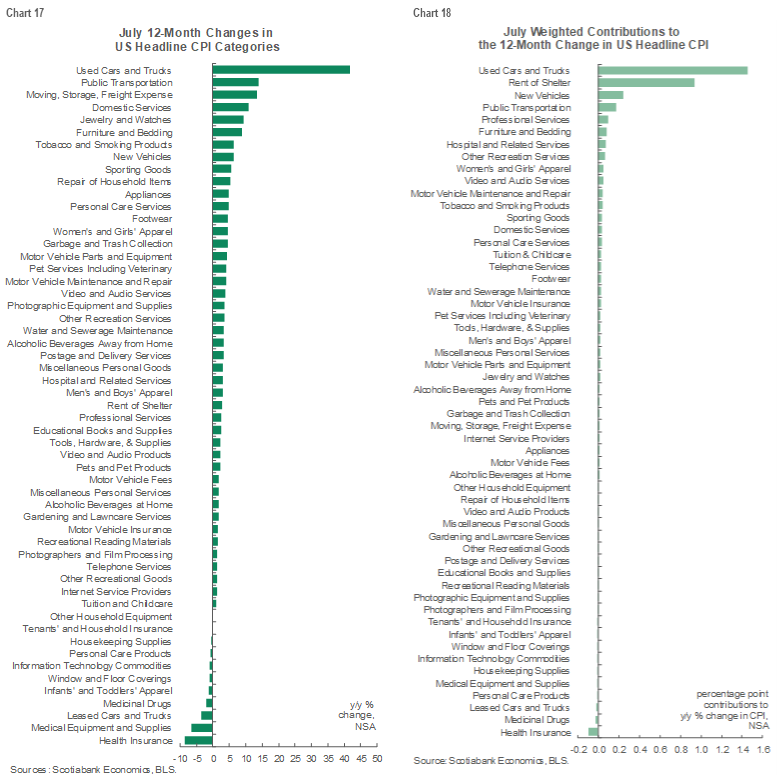
Charts 17 and 18 do the same thing in year-over-year terms.
DISCLAIMER
This report has been prepared by Scotiabank Economics as a resource for the clients of Scotiabank. Opinions, estimates and projections contained herein are our own as of the date hereof and are subject to change without notice. The information and opinions contained herein have been compiled or arrived at from sources believed reliable but no representation or warranty, express or implied, is made as to their accuracy or completeness. Neither Scotiabank nor any of its officers, directors, partners, employees or affiliates accepts any liability whatsoever for any direct or consequential loss arising from any use of this report or its contents.
These reports are provided to you for informational purposes only. This report is not, and is not constructed as, an offer to sell or solicitation of any offer to buy any financial instrument, nor shall this report be construed as an opinion as to whether you should enter into any swap or trading strategy involving a swap or any other transaction. The information contained in this report is not intended to be, and does not constitute, a recommendation of a swap or trading strategy involving a swap within the meaning of U.S. Commodity Futures Trading Commission Regulation 23.434 and Appendix A thereto. This material is not intended to be individually tailored to your needs or characteristics and should not be viewed as a “call to action” or suggestion that you enter into a swap or trading strategy involving a swap or any other transaction. Scotiabank may engage in transactions in a manner inconsistent with the views discussed this report and may have positions, or be in the process of acquiring or disposing of positions, referred to in this report.
Scotiabank, its affiliates and any of their respective officers, directors and employees may from time to time take positions in currencies, act as managers, co-managers or underwriters of a public offering or act as principals or agents, deal in, own or act as market makers or advisors, brokers or commercial and/or investment bankers in relation to securities or related derivatives. As a result of these actions, Scotiabank may receive remuneration. All Scotiabank products and services are subject to the terms of applicable agreements and local regulations. Officers, directors and employees of Scotiabank and its affiliates may serve as directors of corporations.
Any securities discussed in this report may not be suitable for all investors. Scotiabank recommends that investors independently evaluate any issuer and security discussed in this report, and consult with any advisors they deem necessary prior to making any investment.
This report and all information, opinions and conclusions contained in it are protected by copyright. This information may not be reproduced without the prior express written consent of Scotiabank.
™ Trademark of The Bank of Nova Scotia. Used under license, where applicable.
Scotiabank, together with “Global Banking and Markets”, is a marketing name for the global corporate and investment banking and capital markets businesses of The Bank of Nova Scotia and certain of its affiliates in the countries where they operate, including; Scotiabank Europe plc; Scotiabank (Ireland) Designated Activity Company; Scotiabank Inverlat S.A., Institución de Banca Múltiple, Grupo Financiero Scotiabank Inverlat, Scotia Inverlat Casa de Bolsa, S.A. de C.V., Grupo Financiero Scotiabank Inverlat, Scotia Inverlat Derivados S.A. de C.V. – all members of the Scotiabank group and authorized users of the Scotiabank mark. The Bank of Nova Scotia is incorporated in Canada with limited liability and is authorised and regulated by the Office of the Superintendent of Financial Institutions Canada. The Bank of Nova Scotia is authorized by the UK Prudential Regulation Authority and is subject to regulation by the UK Financial Conduct Authority and limited regulation by the UK Prudential Regulation Authority. Details about the extent of The Bank of Nova Scotia's regulation by the UK Prudential Regulation Authority are available from us on request. Scotiabank Europe plc is authorized by the UK Prudential Regulation Authority and regulated by the UK Financial Conduct Authority and the UK Prudential Regulation Authority.
Scotiabank Inverlat, S.A., Scotia Inverlat Casa de Bolsa, S.A. de C.V, Grupo Financiero Scotiabank Inverlat, and Scotia Inverlat Derivados, S.A. de C.V., are each authorized and regulated by the Mexican financial authorities.
Not all products and services are offered in all jurisdictions. Services described are available in jurisdictions where permitted by law.