- Job growth met our expectations with soft details…
- ...as youths and part-time jobs drove the gain
- Wage growth soared again
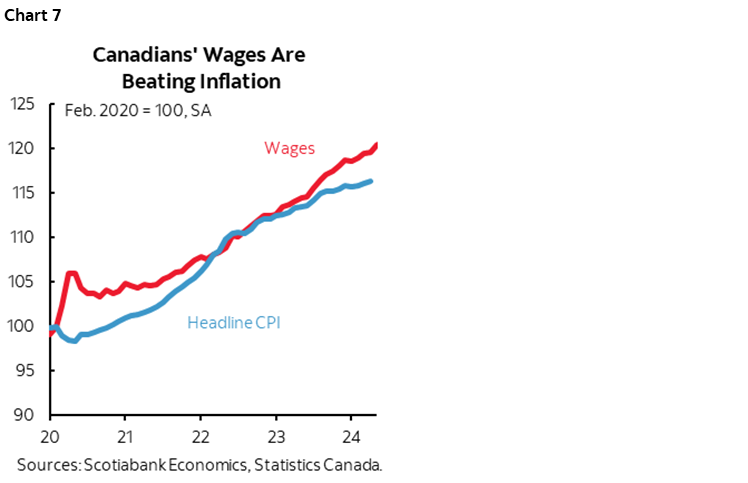
- Canadian wages have outpaced inflation since the start of the pandemic…
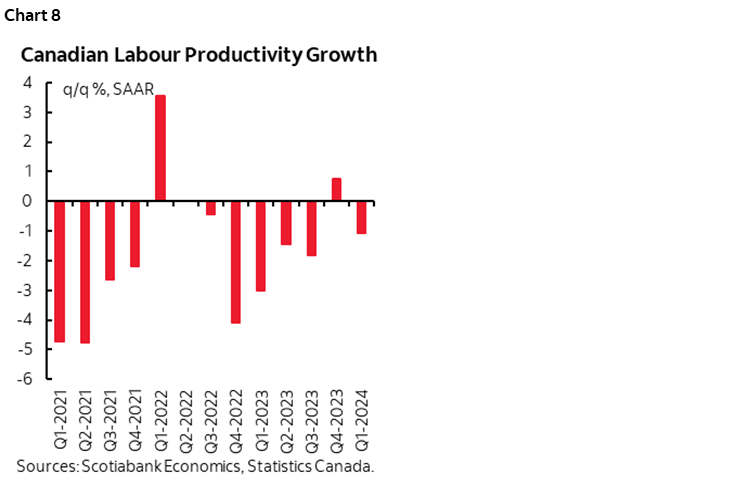
- ...in defiance of awful labour productivity…
- ...pointing to ongoing inflation risk from labour markets
- Builders cut construction jobs despite complaining of worker shortages…
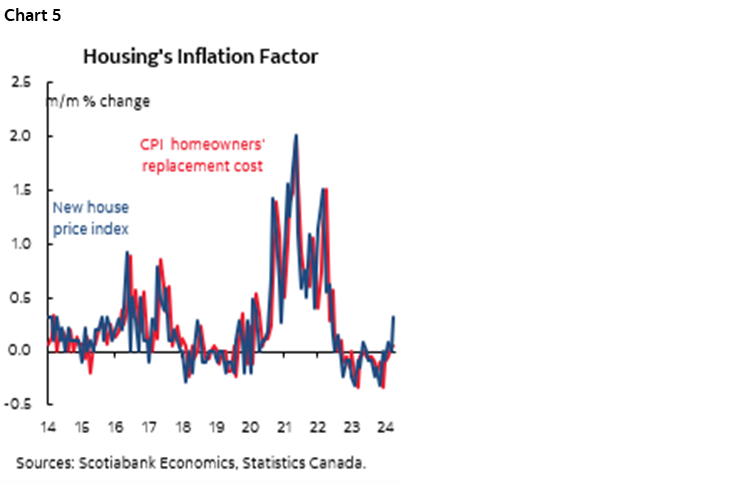
- ...while raising prices
- Hours worked are indicating a strong quarter for GDP growth
- The UR ticked high on excessive population growth
- BoC July risks count much more on two coming rounds of CPI
- Canada employment m/m 000s // UR %, SA, May:
- Actual: 26.7 / 6.2
- Scotia: 30 / 6.2
- Consensus: 22.5 / 6.2
- Prior: 90.4 / 6.1
Canadian job growth continues as wage gains accelerated and hours worked continue to point to a solid second quarter for GDP growth. The figures lean toward how the BoC’s haste could make waste by resurrecting inflation risk.
Markets reacted by driving the Canadian 2-year government bond yield 7bps higher, the 5-year yield about 10bps higher, but CAD about three-quarters of a cent softer to the USD mainly because of broadly based strength in the USD after US payrolls. Canada’s curve is cheapening by less than the US where the numbers were more unambiguously strong, and given BoC Governor Macklem’s strongly dovish reaction function.
Soft Details Behind the Employment Gain...
Chart 1 highlights some of the details. The details were less impressive in terms of the 27k rise in employment than they were in terms of the signals from wages and hours worked.
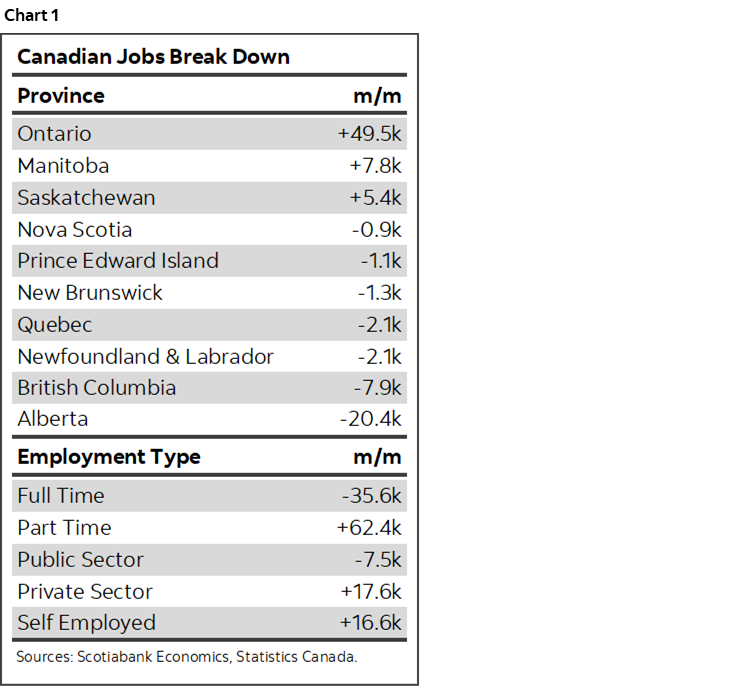
All of the job gain was in part-time jobs (+62k) as full-time jobs fell by 36k.
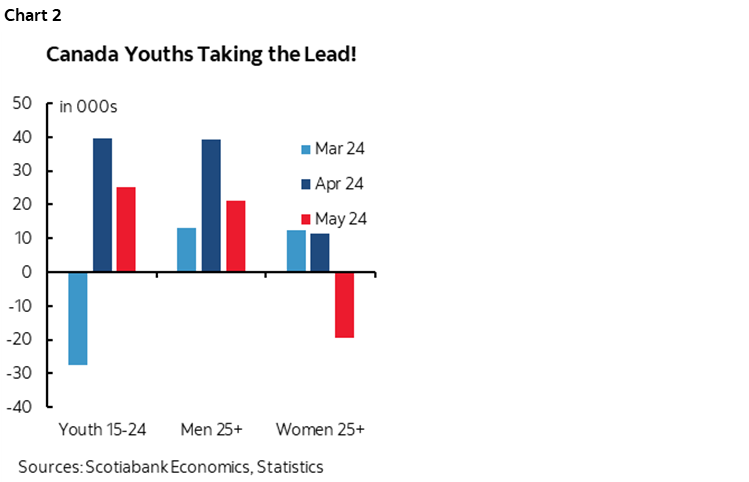
This was also a summer jobs report which was a risk we flagged (chart 2). Youths aged 15–24 got +25k more jobs. Employment among those aged 25+ was flat (+1.6k) as a gain in male employment 25+ was offset by a loss of jobs among women aged 25+.
The job gain was all in private sector payrolls (+18k) and self employed (+17k) as public sector employment fell by-8k.
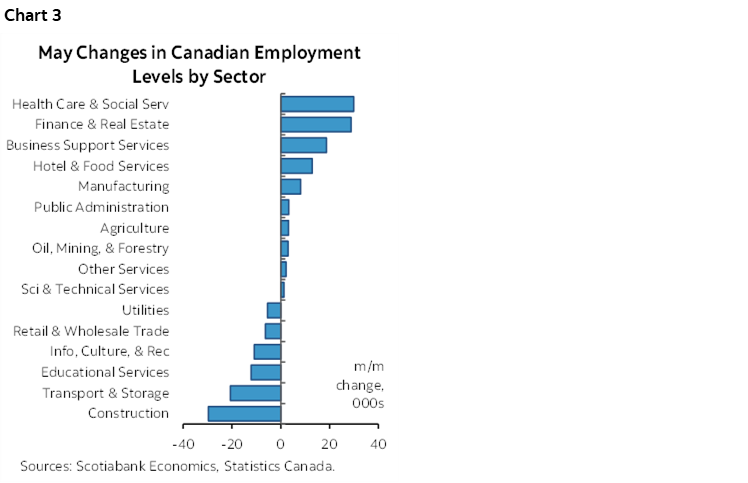
Chart 3 shows that breadth was soft. Job growth was led by health care and social services plus finance and real estate and leasing services. Losses were concentrated in construction, transportation/storage, education and leisure related sectors.
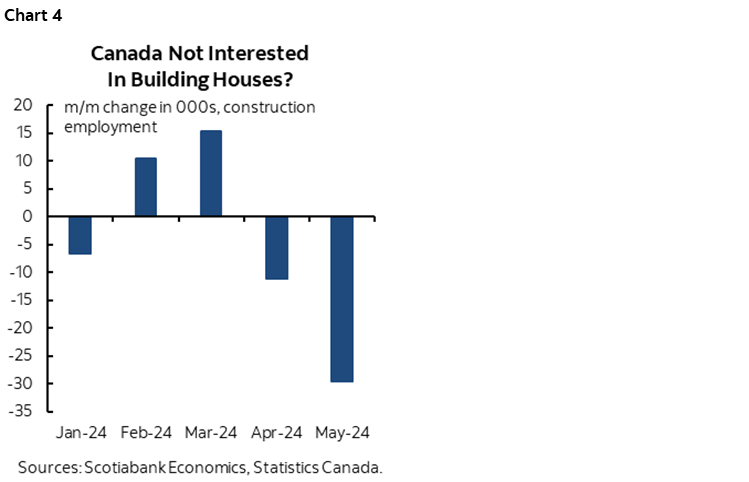
Funny, but I thought Canada wanted to build more homes, yet construction employment is falling sharply (chart 4). This weakens the builders' case that they can't find enough construction workers when in fact they're being fired! This is not a seasonal distortion due to better weather in some months this year than others as year-to-date construction jobs are down a net 22k. Plus there was nothing unusual about the seasonal adjustment factor that was applied to May’s construction employment.
With the obvious need to build more homes while nevertheless firing construction workers, is it possible that builders hold too many cards? Governments are throwing all manner of supports their way in a very tightly supplied market. One possibility I’ve consistently flagged is to keep a close eye on builder pricing power going forward both in terms of prices and features being offered. Builder prices are trending higher and lifting how CPI directly captures housing’s influences (chart 5).
….but Ripping Wage Growth
Wage growth soared by 8.4% m/m at a seasonally adjusted and annualized rate in May. That’s the fastest gain since August of last year (chart 6). Macklem said wage growth was cooling, which it was — for one month in April!
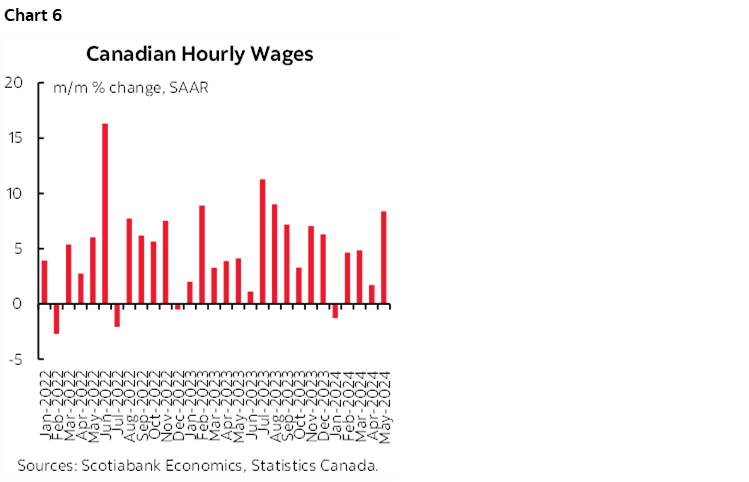
Wage growth was 4.7% m/m SAAR in February, 4.9% in March, 1.7% in April, and 8.4% in May. That’s not a recent cooling trend folks. The three-month moving average sits at 5% m/m SAAR.
Further, wage gains in Canada remain above the cumulative inflation as shown in chart 7 that indexes CPI and average hourly wages to the start of the pandemic to show that wages are higher than the cumulative rise in prices. Forget the make-up pay argument, it’s wrong.
Real wage gains in Canada shouldn’t be occurring. Not only are they exceeding cumulative inflation, labour productivity also remains terrible (chart 8). The combined effects of strong wage growth and falling labour productivity continue to represent inflationary pressure that the BoC is arguably misrepresenting.
...and a Strong Signal for Q2 GDP growth
Canadian hours worked flat in May over April in seasonally adjusted terms after they jumped 0.8% m/m higher in April over March. Updated tracking shows that hours worked are expanding by +2.8% q/q SAAR in Q2 after a 2.9% gain in Q1 (chart 9).
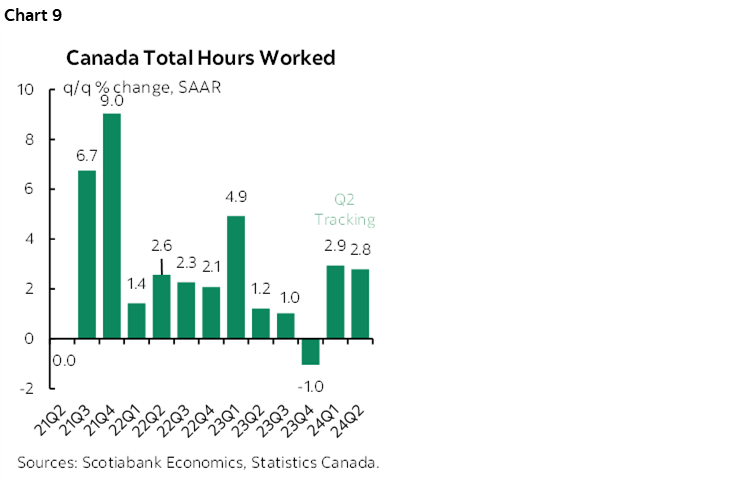
Since GDP is an identity defined as hours worked in aggregate times labour productivity defined as real GDP per hour worked, this continues to point to solid Q2 GDP growth. That, in turn, suggests that slack is not building in Canada and may be narrowing.
The BoC came in at the start of this year saying that peak pain for the economy would arrive in 2024H1. This is not peak pain folks. It’s disturbing that the BoC is willing to totally ignore resilience in the first half of 2024 that is going against their earlier bias while also cutting despite strong consumption growth of 3%+q/q SAAR in each of the past two quarters.
It’s still very early for tracking available Q2 data on the overall economy, but I believe the BoC is overestimating slack in the Canadian economy by a) discounting growth prospects, and b) providing questionable assumptions on potential GDP growth.
Another Population Surge
There was another 98k increase in population in Canada during May over April. Population is up by a whopping 1.1 million in May of this year over last May.
A Still Tight Labour Market
Of that 98k rise in population, the labour force expanded by 55k. Because it climbed by more than job growth in May, the unemployment rate edged up a tick as expected to 6.2%.
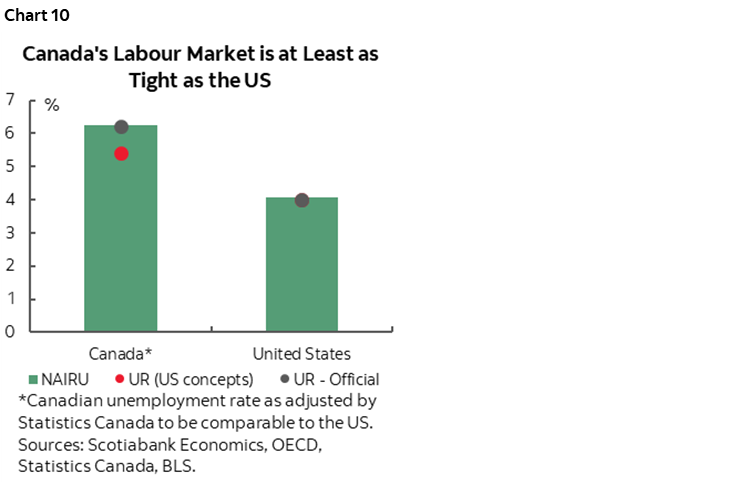
If Canada measured unemployment the same way as the US, then Canada's unemployment rate would be 5.4% now instead of the official number of 6.2%. The gap between the two is significantly driven by measurement differences including that Canada takes a more liberal approach to counting people in the workforce looking for work than the US does and starts counting potential workers at a slightly lower age.
So how tight is Canada’s labour market relative to the US? For starters, Canada has a higher NAIRU (basically full employment equilibrium rate of unemployment) than the US of 6.2% according to the OECD versus 4.1% in the US.
Ergo, on both counts combined (UR measurement differences and NAIRU differences) Canada's labour market may continue to be tighter than the US (chart 10). Canada's official UR is on NAIRU and so is the US, but Canada takes a more liberal approach to measuring the size of the labour force than the US.
This is an important issue in terms of relative central bank policy expectations as partly derived from the performances of their respective labour markets and especially in terms of the extent to which they can diverge.
Bank of Canada Implications
I think the market reaction in the US front-end relative to Canada roughly makes sense as the US cheapens more than Canada following both countries’ reports. The US numbers are strong all around. Canada's are decent but a little more mixed. The FOMC is not yet in play, while the Cdn curve is retaining premium driven by the BoC's reaction function.
On the BoC, expectations for a July cut haven't changed. Macklem delivered a much stronger than expected reaction function this past week by sounding totally indifferent to undercutting the Fed, dovish on inflation, and indifferent to how low Cad could sink. He is implying that there is a high bar against being knocked off another cut by data. Then again, we’ve learned not to take the Governor at his word as he has a tendency to be unreliable.
In any event, all the pertinent data risk is still ahead, namely two rounds of CPI before the July 24th decision. Those reports will matter much more to BoC pricing than today’s.
DISCLAIMER
This report has been prepared by Scotiabank Economics as a resource for the clients of Scotiabank. Opinions, estimates and projections contained herein are our own as of the date hereof and are subject to change without notice. The information and opinions contained herein have been compiled or arrived at from sources believed reliable but no representation or warranty, express or implied, is made as to their accuracy or completeness. Neither Scotiabank nor any of its officers, directors, partners, employees or affiliates accepts any liability whatsoever for any direct or consequential loss arising from any use of this report or its contents.
These reports are provided to you for informational purposes only. This report is not, and is not constructed as, an offer to sell or solicitation of any offer to buy any financial instrument, nor shall this report be construed as an opinion as to whether you should enter into any swap or trading strategy involving a swap or any other transaction. The information contained in this report is not intended to be, and does not constitute, a recommendation of a swap or trading strategy involving a swap within the meaning of U.S. Commodity Futures Trading Commission Regulation 23.434 and Appendix A thereto. This material is not intended to be individually tailored to your needs or characteristics and should not be viewed as a “call to action” or suggestion that you enter into a swap or trading strategy involving a swap or any other transaction. Scotiabank may engage in transactions in a manner inconsistent with the views discussed this report and may have positions, or be in the process of acquiring or disposing of positions, referred to in this report.
Scotiabank, its affiliates and any of their respective officers, directors and employees may from time to time take positions in currencies, act as managers, co-managers or underwriters of a public offering or act as principals or agents, deal in, own or act as market makers or advisors, brokers or commercial and/or investment bankers in relation to securities or related derivatives. As a result of these actions, Scotiabank may receive remuneration. All Scotiabank products and services are subject to the terms of applicable agreements and local regulations. Officers, directors and employees of Scotiabank and its affiliates may serve as directors of corporations.
Any securities discussed in this report may not be suitable for all investors. Scotiabank recommends that investors independently evaluate any issuer and security discussed in this report, and consult with any advisors they deem necessary prior to making any investment.
This report and all information, opinions and conclusions contained in it are protected by copyright. This information may not be reproduced without the prior express written consent of Scotiabank.
™ Trademark of The Bank of Nova Scotia. Used under license, where applicable.
Scotiabank, together with “Global Banking and Markets”, is a marketing name for the global corporate and investment banking and capital markets businesses of The Bank of Nova Scotia and certain of its affiliates in the countries where they operate, including; Scotiabank Europe plc; Scotiabank (Ireland) Designated Activity Company; Scotiabank Inverlat S.A., Institución de Banca Múltiple, Grupo Financiero Scotiabank Inverlat, Scotia Inverlat Casa de Bolsa, S.A. de C.V., Grupo Financiero Scotiabank Inverlat, Scotia Inverlat Derivados S.A. de C.V. – all members of the Scotiabank group and authorized users of the Scotiabank mark. The Bank of Nova Scotia is incorporated in Canada with limited liability and is authorised and regulated by the Office of the Superintendent of Financial Institutions Canada. The Bank of Nova Scotia is authorized by the UK Prudential Regulation Authority and is subject to regulation by the UK Financial Conduct Authority and limited regulation by the UK Prudential Regulation Authority. Details about the extent of The Bank of Nova Scotia's regulation by the UK Prudential Regulation Authority are available from us on request. Scotiabank Europe plc is authorized by the UK Prudential Regulation Authority and regulated by the UK Financial Conduct Authority and the UK Prudential Regulation Authority.
Scotiabank Inverlat, S.A., Scotia Inverlat Casa de Bolsa, S.A. de C.V, Grupo Financiero Scotiabank Inverlat, and Scotia Inverlat Derivados, S.A. de C.V., are each authorized and regulated by the Mexican financial authorities.
Not all products and services are offered in all jurisdictions. Services described are available in jurisdictions where permitted by law.