- Canada lost another 40k jobs…
- ...but the concentration in the education sector should be faded…
- ...while the BoC will be more concerned about further evidence of a wage-price spiral
- CDN jobs / UR, m/m 000s // %, SA, August:
- Actual: -39.7 / 5.4
- Scotia: 0 / 5.0
- Consensus: 15/ 5.0
- Prior: -30.6 / 4.9
I’m inclined to fade most of the loss of employment last month and place greater emphasis upon persistently strong wage gains that are exceeding the rate of inflation. In my view that’s how the Bank of Canada is likely to treat the report. For this reason, I don’t agree with the market reaction that drove short-term yields lower including a 9bps decline in the yield on 2-year GoC bonds and the Canadian dollar about half a penny weaker and would fade the reactions. See chart 1 for some initial highlights. Also remember that the high noise factor to this report indicates that jobs might have declined by anywhere from about –100k to a mild gain of under +20k based upon confidence intervals around the estimates.
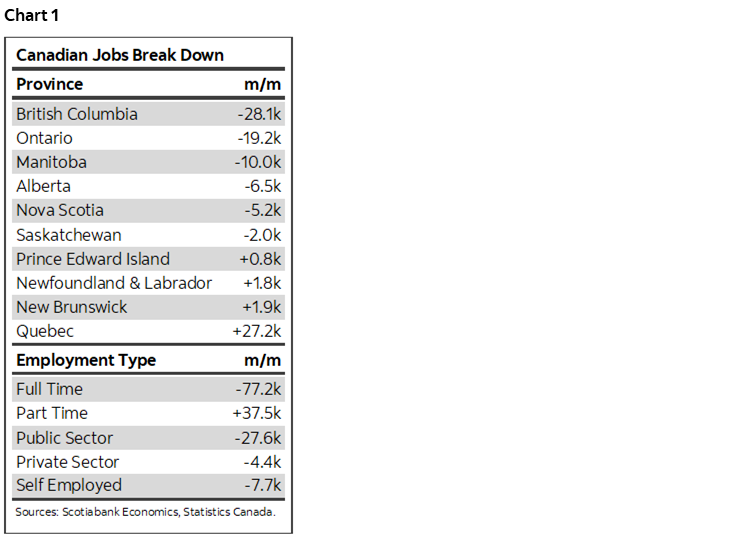
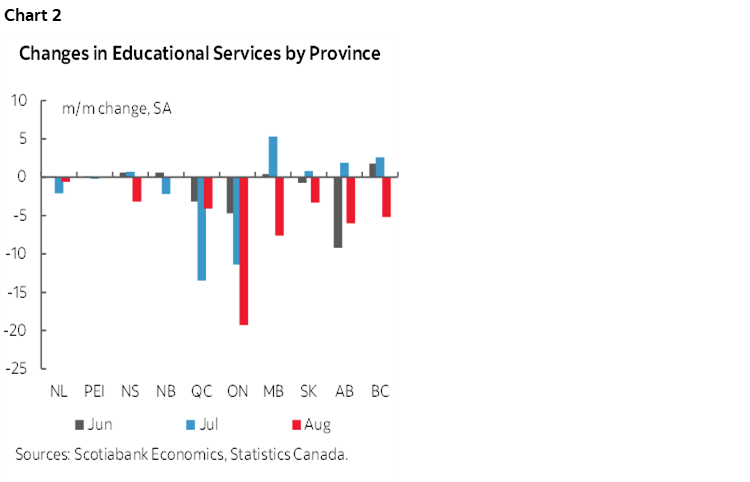
The quality of the data behind the job loss should be treated with care. That’s because the 40k drop in total employment was heavily driven by a 50k drop in education sector jobs. Where did all the teachers go?? Possibly nowhere other than back to school as it may just be a data distortion. That likely has something to do with messy contract negotiations and the staggered expiration of teacher contracts across the country. For instance, teacher contracts expired on June 30th in BC and Manitoba and August 31st in Ontario and Alberta as examples. Each of the biggest provinces saw declines (chart 2). Since it’s a household survey, we have to be careful toward the reliability of responses when teachers are asked whether they are presently employed as some might have said they did not have a contract so were not technically employed and, some might have had a soon-to-expire contract but responded they were essentially without one during the August reference week. It’s also possible that seasonal adjustments don’t adequately adjust for these issues over the years. Tisk tisk, teachers not necessarily knowing how to answer surveys…
The education sector drove the decline in overall public sector payroll employment that fell by about 28k. Private payroll employment fell by 4.4k which is not statistically meaningful. Self-employed jobs were down by about 8k. Thus, even after taking education out of the picture this would still not have been a great report, but better than the headline loss indicates.
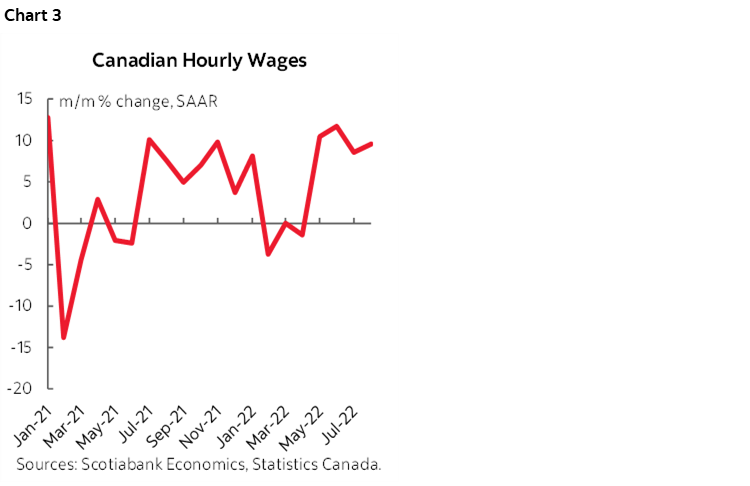
The strong wage figures, however, will fan concern at the Bank of Canada that wage-price spiral dynamics are being driven. Average hourly wages for permanent employees were up by 9.6% m/m at a seasonally adjusted and annualized rate. 9.6%! This measure has exploded over the past four months with gains of 10½% in May, nearly 12% in June, 8½% in July and 9½% in August. See chart 3. The trend has generally been strong for over a past year with a brief interruption during the period of initial omicron restrictions and reopening effects. The longer term trend in wage growth confirms the impression that the job market remains very tight. Add in poor productivity growth and the combination of the two is disconcerting if the aim is to get the cost of living under control.
That rate of growth in nominal wages is now exceeding inflation over this period such that real (inflation-adjusted) wages are rising. By this same measure, headline CPI was up by 3.2% m/m SAAR in July (August pending), 6.5% in June, and by 11–13% in each of March, April and May while core CPI (ex-food-and-energy) has been up by 6.1% in July, 5.2% in June, and 8–9% in March through May. This will complicate the Bank of Canada’s fight against inflation.
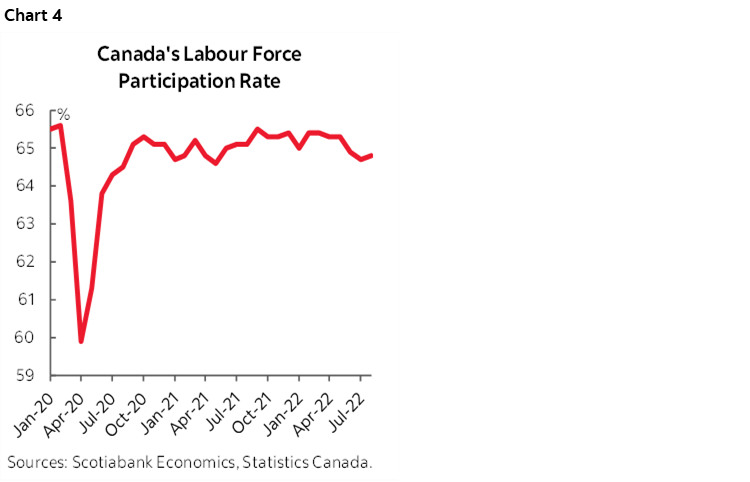
Hope lies in the fact that the labour force expanded by about 66k and when combined with the job loss drove the unemployment rate up a half point to 5.4%. This could be a positive if wage gains are pulling people off the sidelines back into the job market which could raise contestability and dampen wage gains. That’s a highly premature argument to make just yet since last month’s gain in the workforce followed an almost 130,000 decline in the size of the labour force over the prior two months. The participation rate reflects this (chart 4).
Hours worked are a further warning sign on GDP growth. They were flat in August which matters because GDP is an identity expressed as hours worked times labour productivity which itself is hardly Canada’s strong suit! On a quarterly annualized basis, growth in hours worked has been steadily slowing and that signals waning economic growth (chart 5).
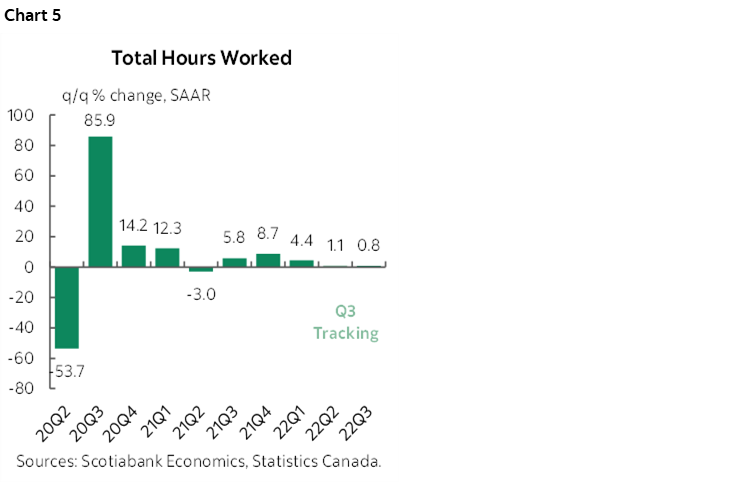
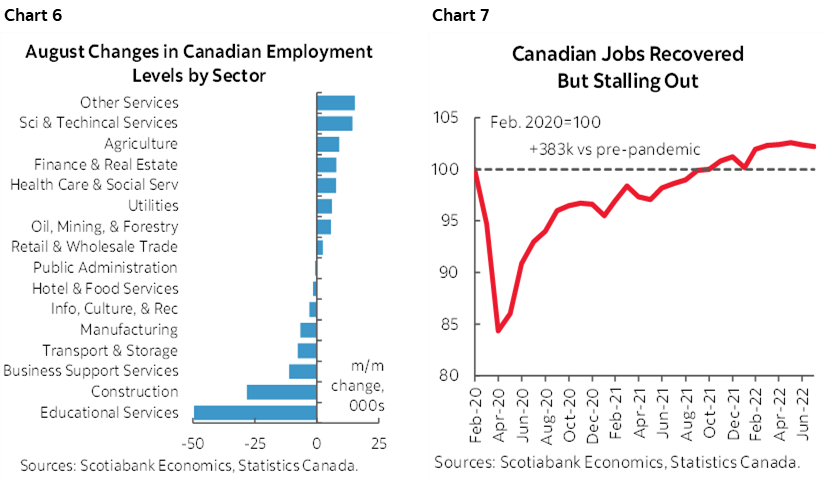
Chart 6 shows a breakdown of the change in employment during August by sector. Chart 7 shows that even with recent weakness, overall employment remains 383k higher than in February 2020 just before the pandemic’s effects were felt. The job market remains tight. If the teacher distortion shakes out in the next report or two—which depends upon the state of labour negotiations—then we could see this sector drive a rebound in employment. We should all hope that the two sides will come together and avoid further disruptions to in-person learning.
DISCLAIMER
This report has been prepared by Scotiabank Economics as a resource for the clients of Scotiabank. Opinions, estimates and projections contained herein are our own as of the date hereof and are subject to change without notice. The information and opinions contained herein have been compiled or arrived at from sources believed reliable but no representation or warranty, express or implied, is made as to their accuracy or completeness. Neither Scotiabank nor any of its officers, directors, partners, employees or affiliates accepts any liability whatsoever for any direct or consequential loss arising from any use of this report or its contents.
These reports are provided to you for informational purposes only. This report is not, and is not constructed as, an offer to sell or solicitation of any offer to buy any financial instrument, nor shall this report be construed as an opinion as to whether you should enter into any swap or trading strategy involving a swap or any other transaction. The information contained in this report is not intended to be, and does not constitute, a recommendation of a swap or trading strategy involving a swap within the meaning of U.S. Commodity Futures Trading Commission Regulation 23.434 and Appendix A thereto. This material is not intended to be individually tailored to your needs or characteristics and should not be viewed as a “call to action” or suggestion that you enter into a swap or trading strategy involving a swap or any other transaction. Scotiabank may engage in transactions in a manner inconsistent with the views discussed this report and may have positions, or be in the process of acquiring or disposing of positions, referred to in this report.
Scotiabank, its affiliates and any of their respective officers, directors and employees may from time to time take positions in currencies, act as managers, co-managers or underwriters of a public offering or act as principals or agents, deal in, own or act as market makers or advisors, brokers or commercial and/or investment bankers in relation to securities or related derivatives. As a result of these actions, Scotiabank may receive remuneration. All Scotiabank products and services are subject to the terms of applicable agreements and local regulations. Officers, directors and employees of Scotiabank and its affiliates may serve as directors of corporations.
Any securities discussed in this report may not be suitable for all investors. Scotiabank recommends that investors independently evaluate any issuer and security discussed in this report, and consult with any advisors they deem necessary prior to making any investment.
This report and all information, opinions and conclusions contained in it are protected by copyright. This information may not be reproduced without the prior express written consent of Scotiabank.
™ Trademark of The Bank of Nova Scotia. Used under license, where applicable.
Scotiabank, together with “Global Banking and Markets”, is a marketing name for the global corporate and investment banking and capital markets businesses of The Bank of Nova Scotia and certain of its affiliates in the countries where they operate, including; Scotiabank Europe plc; Scotiabank (Ireland) Designated Activity Company; Scotiabank Inverlat S.A., Institución de Banca Múltiple, Grupo Financiero Scotiabank Inverlat, Scotia Inverlat Casa de Bolsa, S.A. de C.V., Grupo Financiero Scotiabank Inverlat, Scotia Inverlat Derivados S.A. de C.V. – all members of the Scotiabank group and authorized users of the Scotiabank mark. The Bank of Nova Scotia is incorporated in Canada with limited liability and is authorised and regulated by the Office of the Superintendent of Financial Institutions Canada. The Bank of Nova Scotia is authorized by the UK Prudential Regulation Authority and is subject to regulation by the UK Financial Conduct Authority and limited regulation by the UK Prudential Regulation Authority. Details about the extent of The Bank of Nova Scotia's regulation by the UK Prudential Regulation Authority are available from us on request. Scotiabank Europe plc is authorized by the UK Prudential Regulation Authority and regulated by the UK Financial Conduct Authority and the UK Prudential Regulation Authority.
Scotiabank Inverlat, S.A., Scotia Inverlat Casa de Bolsa, S.A. de C.V, Grupo Financiero Scotiabank Inverlat, and Scotia Inverlat Derivados, S.A. de C.V., are each authorized and regulated by the Mexican financial authorities.
Not all products and services are offered in all jurisdictions. Services described are available in jurisdictions where permitted by law.