Next Week's Risk Dashboard
- Political risk is just getting started
- US Presidential debate could further inform polling
- Final polling before France’s first round election
- The last full week of UK election campaigning
- Iran’s faux election
- US core PCE could be very soft
- Canadian CPI may inform BoC July pricing…
- …with basket changes and housing’s rising effect
- Tracking Canadian GDP, and why it’s better under the hood
- BoC’s Macklem to speak about, well, everything!
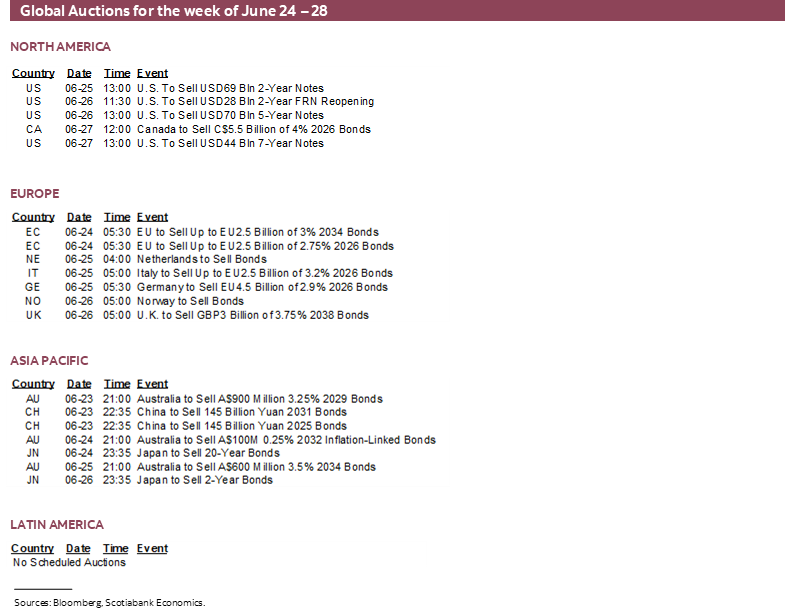
- Key US Treasury auctions return
- Eurozone CPI: One of two before July’s ECB
- Banxico expected to hold in the peso’s election aftermath
- BanRep expected to deliver another large cut despite COP softening
- Riksbank expected to stick to its script
- BSP: Still thinking about August?
- Turkey’s central bank likely to hold at a dizzying height
- CPI: Australia, Tokyo, Malaysia, Singapore
- Other global macro
Chart of the Week
This week may be a warm-up for what’s to come by way of the intersection between political and policy risk, and effects on markets, central banks and the economy. Data and events will begin to inform next moves by central banks in July and over the duration of the summer.
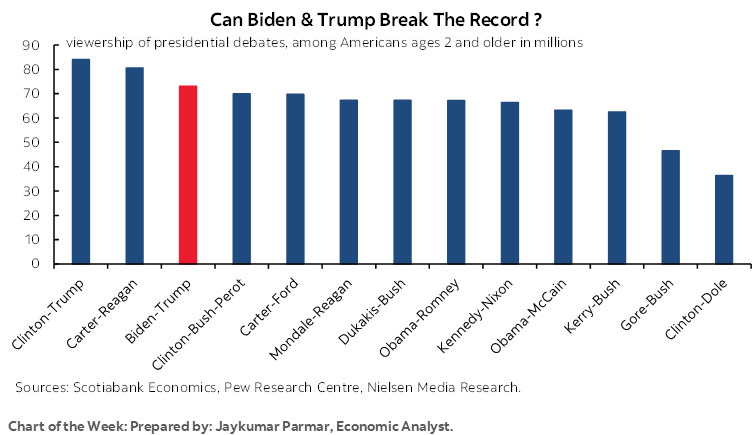
The sparring contestants might both need a nap in the middle of the first US Presidential debate that pundits remind us is often an uphill battle for the incumbent. This week’s cover chart shows the viewership numbers they have to beat.
Iran’s faux election is sure to bring more anti-western rhetoric with some potential risk to energy markets.
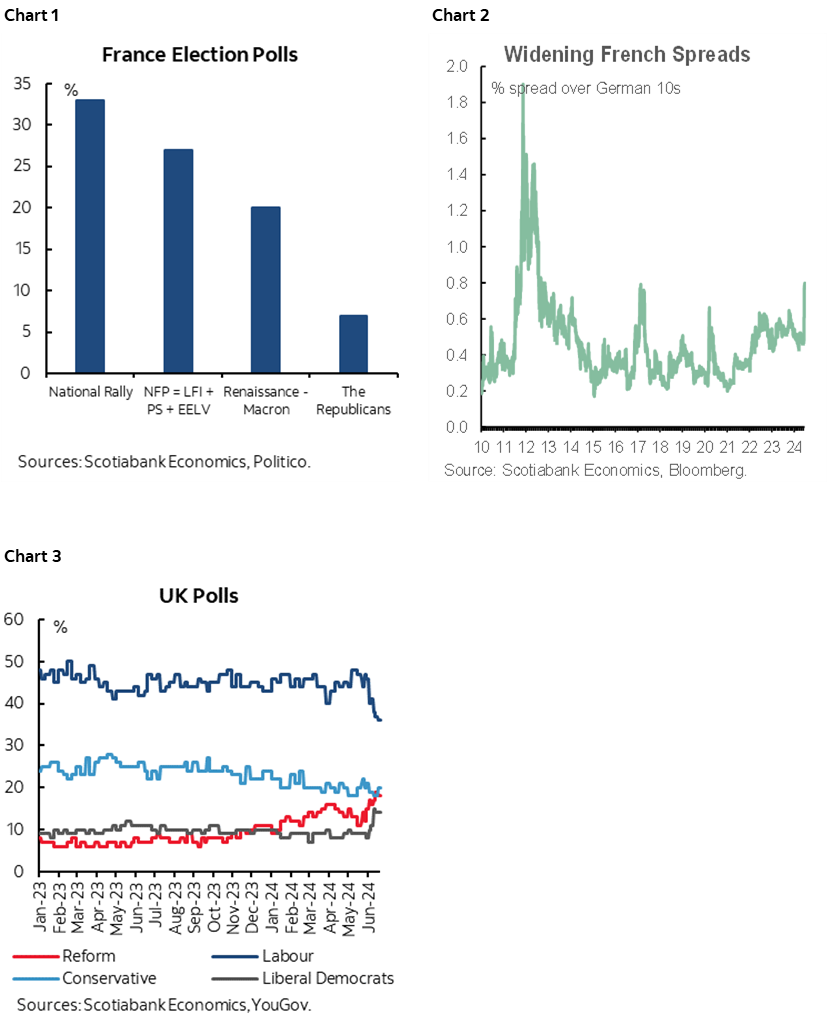
Final polling this week will segue into the Sunday June 30th French legislative election (chart 1) as French spreads over bunds added to the opportunity this week and are four times wider than in 2021 but a far cry from the crisis in 2012 to date (chart 2). The same is generally true of CDS default risk spreads that have widened a little but remain far below past crises. Last minute polling will also focus on the following week’s July 4th UK election that has Labour’s Starmer firmly in the lead but losing ground to Reform and the Liberal Democrats that is nevertheless splitting the conservative vote (chart 3). This FT piece for subscribers paints one unusual but entirely possible scenario for the UK election. Many Londoners are nevertheless more likely to be talking about Taylor Swift’s concerts this weekend.
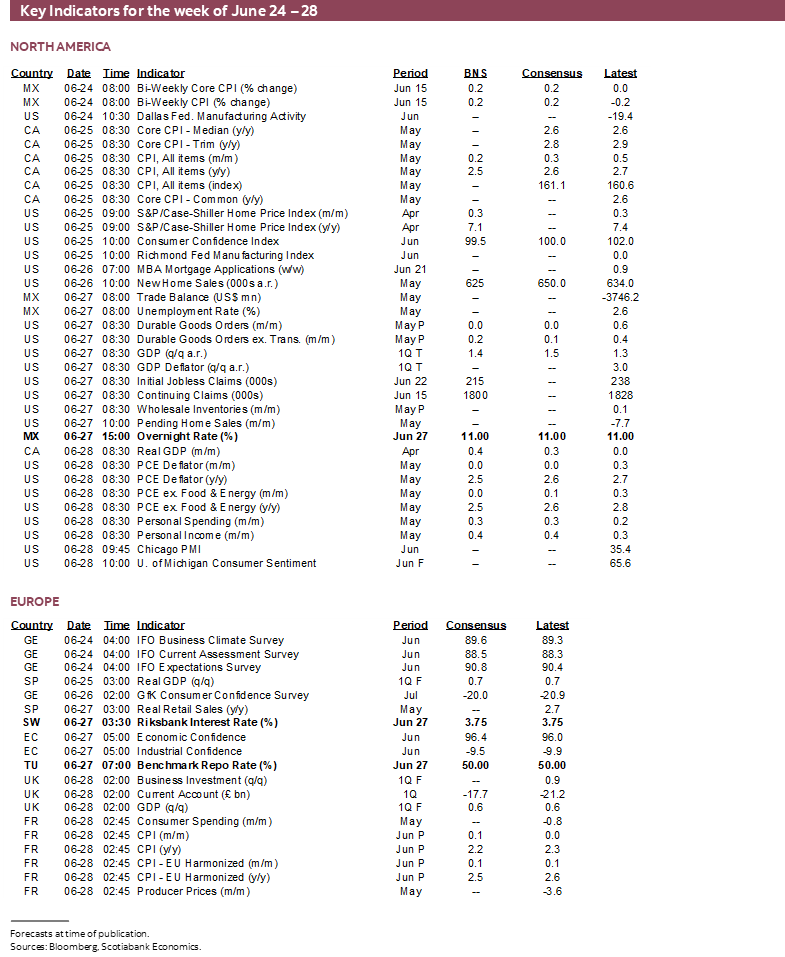
Most of the market attention, however, is likely to be upon several key macro updates and regional central bank decisions with many of our clients particularly focused upon a pair of Latin American decisions. US core PCE could further inform Fed sentiment, Canadian inflation could inform July BoC cut pricing, and the state of Canada’s economy will be updated.
US CORE PCE—HOW LOW CAN IT GO?
The most potentially impactful US release will be Friday’s core PCE estimate for May. The median consensus estimate is 0.1% m/m but it wouldn’t take much to drive a weaker reading.
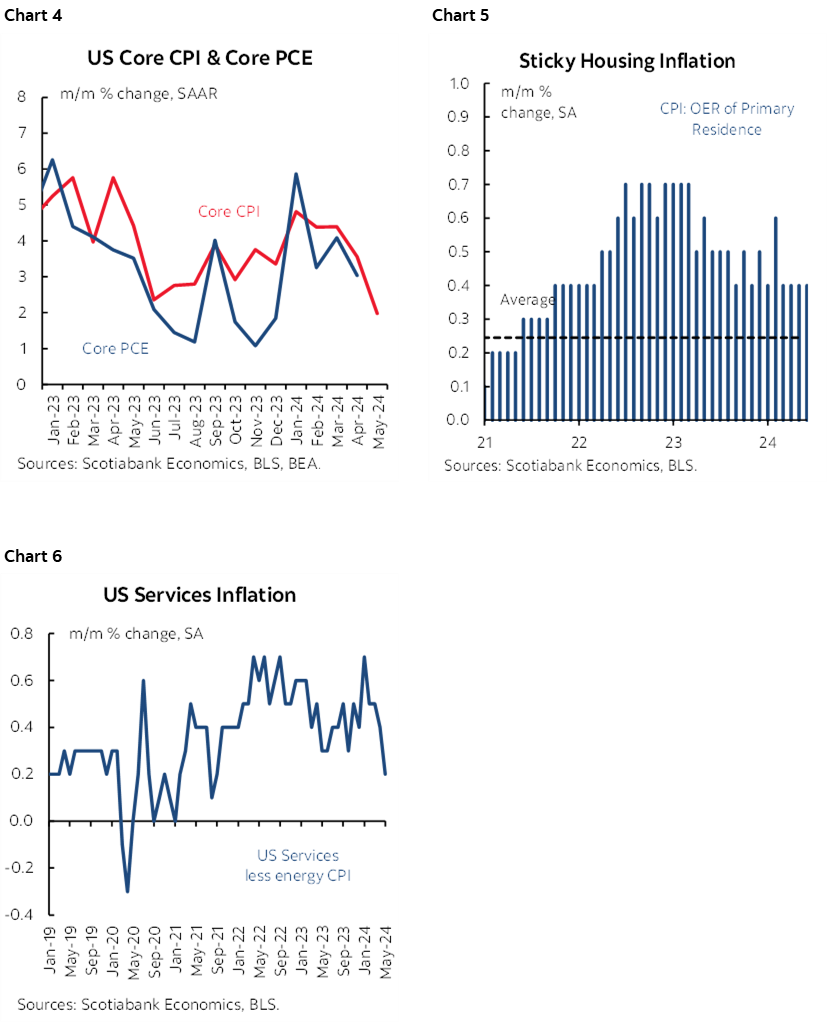
In fact, after core CPI landed at 0.16% m/m SA, core PCE could cough up a donut this time—or at least a very soft gain. Core PCE typically tracks beneath core CPI by varying degrees (chart 4) and because of differing methodologies. Core PCE’s much lower weight on shelter that was hot in CPI (chart 5) and its higher weight on core services inflation that tumbled in CPI (chart 6) could drive a downside surprise. There is therefore a plausible case for core PCE to undershoot core CPI by a wider margin this time.
If that happens, it’s just one reading for the Fed’s preferred core inflation gauge, but it would be welcomed by officials. If it is weak and if another soft print were to arrive for the month of June on July 26th then it could very well keep alive greater pricing for a potential Fed cut five days later or have the Committee more confident in terms of their bias toward the September 18th full meeting including another SEP with a freshened dot plot.
CANADIAN INFLATION—HOUSING’S RETURN, BASKET WEIGHT CHANGES & THE BOC
Canadian markets face double-barrelled action this week as CPI and GDP updates arrive. This will be one of two inflation reports before the next Bank of Canada decision on July 24th and the last GDP report before then.
Perhaps seeking to avoid awkward potentially questions in the aftermath, BoC Governor Macklem will speak on Monday—before the week’s data— about basically everything in a speech title that seems to lack focus but makes it clear that he’ll touch on a wide variety of topics. The title is ‘Workers, jobs, growth and inflation—Today and Tomorrow.” Text will be available at 1:30pmET and there will be a press conference at 3pmET.
CPI for May arrives on Tuesday. Annual revisions to basket weights may throw a bit of a wrench into the works.
I’ve estimated a rise of 0.2% m/m in seasonally unadjusted terms. Traditional core should be similar since gasoline and food prices are not expected to be material contributors. The year-over-year headline CPI rate should ebb from 2.7% to about 2½%.
The year-over-year rate is not the key, however, as it is being heavily influenced by year-ago base effects and energy prices. Gasoline prices will be a particular powerful drag in the next CPI report for June as prices are tracking a 1–2% y/y decline this month compared to 7–10% y/y gains just a few weeks ago. The roughly 4% weight on gasoline means that on its own, this gas price swing will drag CPI lower by over a quarter percentage point in year–over–year terms.
Key will be whether breadth retains improvement to date, or whether the forces that guided inflation lower over the first four months of this year have further legs. Those forces included political pressure on quasi-regulated prices for categories like telecommunications and groceries, and a warmer and drier than usual winter that depressed demand for categories like clothing and footwear and travel.
Credible estimates for trimmed mean and weighted median CPI—the BoC’s preferred gauges—are impossible to estimate in m/m SA terms given the absent of the necessary data for dozens of CPI basket components.
Shelter CPI is Facing Growing Upside Risk
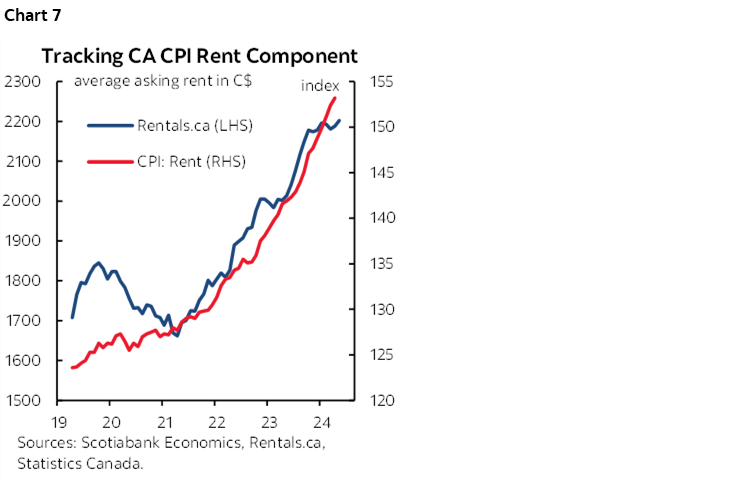
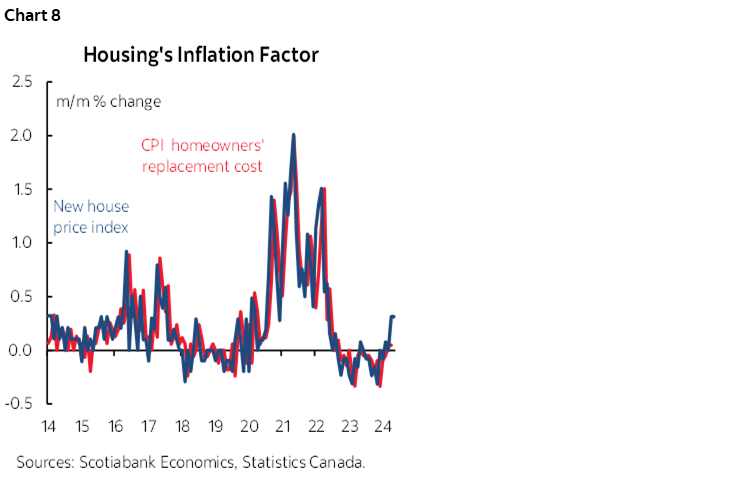
One upside risk is starting to look like house prices in addition to the pressures on shelter CPI that are coming from soaring rent (chart 7). Shelter ex-mortgage interest is about one-quarter of the CPI basket in Canada and therefore an inflation targeting central bank ignores it at its own peril. Recall that Canada captures housing in CPI using the replacement cost of housing and new builder prices (house only) are used to determine that. A full comparison of the different ways of capturing shelter in CPI and why Statistics Canada takes this approach is available here. Canada’s treatment stands in contrast to the use of owners’ equivalent rent by the BLS in the US.
Statcan’s release of builder prices for May was up by another 3.8% m/m SAAR in May, matching April's rise. Those are the strongest back-to-back monthly gains since June 2022. At about a 5% weight in the CPI basket, this is about 0.2 ppts to m/m SAAR inflation.
That’s small for now, but not inconsequential and it is likely to rise further, given my thesis that builders have all the pricing power in the world now. There are severe housing shortages. Immigration is excessive in relation to these shortages and requires an expansion of the housing stock (ie: building more homes, not just resale paper swaps). Demand stimulus is being skewed toward builders by Ottawa's announcements to provide new build subsidies plus other pending changes like when 30-year insured mortgages for newly built homes become available in August given changes in the recent Federal budget.
The incidence effects of combined supply and demand drivers are giving builders a boost in their pricing power. That should have been expected, but it's an unintended consequence to policymakers and one that, if it continues, may draw their ire.
In addition to the evidence at the margin (ie: m/m), the y/y measure is slowly turning. Builder prices have bottomed and now the question is how rapidly they rise going forward (chart 8).
Updated Basket Weights Could Lift Inflation
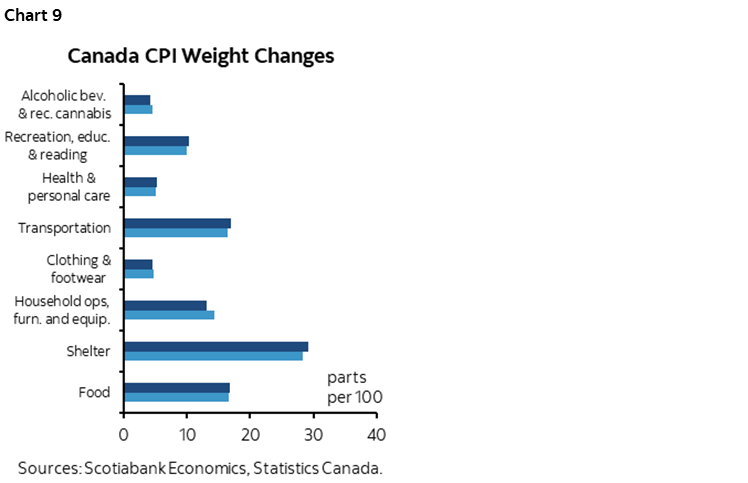
With this report, Statcan will update CPI basket weights to reflect the composition of the spending basket in 2023 instead of 2022. This is a regular exercise ever since Statcan changed to annual updates of basket weights in 2022 compared to every three years in 2020, every two until 2017 and every four years until 2009. With the exception of the step backward at the start of the pandemic, the aim to more frequently reassessing the weights is to reduce measurement bias in CPI that was due to using weights that reflected consumption patterns from years ago.
Chart 9 shows the revised weights by main category and more detail is available here. Prior months do not get revised, but we can give an idea of how the revisions could affect estimates.
If April CPI had been calculated using the revised weights, then y/y headline CPI would have been 2.8% y/y instead of 2.7% as initially reported (chart 10). Traditional core CPI (ex-food and energy) would have been 2.8% instead of 2.6%. We estimate that headline and core would have been unaffected in m/m terms. It’s unclear how trimmed mean and weighted median may have been affected.
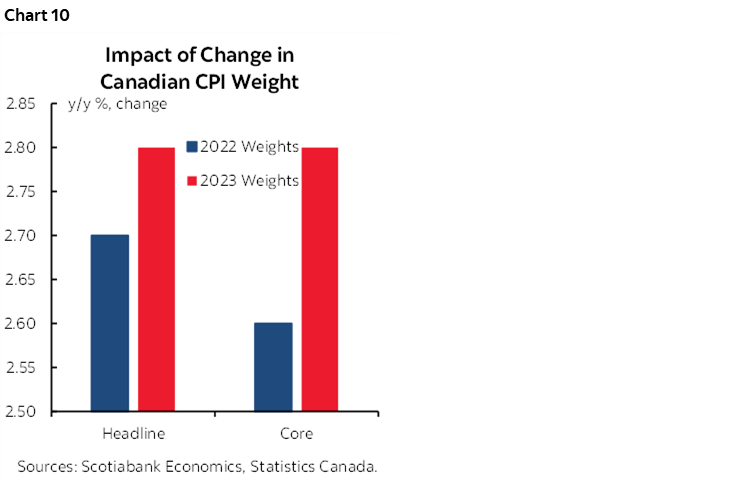
April will not be revised. The only purpose to these calculations is to show the effect of weight changes assuming the same detailed data on prices. That said, since the weight changes get incorporated in the May data, we could see an upward bias in the y/y calculations through this effect independent of others.
CPI’s Impact on the July BoC Decision
This week’s update won’t make or break a call for another 25bps rate cut at the BoC’s meeting on July 24th. The BoC has decided to put a lot of stock in the prior four months of soft core inflation figures after watching inflation’s rise over the prior four years. This week’s tally is one of two updates before the July decision with the next one out on July 16th for June CPI. Barring back-to-back upside surprises to them and backed by firm details they are likely to continue easing. A soft report now would probably downplay the importance of the next inflation update on a trend basis.
CANADIAN GDP—NEEDLESSLY TALKING DOWN THE ECONOMY AND CONSUMER
The state of Canada’s economy will be updated when monthly GDP for April and May arrive on Friday. April should post solid growth, but May is an open question.
Statcan had guided on May 31st that April GDP was tracking an estimated 0.3% m/m seasonally adjusted gain. I’ve estimated a similar rise of 0.4% m/m SA based on a combination of standard macroeconomic indicators skewed toward the goods side of the economy and alt-data tracking for the services side of the economy. Statcan guidance for April on May 31st indicated that growth was driven by “increases in manufacturing, mining, quarrying, and oil and gas extraction and wholesale trade,” and these gains were partially offset by utilities.
May GDP is much more uncertain but limited evidence thus far suggests that little growth may be posted. Hours worked were flat which matters since GDP is an identity defined as hours times labour productivity. Housing starts jumped 10% m/m higher, but entirely due to volatile multiples as single-family detached housing starts were flat.
If these estimates are close to reality, then Q2 GDP growth could be tracking around 2% q/q SAAR.
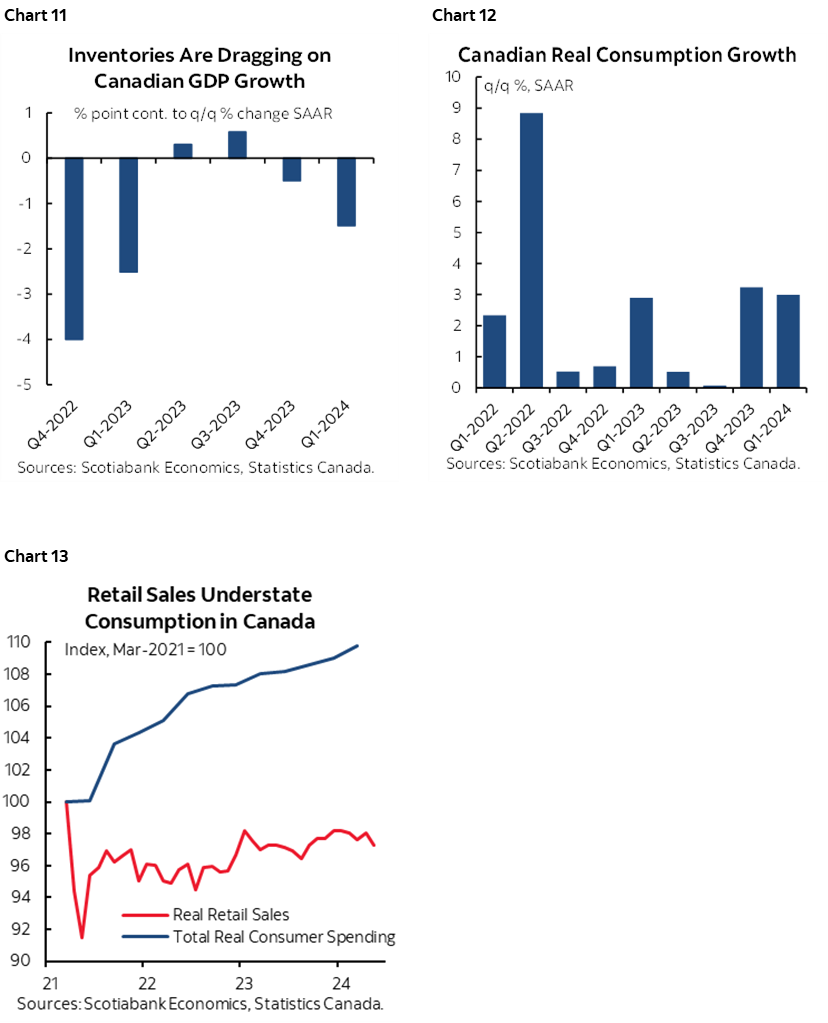
The Canadian economy is stronger under the hood than the GDP numbers suggest. I maintain that view that stands in contrast to how the BoC views things. Q1 GDP growth of 1.7% q/q SAAR lost 1½ percentage points due to inventory drag that has plagued the readings about the past six quarters (chart 11), while consumer spending was up by 3% q/q SAAR in volume terms for each of the latest two quarters (chart 12). Chart 13 shows that measures like retail sales—that in Canada exclude all services—understate the strength of the consumer. Last year’s GDP softness was partly about tighter monetary policy, but also messed up by wildfires and strikes that resulted in a large loss of hours worked and associated production.
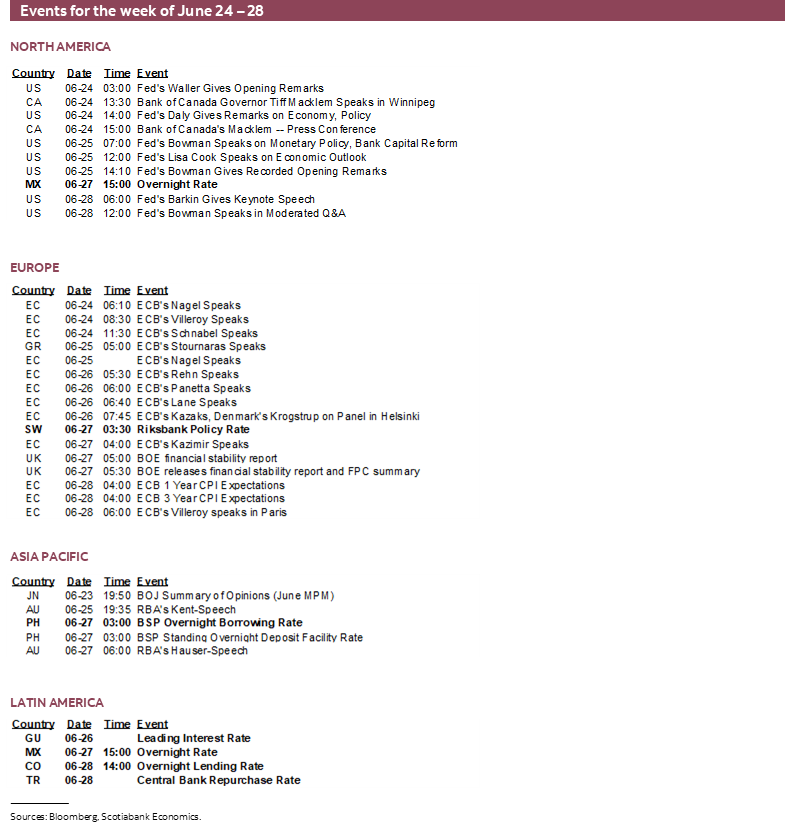
CENTRAL BANKS—FIVE REGIONALS TO WEIGH IN
Five regional central banks weigh in with decisions this week including two in the heartland of Scotiabank’s client footprint.
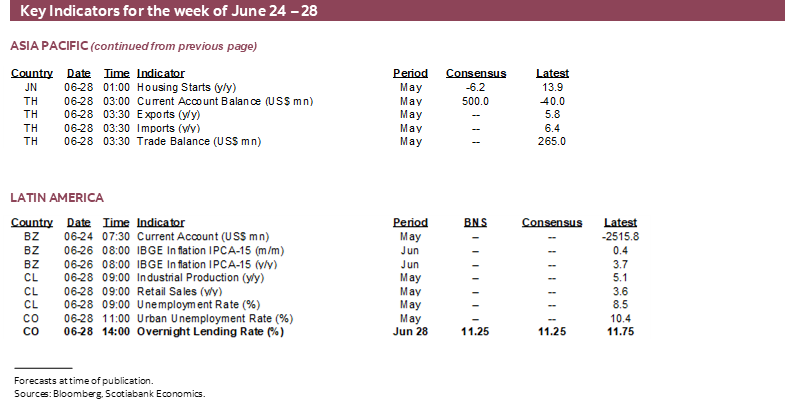
Banxico—Election Aftermath Limits Flexibility
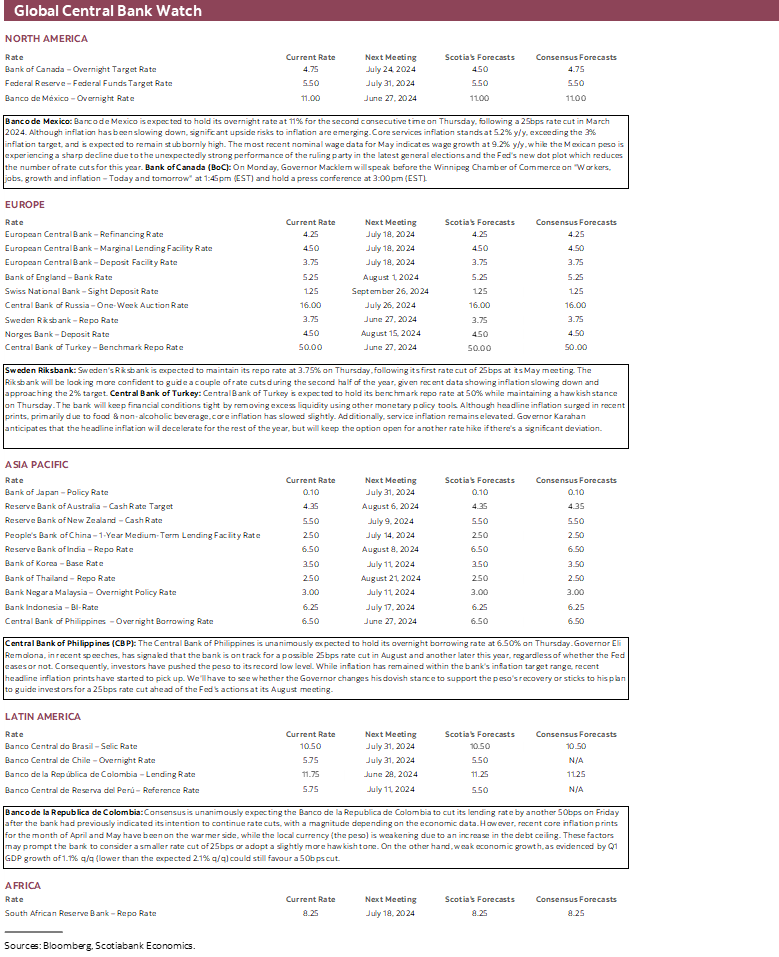
Mexico’s central bank delivers another policy decision on Thursday afternoon. While every meeting is ‘live,’ Banxico is expected to hold its overnight rate at 11% again for the second consecutive meeting after it delivered a 25bps cut in March, beating the BoC in North America.
The nearly 10% slide in the peso’s value to the USD since May 17th and including the aftermath of the general election on June 2nd merits caution in terms of pass through risk into inflation. Governor Victoria Rodriguez indicated that this risk should be evaluated “with caution” which doesn’t sound like a central banker on the verge of further easing.
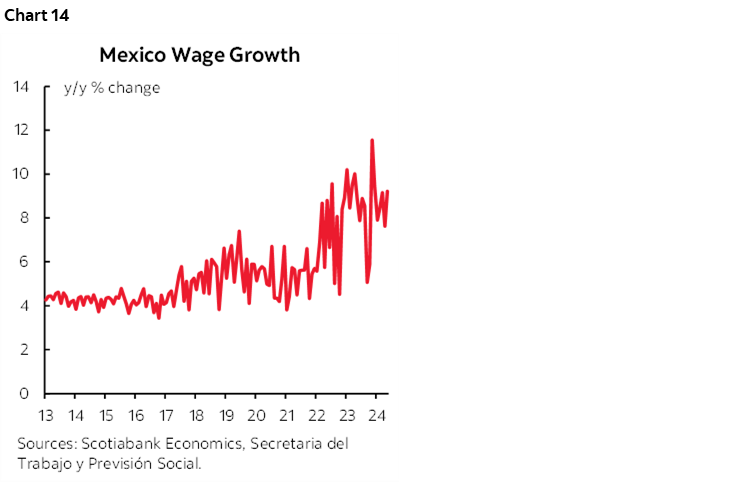
Furthermore, nominal wage growth has since accelerated further to over 9% y/y (chart 14). The stubborn persistence of strong wage gains since 2022 is a complicating risk facing the ability to get inflation down from 4.7% y/y (4.2% core) to Banxico’s 3% +/- 1% inflation target.
BanRep—Peso Pitfalls
Colombia’s central bank gets the final word for the week when it weighs in on Friday at 2pmET. BanRep has already cut by 150bps after starting from the dizzying height of 13.25% last December. Another 50bps cut is expected this week along with data dependent guidance on the size of future easing steps.
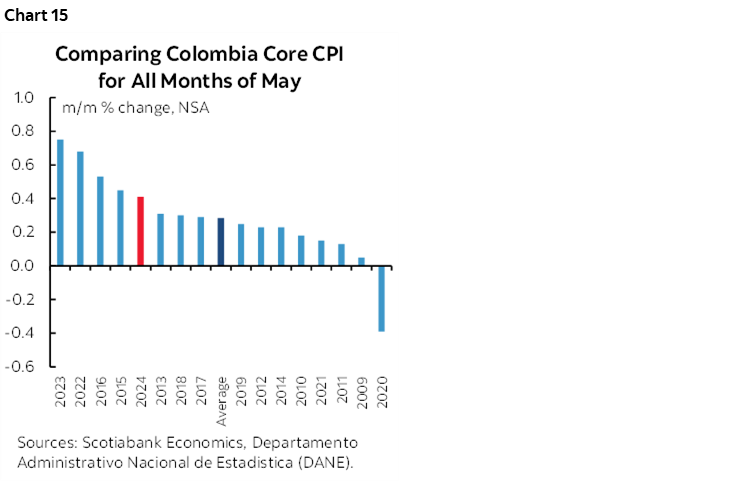
Since the last 50bps cut on April 30th, core inflation has fallen from 8¾% y/y to 7.8% and remains on a downward trajectory from a peak of 11.6% last year. Core inflation at the margin has nevertheless been a bit warmer than typical like months in history (eg. chart 15) while Q1 GDP growth disappointed expectations (1.1% q/q, consensus 2.1%).
If anything leans against either the size of this week’s cut or forward guidance, then the nearly 10% depreciation in the COP since early April could do it by way of imported inflation risk. Part of this currency depreciation has been externally driven by dollar strength against numerous LatAm pairs, but some of it has also been due to an increase in Peru’s debt ceiling that raises perceptions toward country risk.
Riksbank—Still Three for the Year?
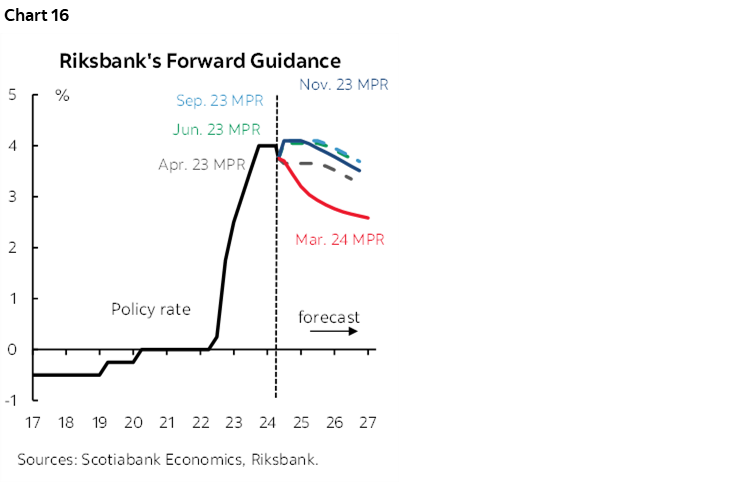
Sweden’s central bank is expected to hold its policy rate unchanged at 3.75% on Thursday. The Riksbank cut its policy rate by 25bps back on May 8th and said at the time that the policy rate may be reduced twice more in 2024, but in the back half as a nod to probably holding at this meeting.
Fresh forecasts will be offered this week and with that will be updated explicit forward rate guidance (chart 16). Data since the May meeting has supported a pause this week. It has included an uptick in underlying inflation excluding energy to 3% y/y, although partly and temporarily driven by Taylor Swift concert ticket prices. The economy also beat expectations by posting growth of 0.7% q/q in Q1, although April GDP was weak at -0.7% m/m.
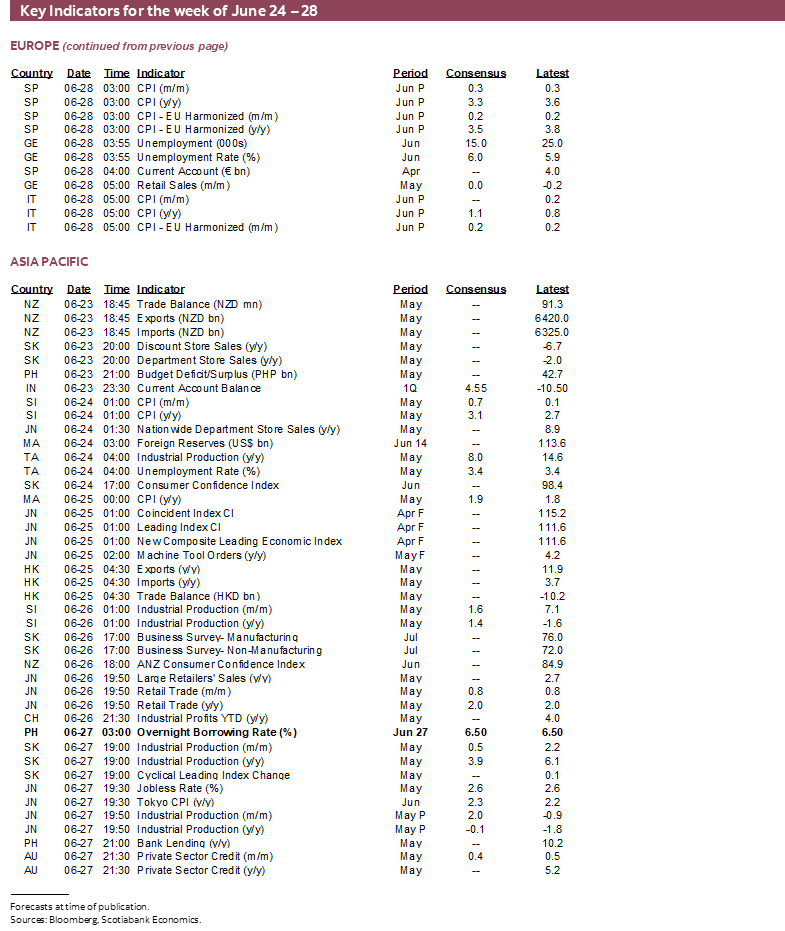
Philippines Central Bank—Getting Closer to H2 Cuts?
Bangko Sentral ng Pilipinas is expected to hold its overnight rate at 6.5% on Thursday. Governor Eli Remolona had guided on May 16th following another hold decision that BSP could cut by 25bps as soon as the August meeting and by another 25bps before year-end. Since then, the peso has depreciated by over 2% to the dollar and has been among Asia’s weaker currency crosses.
Central Bank of Turkey—Still Hawkish
The Central Bank of Turkey is expected to hold its 1-week repo rate unchanged at 50% on Thursday. The bias is likely to remain hawkish with inflation still running at 75% y/y and upside risks such as renewed depreciation of the lira this month.
GLOBAL MACRO—POLITICS AND DATA CONTINUE TO INTERSECT
Politics and data will make up the rest of the week’s line-up.
Politics—US Debate, Iran’s Farcical Election
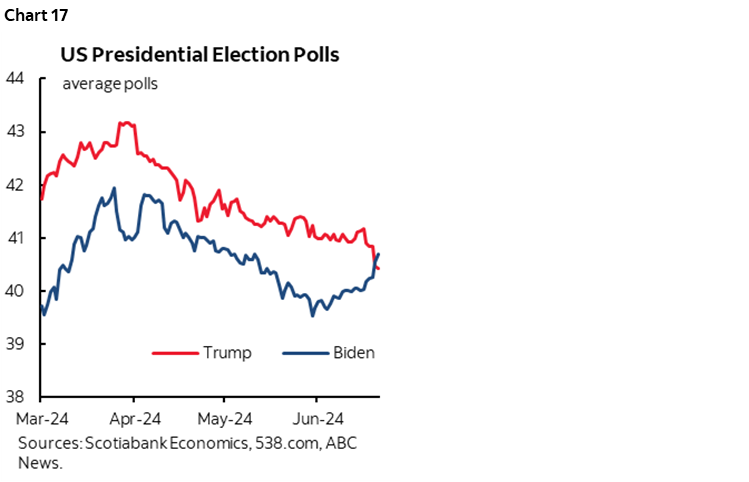
The first of the US presidential debates will occur on Thursday at 9pmET on CNN. The rule changes for this debate are significant including commercial breaks (for naps…), muted mics, no audience and no opening monologues (here). Relative performances could impact polling in the immediate aftermath with Trump still predicted to win by betting sites but slipping to an almost dead heat in polls (chart 17). Pundits often remind us that the first debate is often a setback for the incumbent. Of course, the only poll that really matters is the one that follows the outcome of the November 5th election and it’s the Electoral College that will determine things. Trump lost the popular vote in 2016 but won the presidency, and then lost to Biden in 2020 on both counts and his party underperformed in the 2022 mid-terms.
Iran’s Presidential ‘election’ will be held the day after. Don’t expect a sea change of Iran’s attitudes to the west. The candidates are rigged, with five conservatives and one reformer that stands little to no chance. Of course, there are no opinion polls where the media takes its marching orders from the regime. In any event, Ayatollah Ali Khamenei is the supreme leader who holds true power.
Eurozone Inflation to Inform the ECB’s July Decision
Eurozone markets will focus upon a round of inflation figures. There will be two Eurozone CPI prints due before the July 18th ECB decision. France, Italy and Spain update CPI for June on Friday. Germany is not due out until July 1st and the Eurozone tally will be released on July 2nd by which point the country-level figures will leave little residual intrigue.
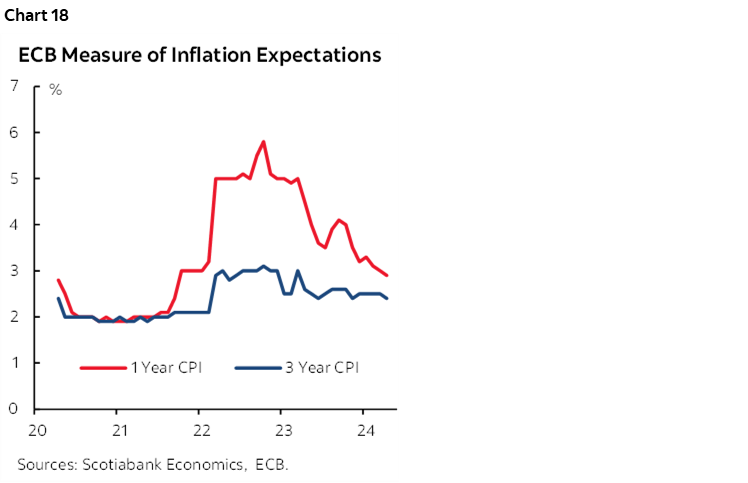
Also on Friday will be the ECB’s latest 1- and 3-year measures of inflation expectations. April’s figures were riding in the 2½% to 3% zone. Further progress would be welcomed by the ECB as a continuation of the trend (chart 18). This is the last measure of expectations before the July ECB decision.
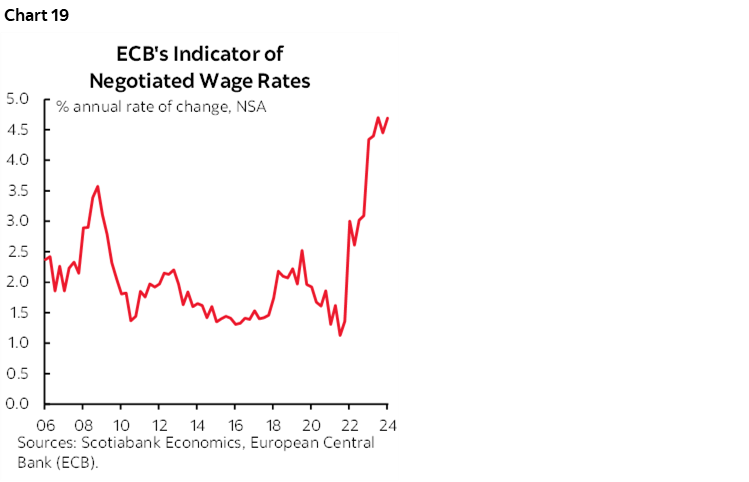
At present, markets are pricing little to no chance of a cut at the July 18th meeting. One thing that officials emphasize is a desire to see Q3 figures for Euro Area negotiated wage rates on August 22nd. ECB officials had hoped to see softer Q1 wage figures before deciding to cut at the June meeting anyway, but another strong reading could be too much for the more hawkish-minded officials (chart 19).
Some, like Governing Council Member Klaas Knot, think that there is a “strong case” for making policy rate decisions only once per quarter when new forecasts are delivered. That probably won’t resonate with other members who would prefer greater flexibility.
Other than data, political developments are also on the ECB’s collective mind as President Lagarde reserved her assessment to date by saying they are “attentive” to the developments.
US—Beyond Core PCE
The most potentially impactful US release will be Friday’s core PCE estimate for May but there will be several other potentially impactful releases.
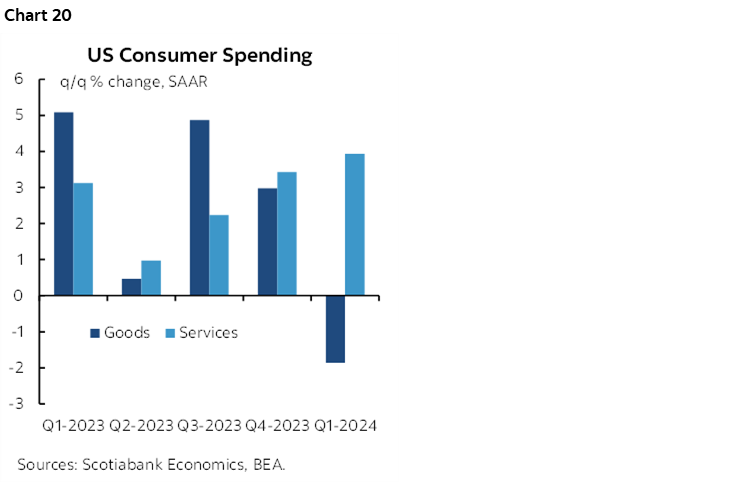
That same day will bring out estimates for consumer spending and incomes in May. Retail sales and a likely assist from services are expected to support another modest gain in consumption but with little change in volumes. Trend growth in US consumer spending remains healthy (chart 20) but slanted more toward less interest-sensitive services than goods and the latter’s performance gets more coverage through reports like retail sales.
Consumer confidence (Tuesday), new home sales (Wednesday), the third estimate for Q1 GDP growth of 1.3% q/q SAAR (Thursday), durable goods orders for May (Thursday) and pending home sales for May (Thursday) are also on tap. US housing data has been soft over recent months in lagging reaction to the prior surge in mortgage rates that has since abated somewhat.
The US also brings out renewed auction risk with 2s on Tuesday, 2 year FRNs on Wednesday, 5s on Wednesday and 7s on Thursday. The return of significant auctions follows a relatively lighter schedule this past week that only brought out 20s and 5-year TIPS.
Asia-Pacific Markets Will Focus on Inflation
Four countries update CPI figures for May.
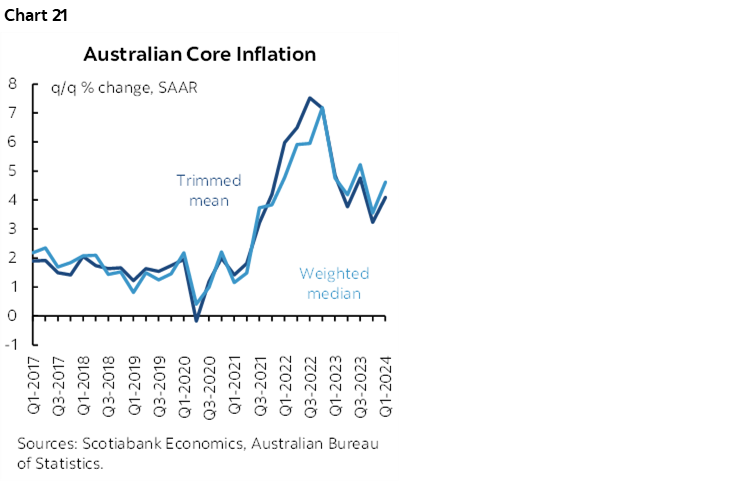
Australia’s CPI figures for May (Tuesday) will be a warm-up to the Q2 figures that are due on July 30th and just before the next RBA decision on August 6th. RBA Governor Bullock placed high emphasis upon the Q2 figures this past week when she revealed that the Board discussed a possible hike and there was no discussion of a cut. Some improvement in inflation data was flagged, but that it was proving to be persistent. The preferred trimmed mean and weighted median measures remain uncomfortably high (chart 21).
The next Bank of Japan policy decision arrives on July 31st and there will be two rounds of the freshest inflation figures for Tokyo available by then. The first round for June arrives on Thursday night (ET as always). Core Tokyo CPI inflation remains very weak in m/m SAAR terms. Singapore (Monday) and Malaysia (Tuesday) will also update CPI figures.
DISCLAIMER
This report has been prepared by Scotiabank Economics as a resource for the clients of Scotiabank. Opinions, estimates and projections contained herein are our own as of the date hereof and are subject to change without notice. The information and opinions contained herein have been compiled or arrived at from sources believed reliable but no representation or warranty, express or implied, is made as to their accuracy or completeness. Neither Scotiabank nor any of its officers, directors, partners, employees or affiliates accepts any liability whatsoever for any direct or consequential loss arising from any use of this report or its contents.
These reports are provided to you for informational purposes only. This report is not, and is not constructed as, an offer to sell or solicitation of any offer to buy any financial instrument, nor shall this report be construed as an opinion as to whether you should enter into any swap or trading strategy involving a swap or any other transaction. The information contained in this report is not intended to be, and does not constitute, a recommendation of a swap or trading strategy involving a swap within the meaning of U.S. Commodity Futures Trading Commission Regulation 23.434 and Appendix A thereto. This material is not intended to be individually tailored to your needs or characteristics and should not be viewed as a “call to action” or suggestion that you enter into a swap or trading strategy involving a swap or any other transaction. Scotiabank may engage in transactions in a manner inconsistent with the views discussed this report and may have positions, or be in the process of acquiring or disposing of positions, referred to in this report.
Scotiabank, its affiliates and any of their respective officers, directors and employees may from time to time take positions in currencies, act as managers, co-managers or underwriters of a public offering or act as principals or agents, deal in, own or act as market makers or advisors, brokers or commercial and/or investment bankers in relation to securities or related derivatives. As a result of these actions, Scotiabank may receive remuneration. All Scotiabank products and services are subject to the terms of applicable agreements and local regulations. Officers, directors and employees of Scotiabank and its affiliates may serve as directors of corporations.
Any securities discussed in this report may not be suitable for all investors. Scotiabank recommends that investors independently evaluate any issuer and security discussed in this report, and consult with any advisors they deem necessary prior to making any investment.
This report and all information, opinions and conclusions contained in it are protected by copyright. This information may not be reproduced without the prior express written consent of Scotiabank.
™ Trademark of The Bank of Nova Scotia. Used under license, where applicable.
Scotiabank, together with “Global Banking and Markets”, is a marketing name for the global corporate and investment banking and capital markets businesses of The Bank of Nova Scotia and certain of its affiliates in the countries where they operate, including; Scotiabank Europe plc; Scotiabank (Ireland) Designated Activity Company; Scotiabank Inverlat S.A., Institución de Banca Múltiple, Grupo Financiero Scotiabank Inverlat, Scotia Inverlat Casa de Bolsa, S.A. de C.V., Grupo Financiero Scotiabank Inverlat, Scotia Inverlat Derivados S.A. de C.V. – all members of the Scotiabank group and authorized users of the Scotiabank mark. The Bank of Nova Scotia is incorporated in Canada with limited liability and is authorised and regulated by the Office of the Superintendent of Financial Institutions Canada. The Bank of Nova Scotia is authorized by the UK Prudential Regulation Authority and is subject to regulation by the UK Financial Conduct Authority and limited regulation by the UK Prudential Regulation Authority. Details about the extent of The Bank of Nova Scotia's regulation by the UK Prudential Regulation Authority are available from us on request. Scotiabank Europe plc is authorized by the UK Prudential Regulation Authority and regulated by the UK Financial Conduct Authority and the UK Prudential Regulation Authority.
Scotiabank Inverlat, S.A., Scotia Inverlat Casa de Bolsa, S.A. de C.V, Grupo Financiero Scotiabank Inverlat, and Scotia Inverlat Derivados, S.A. de C.V., are each authorized and regulated by the Mexican financial authorities.
Not all products and services are offered in all jurisdictions. Services described are available in jurisdictions where permitted by law.