
Next Week's Risk Dashboard
- Ranking the Presidents on the economy and markets
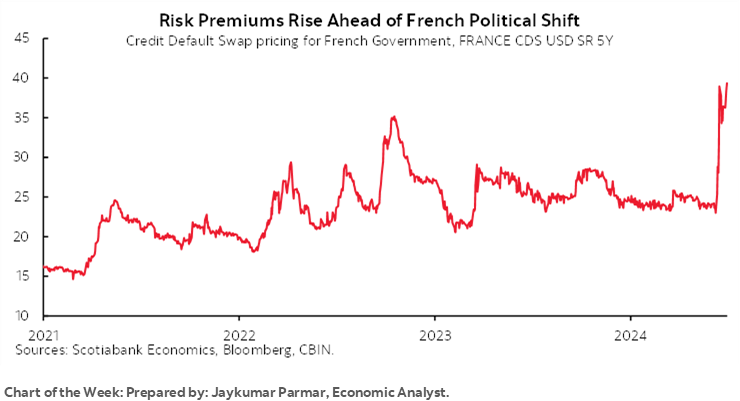
- EGBs may be on edge after French election
- UK election expected to return Labour to power
- US nonfarm payrolls still resilient?
- ECB’s Sintra often drives euro volatility
- Canada’s job market and the BoC’s exaggerated narrative
- Canadian, US holidays
- The last Eurozone core CPI print before the ECB’s July decision
- Global inflation readings dominate the rest
Chart of the Week
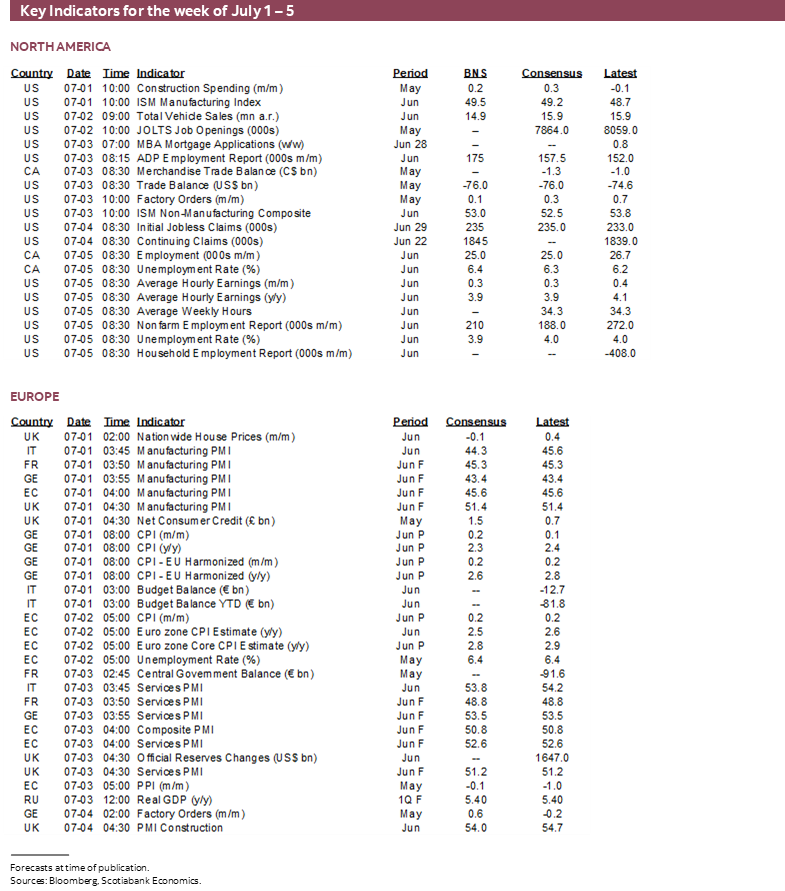
The best gift that an economist can offer Canadians and Americans as they celebrate their birthdays is no central bank decisions this coming week. Canada Day on Monday and US Independence Day on Thursday including Wednesday’s early US market closes in bonds and equities could set a number of folks out on extended summer holidays but with several key macro developments to consider.
Political risk is clearly intensifying as will be showcased by European elections this week. Key macro developments will include Eurozone and German CPI, US nonfarm payrolls, Canadian jobs, FOMC minutes, and the ECB’s annual Sintra retreat that showcases a key debate at the ECB and with Powell also appearing.
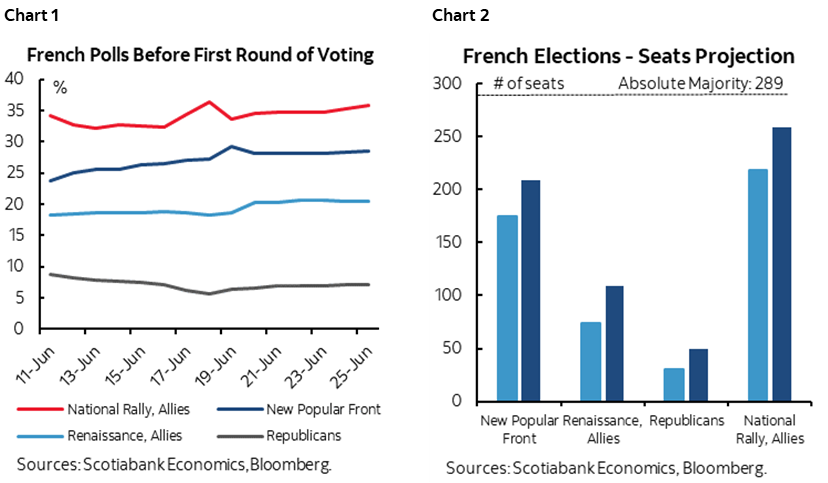
Round 1 of France’s legislative assembly elections is on Sunday. Fresh polling is shown in chart 1. Round two will be one week later. Polls are showing that an outright majority by National Rally (formerly National Front) and its allies is within reach at the conclusion of the rounds. A fresh poll by Elabe indicates that National Rally et al could win between 260–295 seats; 289 are required to win a majority in the 577 seat National Assembly (chart 2). A strong showing and hint toward an outright majority could put markets on edge to start the week with EGBs selling off, French bond spreads over bunds widening, and potential spillover effects abroad. National Rally is trying to convince voters that it’s fundamentally different from the party Jean-Marie Le Pen founded and led from 1972 to 2011. His daughter, Marine, and 29-year-old National Rally President Jordan Bardella are seeking to convince voters they are not as friendly toward Putin as they were, not quite as opposed to close ties with the rest of Europe as in the past, and that they are not the same fiscal expansionists. Markets are skeptical, which is why EGBs and particularly French bonds have been selling off. One constant appears to be divisive bigotry.
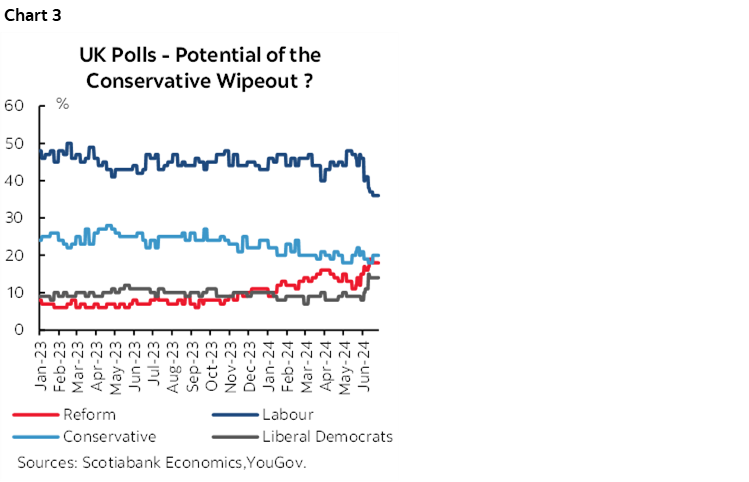
Thursday’s UK election is somewhat less of a mystery. PM Sunak’s Conservatives seemed destined to lose badly and not even the PM’s seat is safe. The BBC’s interactive poll tracker (here) shows Keir Starmer’s Labour Party firmly in the lead with about 40% support (chart 3). The conservatives are polling about half that while Reform UK has gained and is close behind the conservatives.
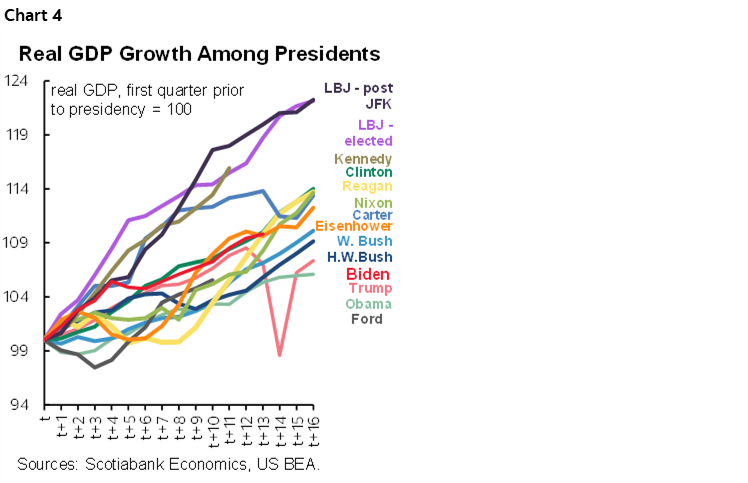
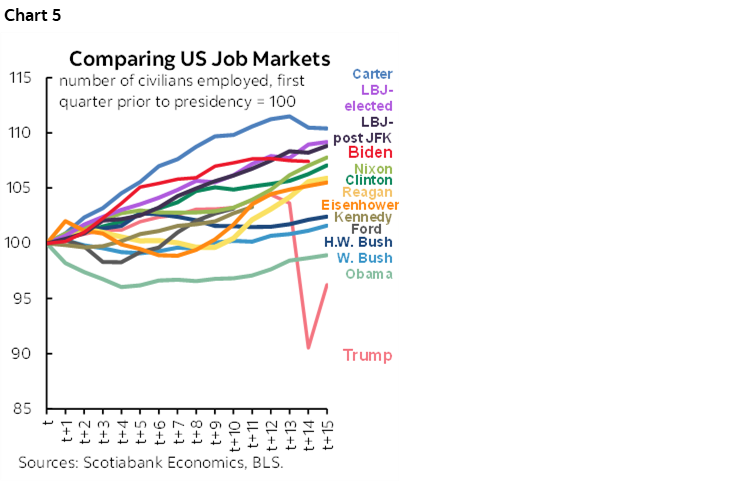
Political risk is also becoming more apparent in the US after a pathetic Presidential debate that was more about President Biden losing than Trump winning. Each candidate levied claims against the other that they have been the worst President. Historians have weighed in (here), but what about in terms of markets and economics? Enter charts 4–12 that track a variety of readings for decades of US Presidents starting at the beginning of their presidencies through to the freshest available readings.
- GDP: Score one for Biden in terms of overall economic growth (chart 4). Biden has been, well, about an average present for cumulative GDP growth to date in his term. Trump’s record on cumulative GDP growth was below Biden’s every step of the way at comparable points in their presidencies even before the pandemic hit.
- Jobs: Score another for Biden in terms of overall job growth (chart 5). Biden’s record on employment gains has been above average compared to other Presidents while Trump’s record was at best average even before the pandemic struck.
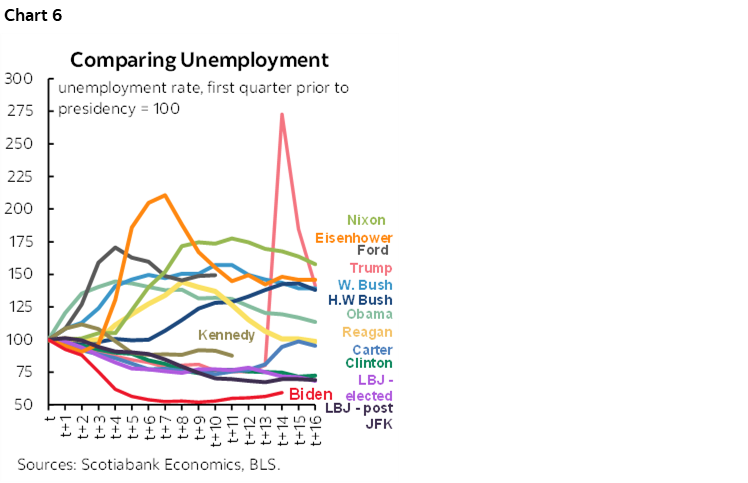
- Unemployment rate: Score a third one for Biden (chart 6).
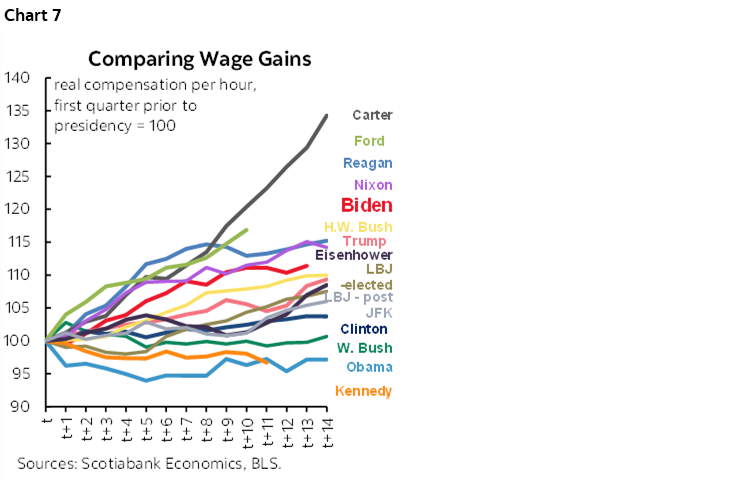
- Wage growth: Biden wins here as well, but not by a whole lot over Trump (chart 7).
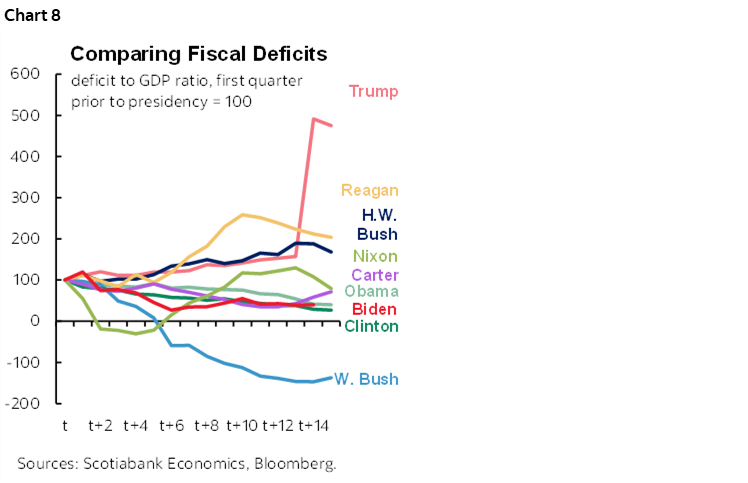
- Fiscal deficit: Score a fifth one for Biden (chart 8). Neither candidate is the poster boy for fiscal conservatism, and yet the fiscal deficit was widening under Trump even before the pandemic while it has decreased as a share of GDP through Biden’s term to date. Note that the fiscal deficit to GDP ratio was about 2½% just before Trump won the 2016 election and had roughly doubled after the Tax Cuts and Jobs Act was passed but before the pandemic hit.
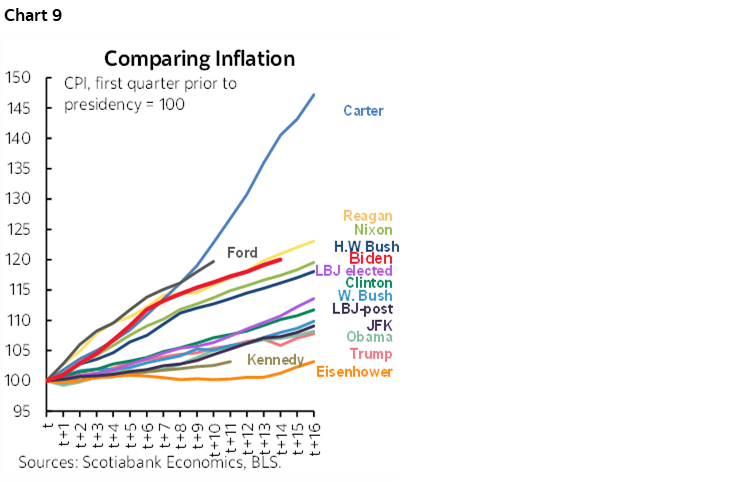
- Inflation: Now the worm begins to turn! Biden is fourth worst among US Presidents when it comes to inflation and Trump as among the better ones (chart 9). In fairness to Biden, that’s because all of the complicated global drivers of inflation kicked in after he won in 2020 while the Federal Reserve mismanaged inflation risk thereafter, but we can’t let Biden’s role off the hook given the magnitude and longevity of his spending.
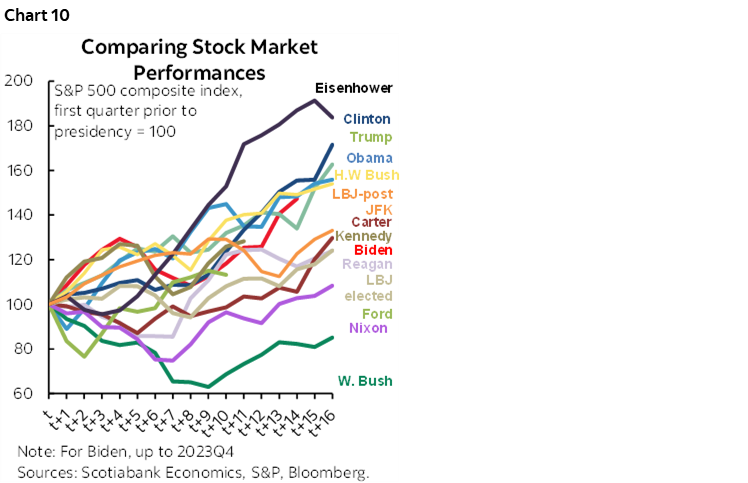
- Stocks: Score one for Trump here, but not by a wide margin over Biden (chart 10).
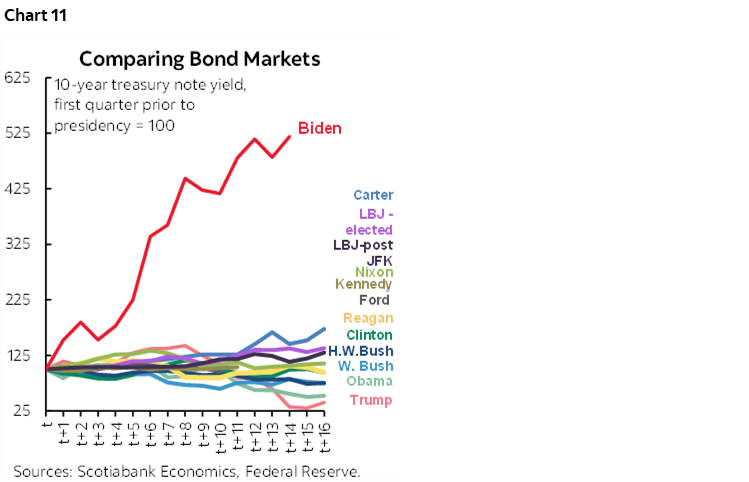
- Bonds: The bond market performed miserably under Biden compared to every other president in chart 11. It performed better under Trump but partly because of the impact of the pandemic.
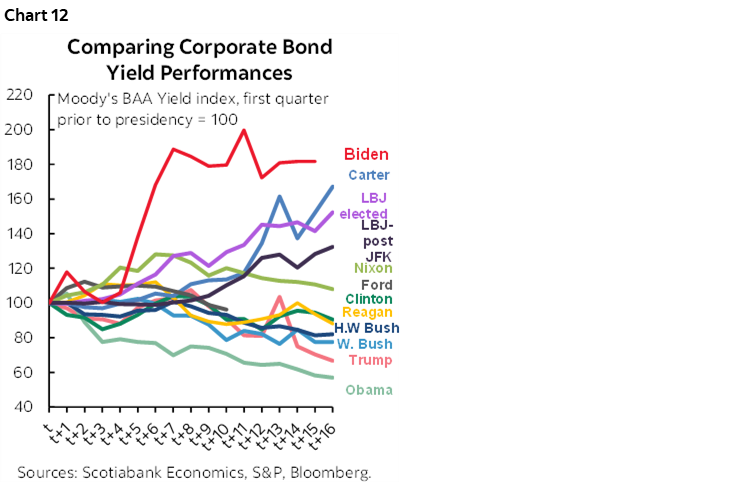
- Corporate bonds: Didn’t like what you saw in the prior chart? Well then, maybe don’t look at this one (chart 12). Biden was no friend to corporate bonds but with the same caveats by way of the unique global circumstances of his presidency.
Does all of this mean that a Biden win this November would be better over the whole term in office for the US economy, jobs, wages and deficits while a Trump win would be better for stocks and bonds? Not necessarily. These are casual observations that at best put a bit of data discipline to the wild claims made against each other in the debate, but they do not seek to control for things like the pandemic and sundry other influences that are either only partially under the control of Presidents—or not at all.
Furthermore, that’s the past. As argued here in a previous week ahead article, I believe that Trump’s fiscal plans would be worse for the bond market as Trump’s plans entail giving up more tax revenues than Biden that will clearly widen the deficit. The US economy today is in excess aggregate demand and does not need further fiscal pump priming while applying more stimulus could add to inflation risk. That could stymy or thwart prospects for easing by the Federal Reserve. Bond markets are totally different today than in 2016 when the US 10-year yield was around 1.85% versus 4.3% today. That’s because bonds are much more attuned to inflation risk and Treasury supply than they were back in 2016. The combination of another surge in debt issuance fed by taking the US fiscal deficit from roughly 6% of GDP toward 7–8% or maybe higher along with renewed upside risk to inflation could drive a major bond market sell off. The highest 30-year fixed mortgage rate since the early- to mid-1990s is a risk as is the first return to double digits since 1990. A popular investment thesis that assumes Trump would benefit markets is a tad rusty and needs to be updated for present realities.
By extension, discount rates for equities would likely rise whereas the incremental impact of potential corporate tax rate reductions are vastly smaller this time (21% to 20% under Trump’s proposal) than the much larger reduction passed with the TCJA.
US JOB MARKET—WHO’S TELLING THE TRUTH?
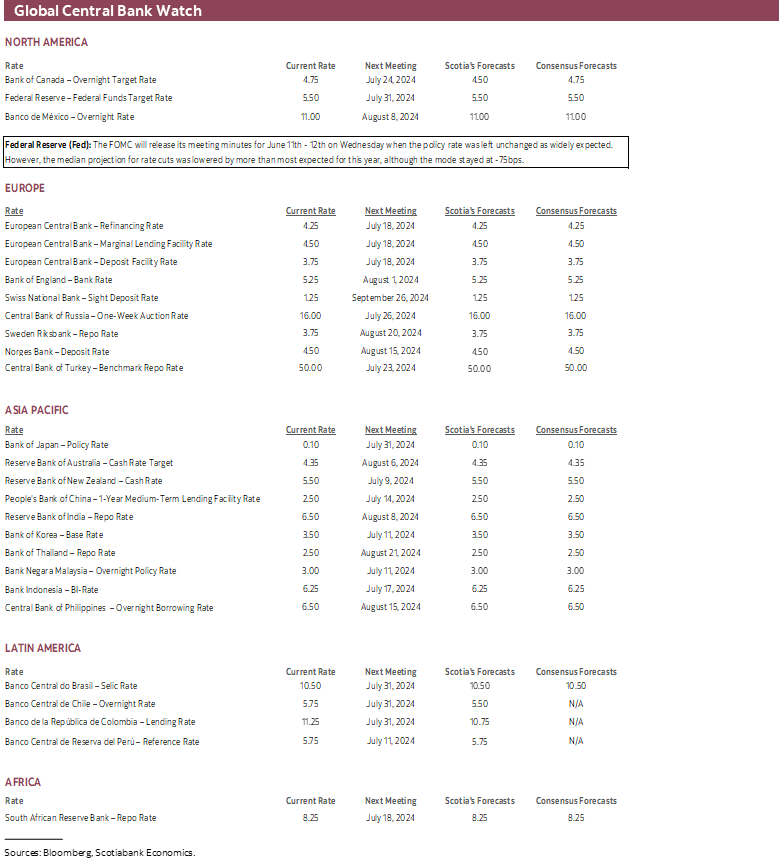
It may be the last nonfarm payrolls report before the Fed’s July 31st decision, but it’s one of three before the September 18th decision and our tentative call for the first cut to be delivered. That makes this Friday’s set of numbers for June a mere placeholder along the path toward a lot more summertime data even though any surprises are sure to elicit a market response.
I’ve tentatively gone with a gain of 210k for nonfarm payrolls. The unemployment rate may tick a touch lower as it is derived from the household survey if it shows a greater rebalancing of the bigger drop in employment than the labour force the prior month.
The path to nonfarm could be informed by other job market readings beforehand. We know that the consumer confidence measure of jobs availability increased in June and that there was only a marginal risk in weekly jobless claims between the May and June nonfarm reference periods.
On tap will be Wednesday’s Challenger job cuts in June and ADP payrolls for June. JOLTS job openings in May (Tuesday) and employment indices from ISM-manufacturing (Monday) and ISM-services (Wednesday) could also inform developments in the US job market.
Still, with a 90% confidence interval of +/-130k, the change in nonfarm payrolls has a lot of statistical noise to it that usually envelopes most estimates within consensus.
The exceptionally volatile household survey may swing back toward a large rebound if the oscillating pattern is any guide. It had registered a decline of 408k jobs in May and a 250k drop in the size of the labour force seeking employment. That loss versus nonfarm’s gain may reflect several factors, but how the composition swings may be informative. There is much more statistical noise to the household survey than nonfarm payrolls. The household survey includes off-payroll employers.
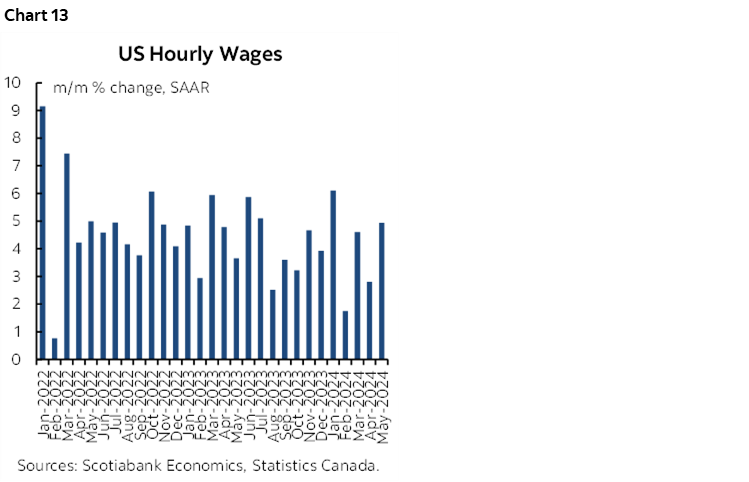
Also watch wage growth that has been volatile but posted gains of 0.4–0.5% m/m SA in three of the five months so far this year including May’s warm reading (chart 13).
ECB’S SINTRA—THE LAST MILE KILOMETRE
The European Central Bank’s version of the Fed’s Jackson Hole Symposium occurs in Sintra, Portugal on July 1st to 3rd. The Forum on Central Banking attracts global central bankers and is often an opportunity for the ECB to deliver a fresh stance. The full agenda is here.
ECB President Lagarde delivers the introductory speech on Monday at 3pmET and appears on a panel the next day at 9:30amET along with Federal Reserve Chair Powell and Banco Central do Brasil Governor Roberto Campos Neto.
It’s likely that Lagarde will continue to sound data dependent and avoid prejudging decisions on the path forward. Some at the conference will suggest that she’s too cautious and that the ECB faces an “easy last kilometre” on the path to achieving 2% inflation and that the central bank should continue to ease with confidence. This paper takes such a stance and will be presented at the conference. Watch for the risk of debate around its theme as it goes against what several ECB officials guide in terms of the difficulty of getting that last bit of inflation risk out of the system.
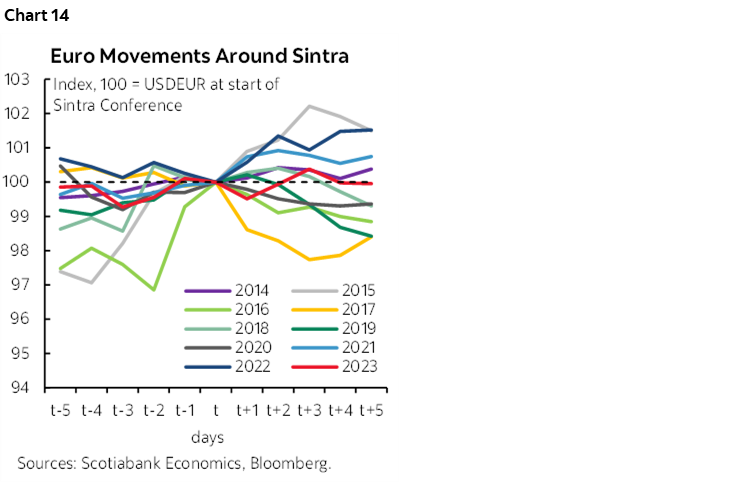
Whatever the outcome, Sintra often provokes greater euro volatility in its aftermath (chart 14).
CANADA’S JOB MARKET—THE BOC’S EXAGGERATED NARRATIVE
Canada updates the state of the job market for the month of June on Friday when the Labour Force Survey lands. It’s the last labour market reading before the BoC’s next policy decision on July 24th.
I’ve gone with a gain of 25k and an up-tick in the unemployment rate from 6.2% to 6.4%. I wouldn’t be surprised if volatility drives a cooler wage growth figure than the powerful 8.4% m/m jump in wages of permanent employees that occurred in May at a seasonally adjusted and annualized rate.
One driver of an expected job gain is likely to be continued growth in the labour force that is filling job vacancies. Vacancies have come down but remain elevated above pre-pandemic levels. Canada’s population continues to explode and new arrivals are helping to fill these spots along with the born in Canada population.
Still, jobs numbers in Canada are more about the clean-up in the aftermath rather than having great conviction behind one’s estimates. There is a lot of statistical noise in the household survey, as indicated by the fact that the 95% confidence interval around monthly changes in employment is about +/-57,000!
The job market has been on fire so far this year. Almost 200k jobs have been created in the first five months of the year. That puts Canada on track toward achieving something similar to the 488k jobs that were created in 2023. Somehow these facts get ignored amid the excessive pessimism toward the state of the Canadian economy.
The BoC’s Job Market Narrative…
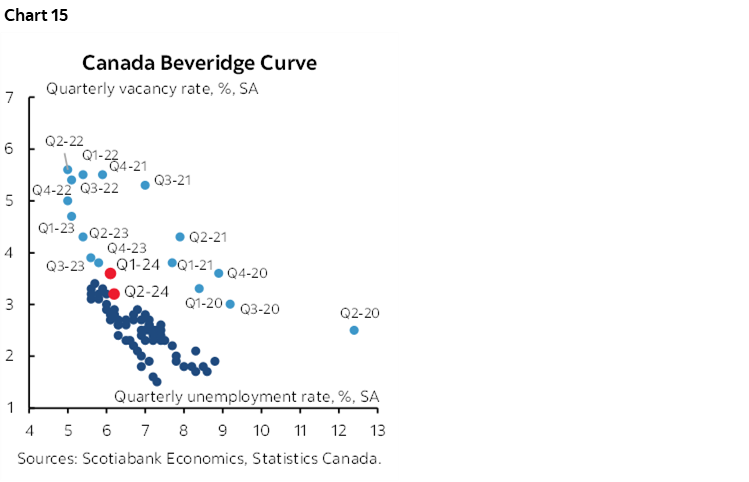
I believe that Governor Macklem’s recent speech overstated a few things about the job market. There is no disagreement that the so-called Beveridge Curve is moving away from extreme imbalances (chart 15). The job vacancy rate has fallen and the unemployment rate has risen. There is, however, room for disagreement on the drivers of the higher unemployment rate and whether this will persist, and whether wage growth is truly slowing.
…May Be Too Pessimistic
The rise in the unemployment rate could well be temporary as immigration policy shifts, but it will take time to evaluate this argument.
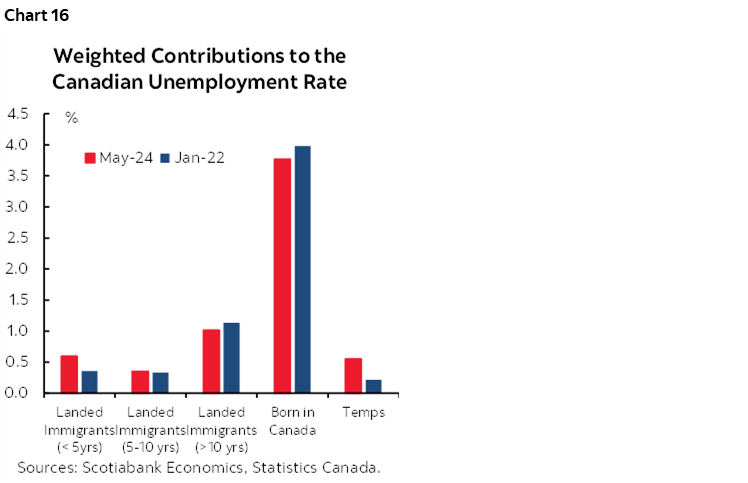
The biggest weighted contribution to the rise in the national unemployment rate since 2022 has been the nonpermanent resident category (chart 16). Take temps out of the picture and Canada’s unemployment rate would have been unchanged over this period.
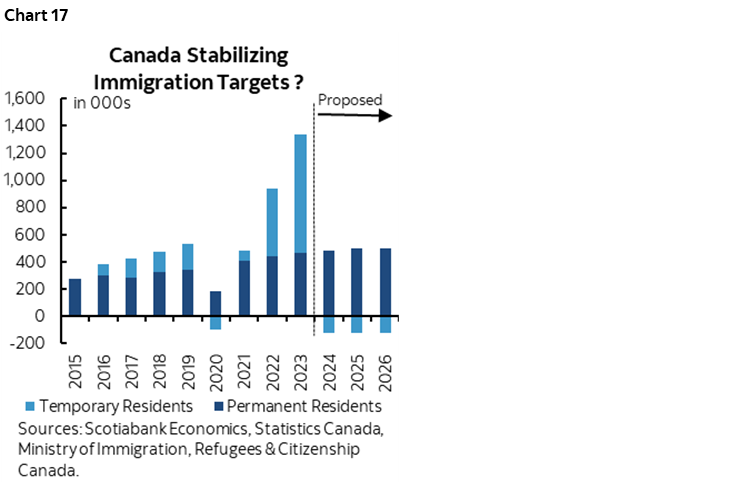
Why take them out? Because they soon will be. Temp residents have exploded in number in Canada as this part of immigration policy was totally mismanaged. As these temporary residents—comprised of international students, temporary foreign workers, and asylum seekers—go down in number under the government’s proposals (chart 17), this should tighten that part of the labour market and put renewed downward pressure on the overall national unemployment rate.
The slightly smaller weighted contribution to the higher national unemployment rate that has come from permanent residents here for less than five years has been offset by downward influence from born in Canada unemployed people and unemployed permanent residents here for longer than five years.
Wage Growth Isn’t Cooling
The BoC contends that wage growth has been cooling. That’s debatable.
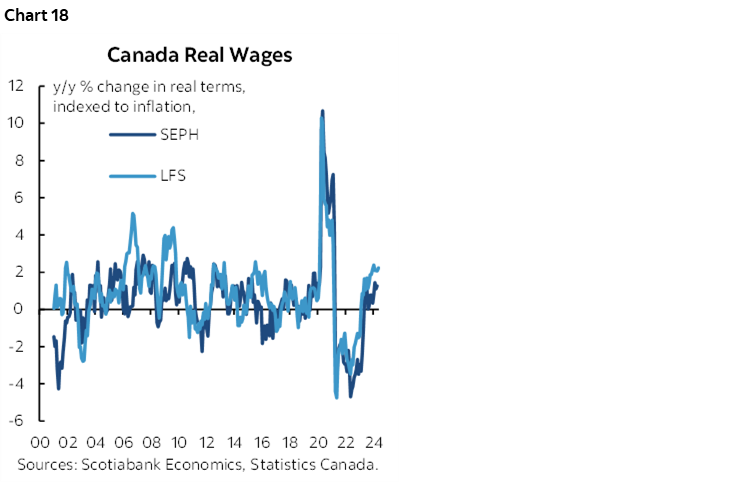
First, Macklem’s recent speech only presented wage growth figures in nominal terms. Chart 18 shows that Canadians are enjoying accelerating real wage gains as nominal wage growth outpaces CPI.
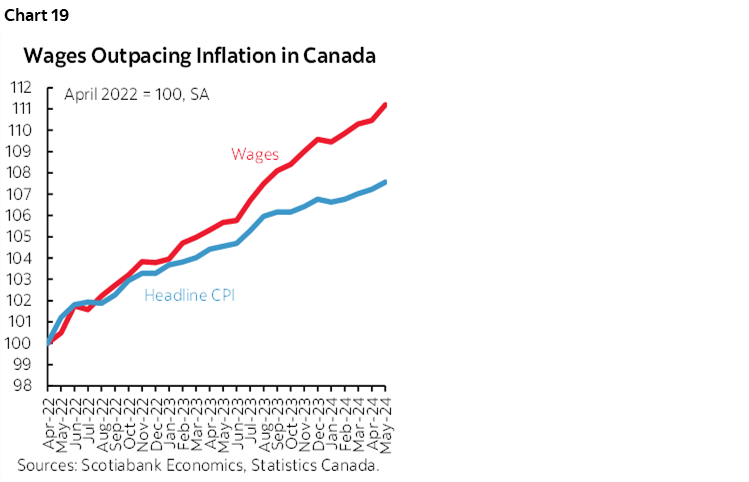
One argument is that nominal wage growth reacts in lagging fashion to inflation and therefore wage growth may cool. Maybe, and yet wage growth has been outpacing inflation dating back to even before inflation surged (chart 19). Real wage gains have been occurring for many years in defiance of the argument that they are only happening now in lagging fashion to the pandemic surge in inflation.
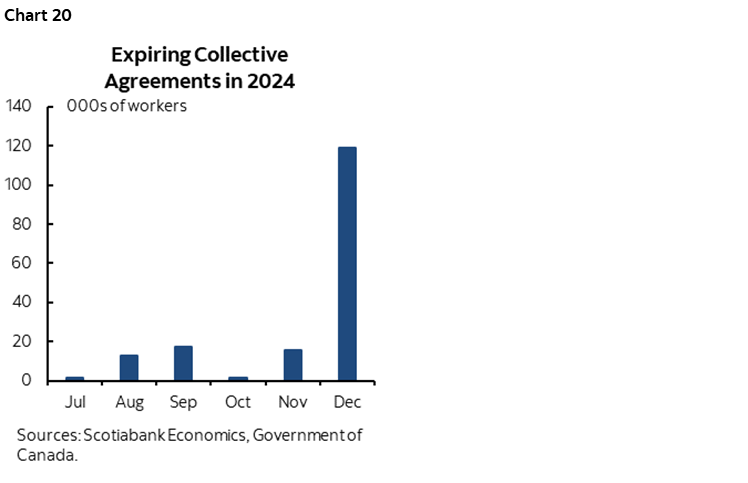
Further, this argument may give short shrift to labour market power. Almost one-third of Canada’s labour market is unionized which is triple the US rate. Union negotiators have power over the outcomes as we’ve seen by shutting down workplaces. Canada is still seeing collective bargaining wage settlement figures that are well above 2% inflation in each of the first year of agreements and the full contract periods. Millions of workers continue to face expiring collective bargaining agreements (chart 20).
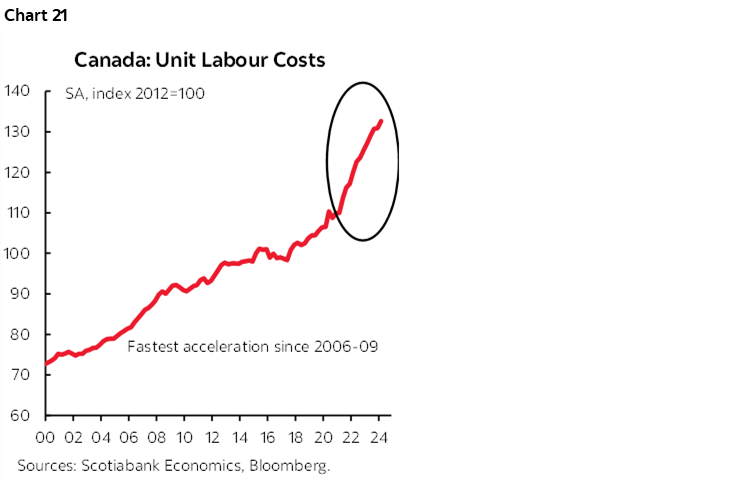
We should also look at employment costs adjusted for productivity. Most economists would argue that real wage gains need productivity gains to support them over time and without causing labour market imbalances and competitiveness problems. Chart 21 screams competitiveness problems in Canada. Unit Labour Costs continue to skyrocket.
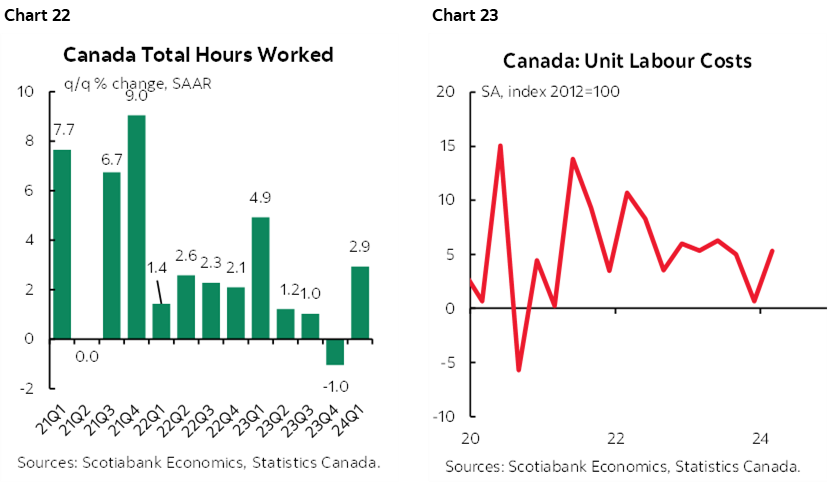
When Governor Macklem referred to ULCs in his speech he cited a slower rate of growth in the past six months. C’mon. That’s entirely because of the 2023Q4 distortion that he should have controlled against. In Q4, hours worked tumbled due to strikes (chart 22) and this made productivity look better for that one single quarter. By corollary, it depressed growth in unit labour costs for that one single quarter. Controlling for that one single quarter in 2023Q4 shows no cooling trend in unit labour costs (chart 23). Canada has been stuck in a persistent pattern of growth in ULCs between about 5% and 6¼% in five of the past six quarters. The BoC has been playful with the numbers.
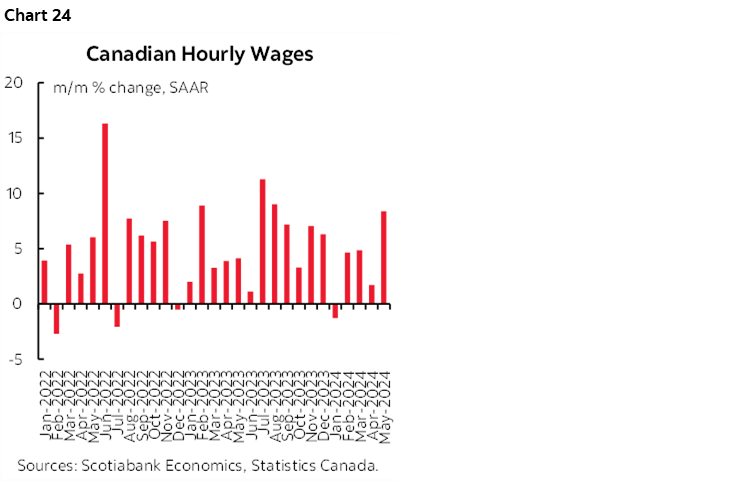
Further, what matters in evaluating wage growth is evidence at the margin, not y/y measures that are distorted by base effects. Chart 24 shows wage growth using the Labour Force Survey’s measure of average hourly earnings of permanent employments in m/m seasonally adjusted and annualized terms. The figures are volatile but it’s anything but clear to me that wage growth is cooling.
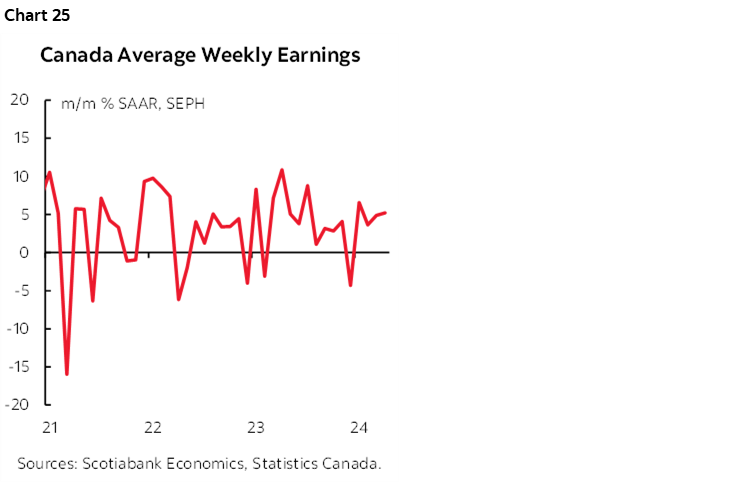
We get a similar outcome using the Survey of Employment, Earnings and Payrolls (SEPH) figures for average weekly earnings. Chart 25 shows that the same approach to measuring wage growth is also volatile, but not showing clear signs of cooling.
INFLATION DOMINATES THE REST
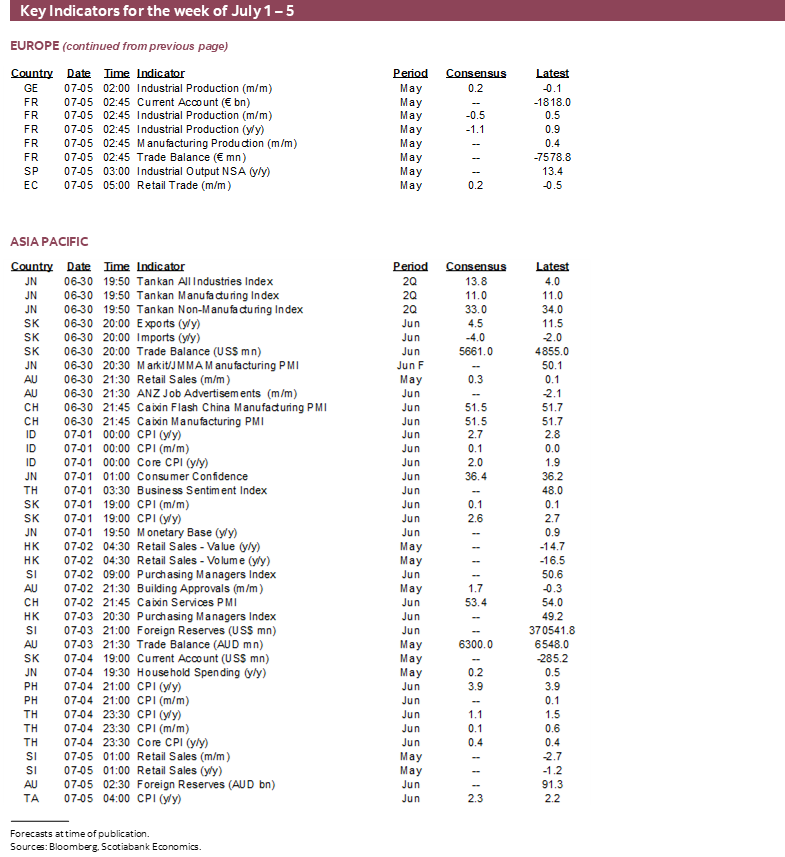
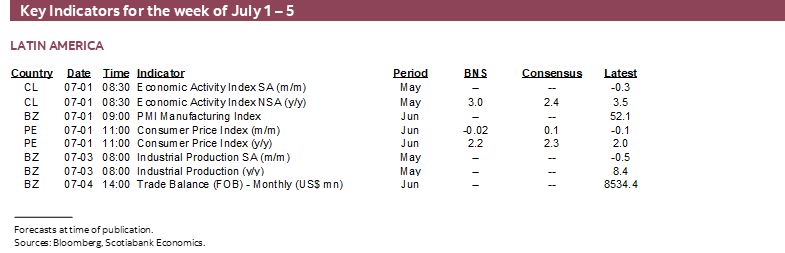
This will be a heavy week for global inflation readings. Across major markets the main focus will be upon Monday’s German CPI print and then Tuesday’s Eurozone tally with core inflation being the key following some signs that it remains too warm as in Spain’s case after Spain, Italy and France already released. Spanish m/m core CPI NSA was the third hottest month of June on record. Switzerland’s CPI figures are expected to be soft and support a continued SNB easing bias (Thursday). Peru, Indonesia and South Korea update Monday, Philippines and Taiwan come out on Thursday and then Taiwan releases on Friday.
Canada will focus on jobs with little else to consider. Markets are shut on Monday for Canada Day. The S&P manufacturing (Tuesday), services and composite (Thursday) and Ivey (Friday) purchasing managers indices are due out along with trade figures for May (Tuesday).
Several other US will be offered this week. Minutes to the June 11th – 12th FOMC meeting will be delivered on Wednesday afternoon (recap here). ISM-manufacturing and construction spending are due out on Monday. Vehicle sales could be quite soft on Tuesday based on first-half tracking for June from industry sources plus the negative impact of the CDK hack. A wider US trade deficit (Wednesday), small gain in factory orders (Wednesday) and possible softening of ISM-services (Friday) will complete the line-up.
Three other significant reports will include the Bank of England’s lending survey on Thursday, China’s private PMIs on Tuesday, RBA minutes on Monday, and German industrial figures on Thursday and Friday.


DISCLAIMER
This report has been prepared by Scotiabank Economics as a resource for the clients of Scotiabank. Opinions, estimates and projections contained herein are our own as of the date hereof and are subject to change without notice. The information and opinions contained herein have been compiled or arrived at from sources believed reliable but no representation or warranty, express or implied, is made as to their accuracy or completeness. Neither Scotiabank nor any of its officers, directors, partners, employees or affiliates accepts any liability whatsoever for any direct or consequential loss arising from any use of this report or its contents.
These reports are provided to you for informational purposes only. This report is not, and is not constructed as, an offer to sell or solicitation of any offer to buy any financial instrument, nor shall this report be construed as an opinion as to whether you should enter into any swap or trading strategy involving a swap or any other transaction. The information contained in this report is not intended to be, and does not constitute, a recommendation of a swap or trading strategy involving a swap within the meaning of U.S. Commodity Futures Trading Commission Regulation 23.434 and Appendix A thereto. This material is not intended to be individually tailored to your needs or characteristics and should not be viewed as a “call to action” or suggestion that you enter into a swap or trading strategy involving a swap or any other transaction. Scotiabank may engage in transactions in a manner inconsistent with the views discussed this report and may have positions, or be in the process of acquiring or disposing of positions, referred to in this report.
Scotiabank, its affiliates and any of their respective officers, directors and employees may from time to time take positions in currencies, act as managers, co-managers or underwriters of a public offering or act as principals or agents, deal in, own or act as market makers or advisors, brokers or commercial and/or investment bankers in relation to securities or related derivatives. As a result of these actions, Scotiabank may receive remuneration. All Scotiabank products and services are subject to the terms of applicable agreements and local regulations. Officers, directors and employees of Scotiabank and its affiliates may serve as directors of corporations.
Any securities discussed in this report may not be suitable for all investors. Scotiabank recommends that investors independently evaluate any issuer and security discussed in this report, and consult with any advisors they deem necessary prior to making any investment.
This report and all information, opinions and conclusions contained in it are protected by copyright. This information may not be reproduced without the prior express written consent of Scotiabank.
™ Trademark of The Bank of Nova Scotia. Used under license, where applicable.
Scotiabank, together with “Global Banking and Markets”, is a marketing name for the global corporate and investment banking and capital markets businesses of The Bank of Nova Scotia and certain of its affiliates in the countries where they operate, including; Scotiabank Europe plc; Scotiabank (Ireland) Designated Activity Company; Scotiabank Inverlat S.A., Institución de Banca Múltiple, Grupo Financiero Scotiabank Inverlat, Scotia Inverlat Casa de Bolsa, S.A. de C.V., Grupo Financiero Scotiabank Inverlat, Scotia Inverlat Derivados S.A. de C.V. – all members of the Scotiabank group and authorized users of the Scotiabank mark. The Bank of Nova Scotia is incorporated in Canada with limited liability and is authorised and regulated by the Office of the Superintendent of Financial Institutions Canada. The Bank of Nova Scotia is authorized by the UK Prudential Regulation Authority and is subject to regulation by the UK Financial Conduct Authority and limited regulation by the UK Prudential Regulation Authority. Details about the extent of The Bank of Nova Scotia's regulation by the UK Prudential Regulation Authority are available from us on request. Scotiabank Europe plc is authorized by the UK Prudential Regulation Authority and regulated by the UK Financial Conduct Authority and the UK Prudential Regulation Authority.
Scotiabank Inverlat, S.A., Scotia Inverlat Casa de Bolsa, S.A. de C.V, Grupo Financiero Scotiabank Inverlat, and Scotia Inverlat Derivados, S.A. de C.V., are each authorized and regulated by the Mexican financial authorities.
Not all products and services are offered in all jurisdictions. Services described are available in jurisdictions where permitted by law.