Next Week's Risk Dashboard
- US households have plenty of excess savings and high liquidity
- Canadian households are in even better shape on both counts
- Another warm US core CPI reading?
- Fed’s Powell speaks pre-CPI
- US retail sales face a tough act to follow
- Light Canadian updates on tap
- Australian jobs and wages may inform RBA pricing
- Chinese, Japanese economies in focus
- Have Mexican wages caught up to the minimum wage hike?
- Mexico’s Morena party is still polling strongly ahead of June 2nd election
- Colombian economic growth probably picked up
- Peruvian GDP growth to soften
- PBOC expected to stay on hold
- BSP is also expected to stay on hold
- Other Global macro reports
Chart of the Week
US CPI will be the potential showstopper and biggest event this week, but there will be plenty to consider across other markets. Given the week’s partial focus upon US consumer spending, it’s worth taking a closer look at a key issue governing the outlook for Canadian and US consumers.
WHO SAYS PANDEMIC EXCESS SAVINGS ARE GONE?
The outlook for US and Canadian consumer spending depends in part upon assessments of how much they still have squirrelled away after stimulus was being thrown at households during the pandemic. A large amount of excess saving by US consumers continues to exist, but arriving at this view depends upon how it’s measured. A large amount of excess saving by Canadian consumers continues to exist and—unlike the US—this conclusion does not depend upon how it is measured.
US Households Are Substituting Sources of Savings
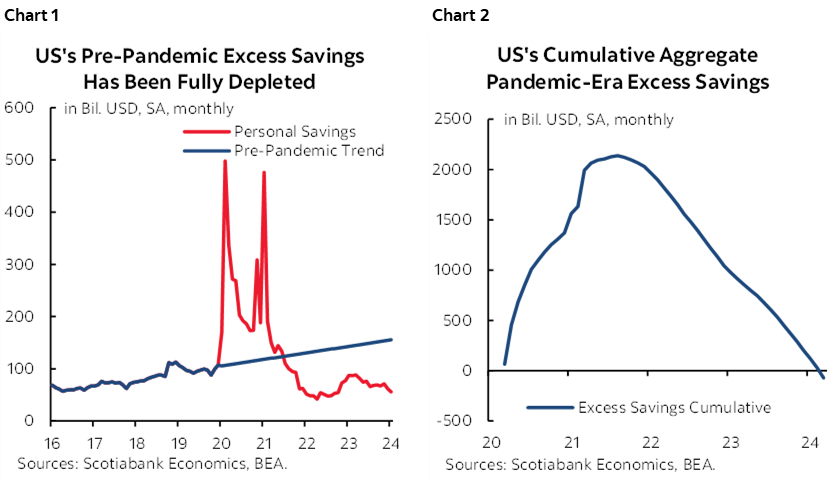
This piece makes a good contribution to the efforts to quantify excess household saving in the US, but it applies a very narrow definition of saving that is not linked to changes in household balance sheets which I’ll do in a moment. The definition of saving that the authors take uses the flow of savings from national income accounts defined as the difference between gross income and gross consumption in each period. The authors’ measure of excess saving (or dissaving) is defined as what is saved out of current period income that is in excess of what a pre-pandemic trend line would have predicted they would be saving now. Whereas households were once saving at an above-trend pace, they shifted toward saving at a below-trend pace for about the past three years (chart 1). Using this approach, the authors figure that US households have just now depleted their total stocks of excess savings and therefore the US economy is a sitting duck that is vulnerable to a consumer slowdown (chart 2).
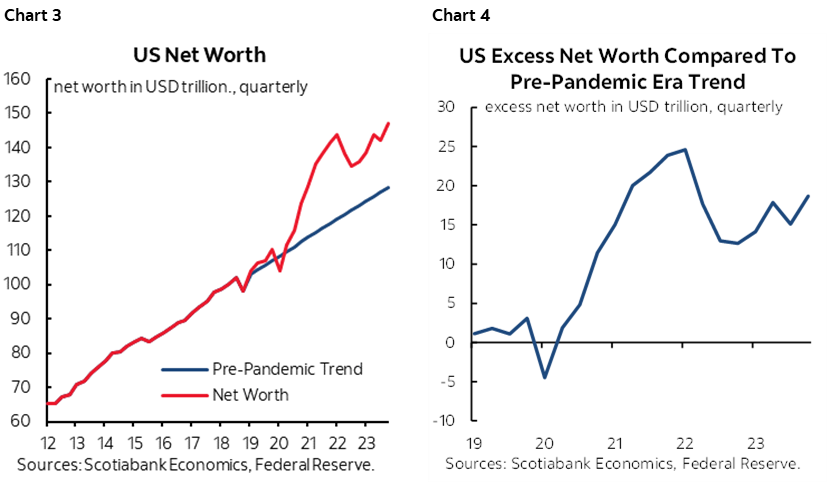
The shortcoming to this approach is that we also want to consider how households are potentially substituting more rapid gains in wealth for saving out of just current period income. For that, we need to look at the household balance sheet. Chart 3 shows that the difference between total household net worth today minus what a simple, stable trend line fitted to the pre-pandemic era (consistent with their approach) would have predicted to happen to net worth by now. Chart 4 shows the cumulative change in household net worth by now compared to a trend line; American households have about US$18.9 trillion in ‘excess’ net worth.
So, are US households really out of pandemic savings? In a cash flow sense, yes, but in a more meaningful sense, far from it. US households have merely substituted away from saving off pay cheques and other sources of current period income toward changes in overall wealth. Most economists consider wealth effects when they assess the outlook for consumer spending such that only looking at current period income and current period saving leads to a very incomplete approach. Having said that, the bang for the buck in terms of consumer spending growth comes more from a dollar’s worth of extra income than a dollar’s worth of extra wealth, but the magnitude of the wealth overshoot also matters.
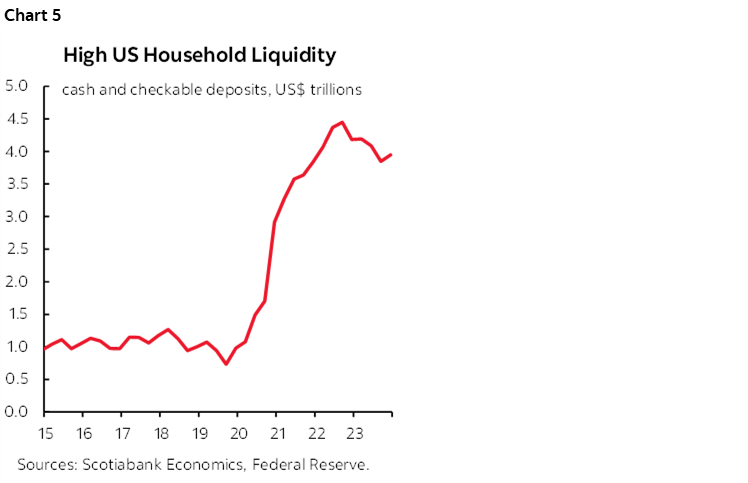
What’s more is that US households also maintain very high liquidity with cash and near-cash balances sitting at about US$4 trillion, or four times the pre-pandemic level (chart 5). Idle cash sitting around is tempting to spend. Overall, these points all taken together suggest that the outlook for US consumer spending continues to be strongly supported by ‘excess’ savings.
Of course, how to define ‘excess’ is more complicated than just trending out everything from before the pandemic. Maybe folks feel a higher precautionary need to save and are hoarding wealth gains instead of spending it all after being hit hard by the pandemic and the lingering uncertainty plus given the risks to the US economy going forward. Maybe folks have a keener eye on retirement, especially for aging baby boomers. Even though it’s not true for the narrow definition of saving, perhaps high interest rates are leading them to save gains in net worth rather than spend.
Canadian Households Are Looking Even Better than US Households
So how about Canada? The evidence points to plenty left in the tank no matter which definition of ‘excess’ saving is invoked.
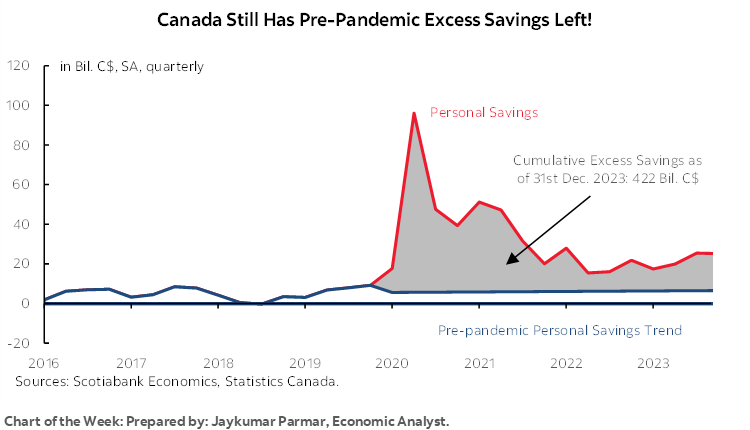
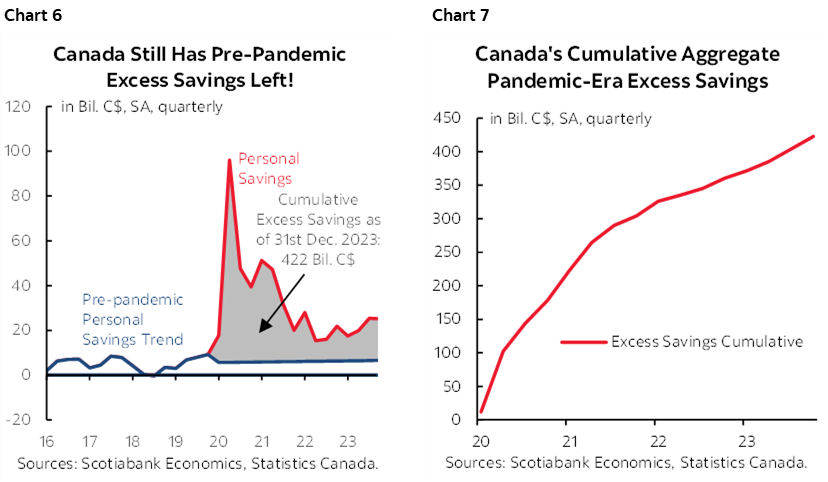
Chart 6 shows personal savings each period compared to what would be predicted by now using nothing more than a simple trend line fitted to the years before the pandemic. Chart 7 shows that this persistent overshoot of savings relative to a pre-pandemic trend has resulted in a persistently rising trend toward over C$400 billion in accumulated saving.
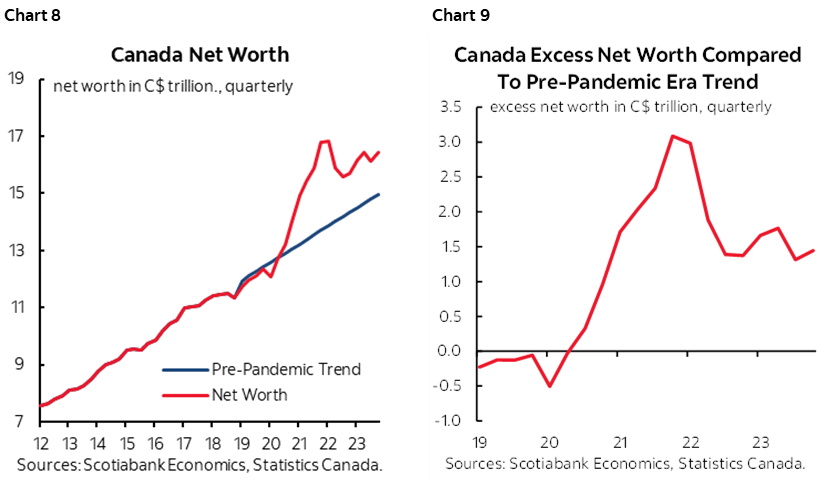
Using the net worth approach, Canadian households have about C$1½ trillion more ‘excess’ net worth than would have been predicted for now by a simple trend line fitted to the pre-pandemic trend (charts 8, 9).
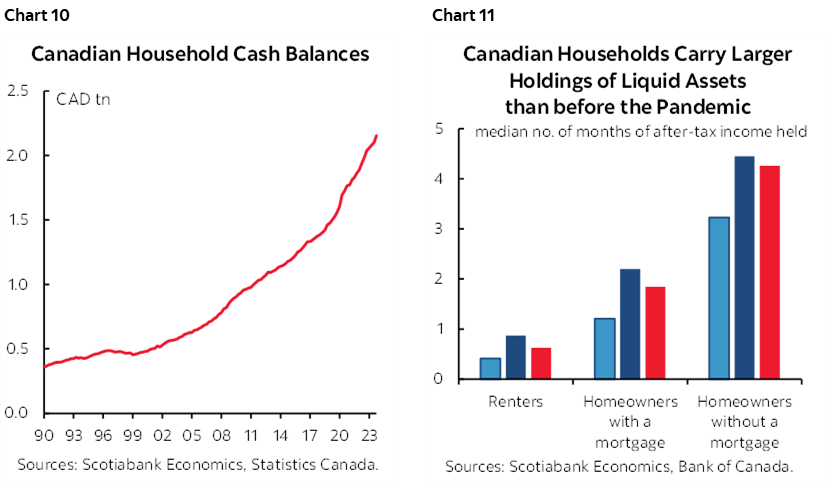
Like the US, Canadian households also have a high degree of liquidity. I’ve used chart 10 for a long time to illustrate this point. The Bank of Canada’s recent Financial System Review added chart 11 that shows the breakdown of liquidity by renter, homeowner with a mortgage and homeowner without a mortgage.
There are a lot of other considerations governing the outlook for US and Canadian households but at least we can conclude that US households are much better off in terms of stockpiled savings than a narrow approach would lead one to believe. Canadian households are even better off than American ones and an added rationale for that may be precautionary savings into the remaining fixed rate mortgage resets, although the concentration of excess liquidity in homeowners with no mortgage is important. Canadian households are likely to continue to be able to withstand those effects for reasons I’ve explained many times, but the savings in the tank approach captured here reinforces my conviction from a macroeconomic perspective.
US INFLATION—DON’T LOSE FAITH
Another round of US inflation data begins to arrive this week when CPI for April arrives on Wednesday, a day after producer prices.
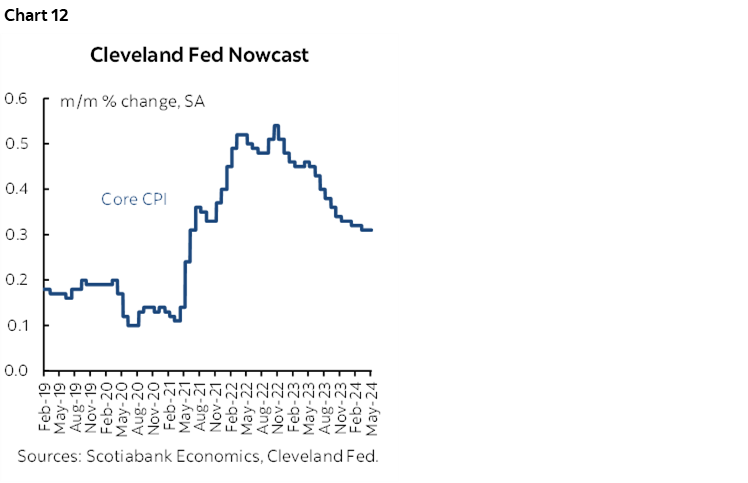
This could be another hot one. I’ve estimated a rise of 0.4% m/m SA for headline CPI and 0.3% for core CPI ex-food and energy which this time is similar to the Cleveland Fed’s ‘nowcast’ estimates (chart 12). A cooler reading compared to the recent trend would probably reignite market pricing for cuts but wouldn’t be enough to convince anyone at the Fed to move any time soon. A reading in line with expectations and hence the recent trend, or hotter yet, would probably offer further motivation for FOMC officials to take an axe to the March dot plot when they publish another one next month.
When converted to annualized rates, US core CPI inflation has been running at well over 4% m/m SAAR in each of the past three months and about 3½% m/m SAAR in the two months prior to that. Compared to the 2% inflation goal, that’s just far too hot to entertain easier monetary policy at this juncture especially given Chair Powell’s distrust toward model-based forecasts in favour of harder evidence on inflation and inflation risk.
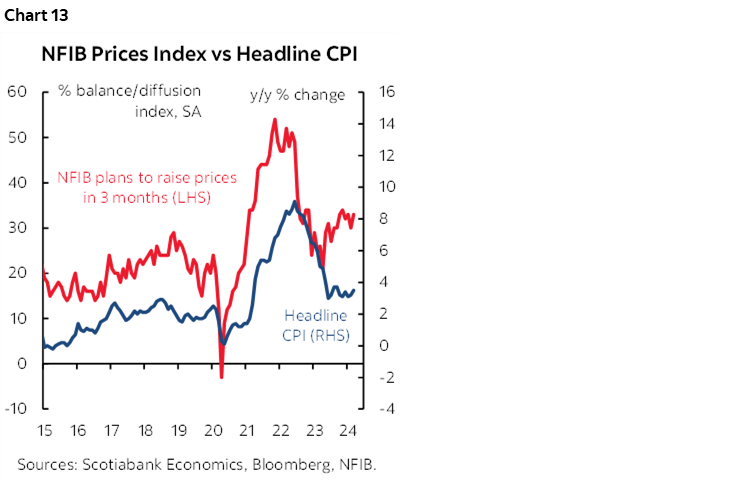
Among the catalysts this time could be that small businesses continue to indicate plans to raise prices (chart 13), a 3% m/m SA rise in gasoline prices, and higher vehicle prices based on industry guidance. New vehicle prices were probably little changed with a slight negative bias, but used vehicle trade-in values were valued about 4% m/m SA higher. Shelter costs are expected to continue rising rapidly with another 0.4–0.5% m/m SA rise in OER and 0.4% gain in rent.
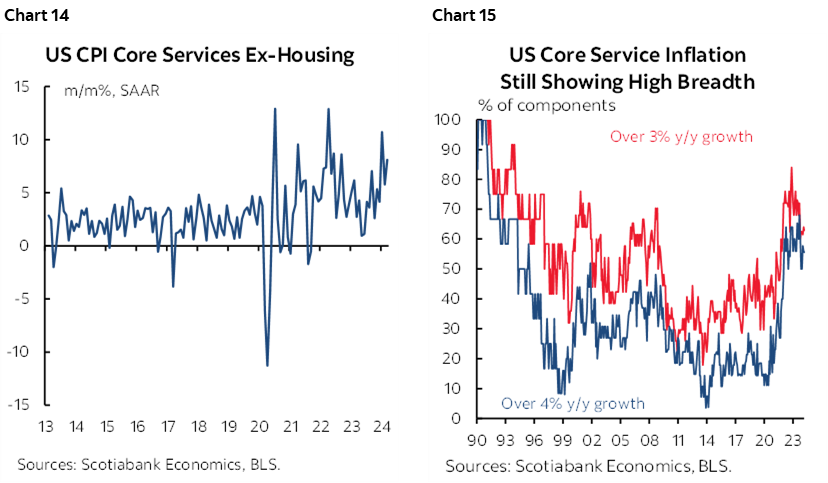
Key, however, will be core services CPI (ex-housing) that have been running at a very hot pace this year (chart 14). The breadth of price increases has remained high (chart 15). It may prove to be difficult to post repeat strong gains in categories like apparel and insurance particularly auto insurance.
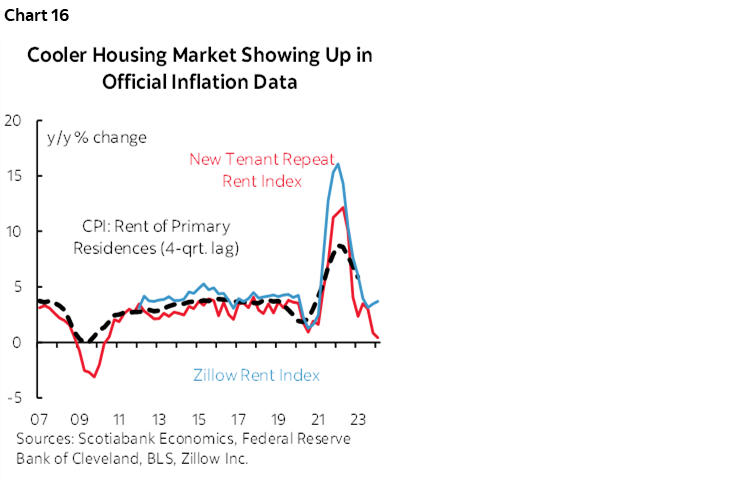
Reasons for Inflation Optimism
Apart from uncertainty around the latest print there is the issue of whether we should give up on achieving lower inflation. I’m not convinced. It’s just a matter of time before market rents being to drag down a part of shelter costs in US CPI (chart 16). Furthermore, among the inputs into an inflation call are the drivers of the supply and demand imbalance that currently still sits in excess demand with an output gap of over 1%. There continue to be reasons to expect slower trend growth in the US economy and a pick-up in potential output.
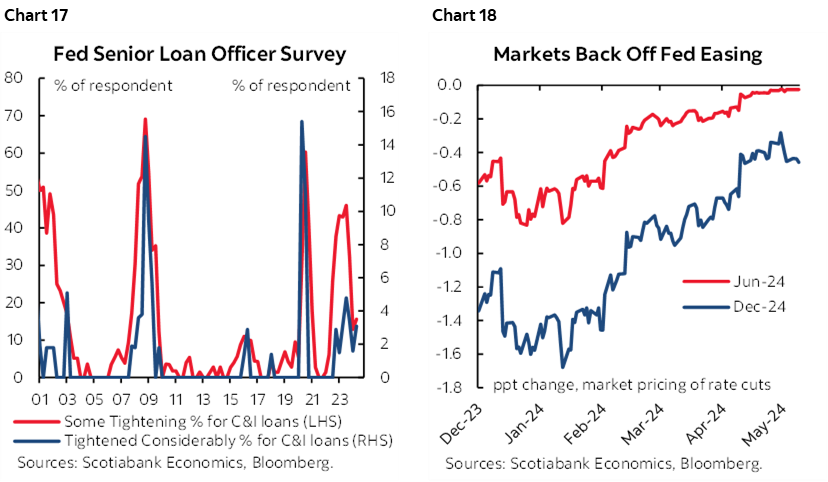
Drivers of actual GDP growth could still face a slowing trajectory driven by the lagging effects of tighter credit conditions (chart 17), market tightening as cuts have been priced out (chart 18), the effects of the strong USD on net trade, reduced fiscal contributions to GDP growth, and c-suite confidence that could be vulnerable to US election uncertainty especially if it gives way to a more damaging trade environment that could crimp cap-ex spending.
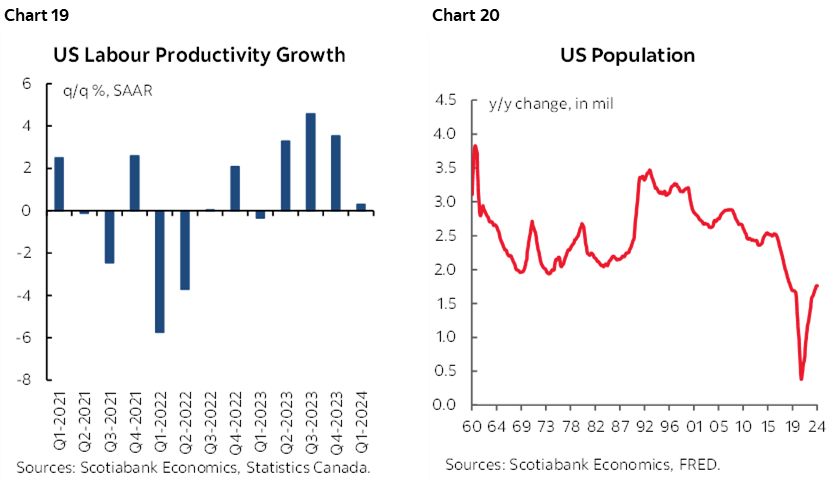
On the supply side, there remains a vibrant debate over whether the US can sustain trend productivity gains albeit considering the Q1 softening (chart 19) and population growth (chart 20) that could raise the potential economic output of the US economy.
CENTRAL BANKS—ALL TALK, NO ACTION
There will be no shortage of central bank speak this week. There will be very little by way of potential action to assess with just two central bank decision on the docket and neither of them is expected to deliver change.
Powell Headlines the Talkers
Federal Reserve Chair Powell speaks on Tuesday ahead of the following day’s CPI update. He will be on a panel with ECB Governing Council and President of the Dutch central bank, Klaas Knot, perhaps best said slowly. No topic has been offered by the apparently secretive Dutch Foreign Bankers’ Association. We’ll also hear from several regional Fed presidents mostly later in the week after CPI and so what they say might matter more to markets.
Also watch for several ECB speakers throughout the back half of the week as the key June 6th ECB meeting draws closer.
A trio of Bank of England officials will also reach for the mic (Pill, Greene, Mann), but are unlikely to raise many eyebrows coming after this past week’s BoE decision.
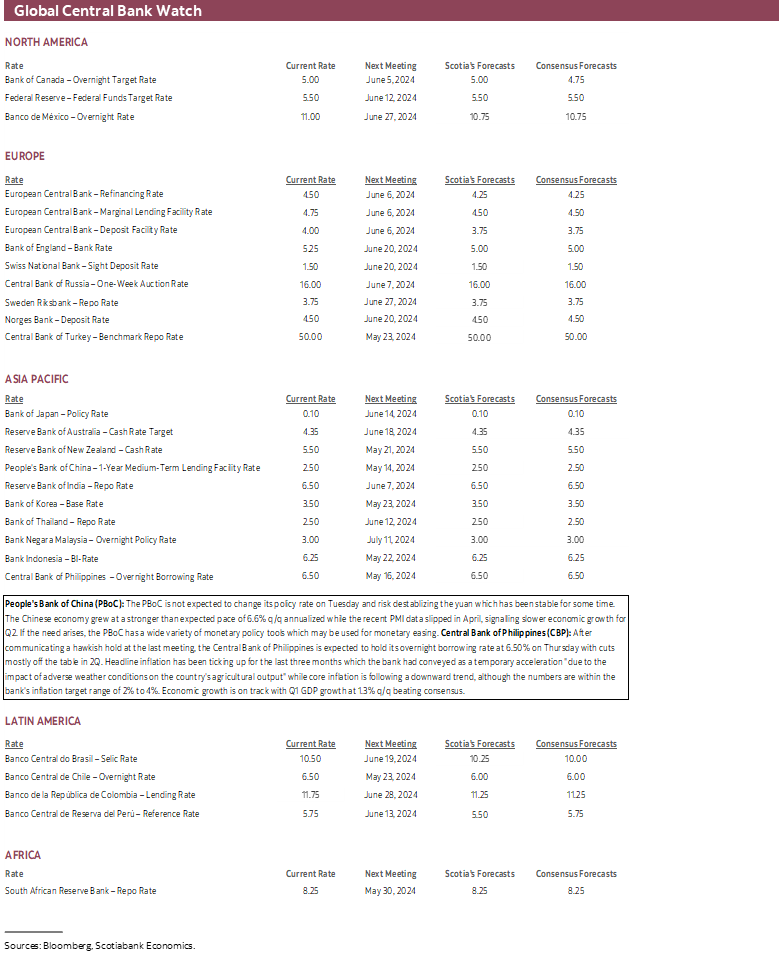
PBOC—I Yuan to Cut But Can’t
The People’s Bank of China is widely expected to remain on hold on Tuesday evening (eastern time as always in this publication). The 1-year Medium-Term Lending Facility Rate is expected to hold at 2.5%. The PBOC is dealing with very low inflation at 0.1% y/y and poised for an updated shortly after this publication will be sent, but easing monetary policy while the Federal Reserve’s rate cuts are being tamped down and pushed out could destabilize the yuan and Chinese financial markets.
BSP—The Peso Will Drive a Cautious Stance
Bangko Sentral ng Pilipinas is expected to hold its overnight borrowing rate unchanged at 6.5% on Thursday. It has been on hold since October partly because the peso has depreciated since March as the Federal Reserve’s rate cuts began to be repriced.
GLOBAL MACRO—IT’S NOT JUST ABOUT US CPI!
Significant macro reports will be released by most major regions of the world such that US CPI won’t be the only game in town. Here’s the run down.
US Consumer Spending to Highlight Non-CPI US Market Risks
US CPI will dominate the US calendar, but there will be a few other gems to consider:
- Retail sales (Wednesday): April’s tally is expected to post a gain of ½% m/m SA in nominal terms. New auto sales volumes were up by 1.6% m/m SA in April and industry data points to a slight decline in new vehicle prices but a hefty rise in used vehicle prices of over 4% m/m SA. Gasoline prices also moved up by about 3% m/m SA. Key will be sales ex-autos and gas that are expected to be soft after the 1% m/m prior gain.
- Initial jobless claims (Thursday): Bonds rallied after initial claims climbed to their highest level since last August in the latest week. This week’s update will further inform whether that was an anomaly related to difficulty controlling for seasonal factors that shift each year like school breaks.
- Industrial output (Thursday): April’s tally is expected to be soft given a dip in the ISM-manufacturing’s production subindex and possible difficulty repeating the prior month’s 2% gain in output at utilities. The Empire manufacturing gauge that covers the NY Fed’s district will be updated with the May reading on Wednesday to help inform early tracking on the path to the next ISM-mfrg report.
- Producer prices (Tuesday): The order of release reverses this month as producer prices arrive before CPI. A mild rise in core producer prices is being tracked.
- Housing starts (Thursday): Watch for a rebound from the prior month’s 15% m/m drop as starts continue a very volatile pattern so far this year.
Canada is in Between Major Reports
Canadian markets will be driven by spillover effects from US CPI but otherwise face a light domestic calendar between the recently strong jobs report (here) and the following week’s Canadian CPI. There will be an early close on Friday at 1pmET ahead of the Victoria Day long weekend, aka the unofficial start of the Canadian summer.
- Housing starts for April (Wednesday) are expected to soften given volatile but generally lower trending permit volumes.
- Manufacturing sales during March (Wednesday) were guided by Statcan on April 24th to have declined by 2.8% m/m in nominal terms and may be subject to revision in this week’s estimate that will also fill in important details like shipment volumes.
- Existing home sales during April might offer a soft start to the Spring housing market, but a damp and cool month plus a relatively slow pick-up in listings may be part of the reasons alongside scrutiny that will be applied to seasonal adjustment factors. There is no reason to go low on an April SA factor when Good Friday was earlier than normal this year on March 30th and real estate agents were available throughout the weekend. I made this point in last week’s weekly while expressing skepticism toward Toronto’s seasonal adjustments given that going low on the SA factor was the reason why sales were reported as softer.
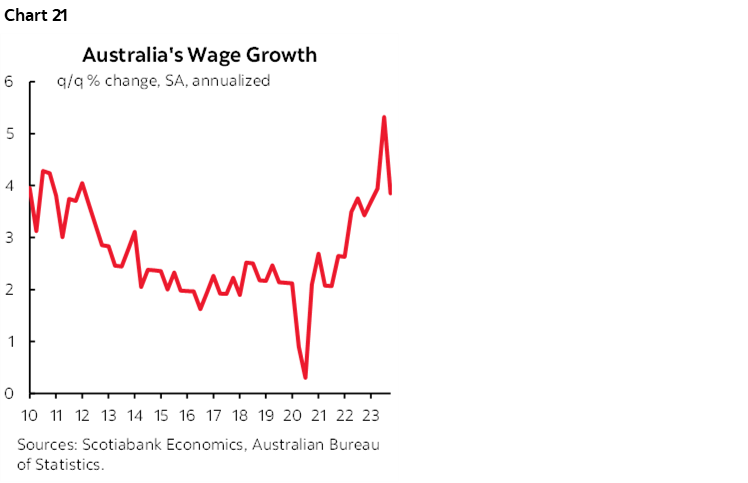
Australia’s Wages to Inform the RBA’s bias
Australia updates wage growth during Q1 on Tuesday night (ET). They’ve been growing at a trend pace in the roughly 4–5% q/q SAAR range over the past year (chart 21). Further such momentum could make it challenging to bring Australian inflation down to the RBA’s target 2–3% range on a sustainably basis.
Australia then updates jobs for the month of April the next day. The economy has gained 121k jobs so far this year, but mostly due to a jump in February before then suffering a mild set back in March when about 7k jobs were lost. Very little slack has been emerging in the job market as the unemployment rate has risen from a low of 3.5% in this cycle to 3.8% in March alongside a slight increase in the labour force participation rate.
Asia-Pacific—Chinese and Japanese Economies in Focus
There will be macro three focal points across Asia-Pacific markets.
First is how China’s economy is tracking during Q2. After tracking growth of 1.6% q/q SA nonannualized in Q1 with upward revisions that modestly beat consensus expectations, we now shift to tracking Q2 growth. On Thursday, China will update industrial output, retail sales, investment figures, and the jobless rate for April. These figures are collectively expected to accelerate in year-over-year terms. In addition to tracking actual outcomes we’ll have to convert them to month-over-month momentum signals. China is also expected to report credit and financing figures for April by mid-week.
Second is India’s inflation rate on Monday and ahead of the June 7th decision by the Reserve Bank of India. The RBI is expected to extend its policy rate hold at that meeting at 6.5% where it has been since February 2023. Inflation is expected to hold steady at about 4.8%.
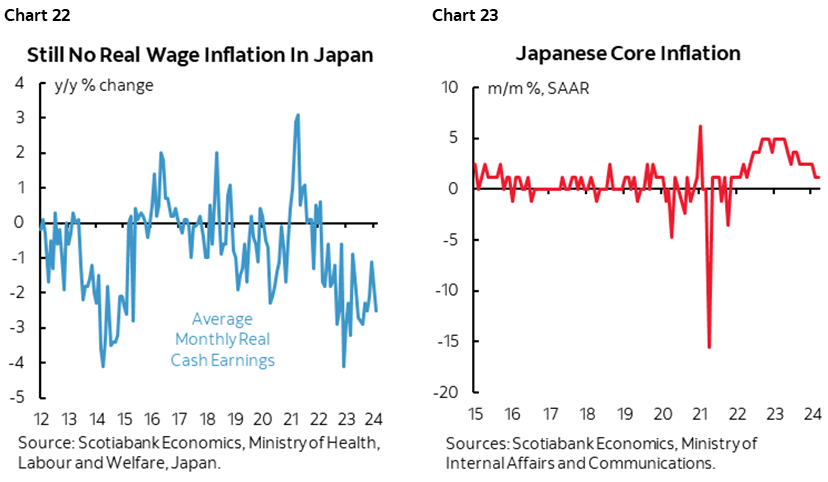
Third is that Japan updates Q1 GDP on Wednesday. The economy is expected to contract with most estimates ranging from -0.1% q/q to -0.8%. That would make it three quarters in a row of no growth in Japan’s economy after 0.1% q/q in Q4 and -0.8% in Q3. A weak economy, no evidence that Shunto wage gains to date that affect less than 20% of workers are driving improvement in aggregate real wages (chart 22), falling core inflation (chart 23) and a pushed-out Fed should generate greater caution by BoJ Governor Ueda who speaks in increasingly aggressive ways about potentially tightening policy to counter yen softness.
Europe Focused on Job Markets
Readings on UK jobs and wages (Tuesday) and Eurozone employment during Q1 (Wednesday) will dominate an otherwise light European calendar.
Eurozone employment has been growing by over 1% y/y up to the end of 2023 which returns to the pre-pandemic pace. A string of 11 consecutive quarterly gains is at stake as growth has slowed. Given the correlations between economic growth and job growth there could be further weakening in store. Eurozone Q1 GDP growth of 0.3% q/q SA may be revised on Wednesday.
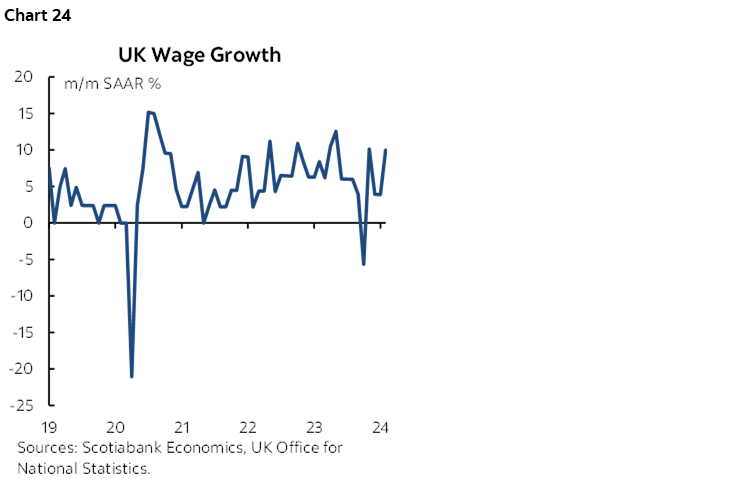
A wholesale update on the state of the UK job market lands on Tuesday in the wake of the market’s dovish reaction to Bank of England communications. Hot wages (chart 24) will be updated with March data along with total employment, and payroll figures will be updated for April after a 67k prior drop. Persistent wage pressure challenges the ability to bring inflation durably down to 2% after the BoE said it would hit 2% in the near-term but begin rising again later in the year. Markets are presently pricing about 15bps of a quarter point cut at the June 20th meeting and with two more inflation reports to go before then.
Other releases will include German ZEW investor confidence for May (Tuesday) that kicks off another monthly round of soft sentiment data. Q1 Norwegian GDP (Thursday) and Swedish CPI during April (Wednesday) following the Riksbank’s rate cut will round out the calendar.
Latin America’s Light Calendar
US CPI will offer ripple effects through LatAm markets that will otherwise face three calendar-based forms of risk as the June 2nd Mexican election draws nearer.
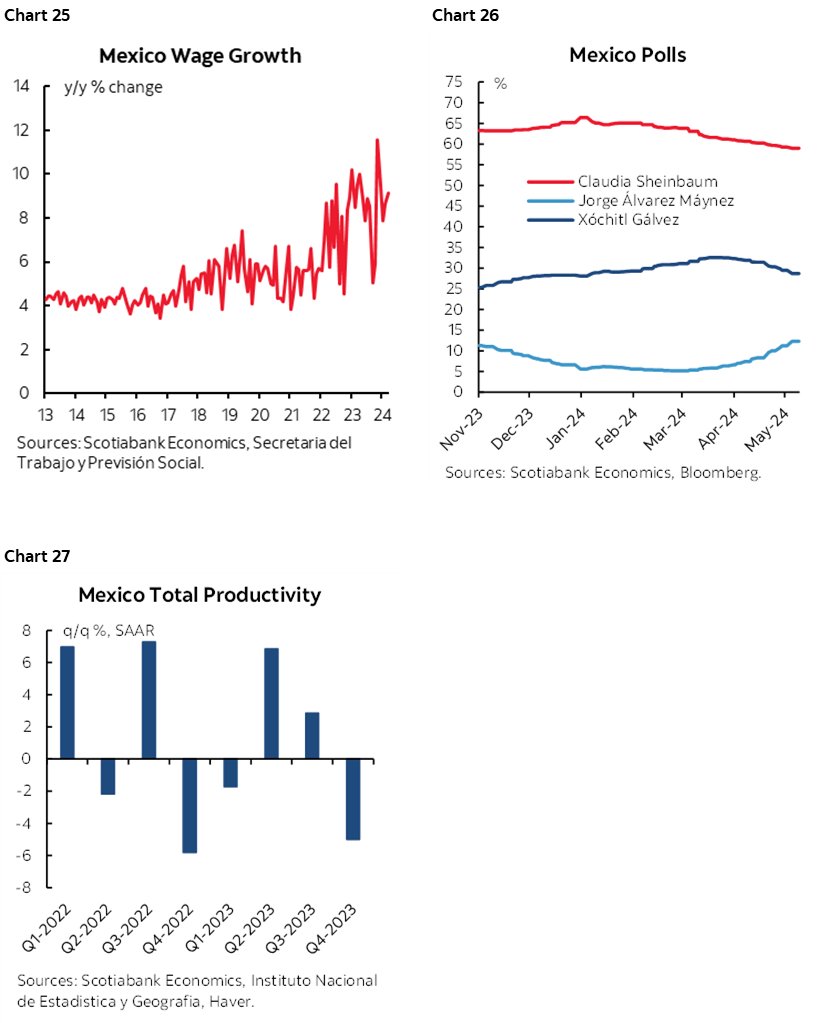
Mexico updates wage growth for April sometime by mid-week. Nominal wage growth has been accelerating over recent years and pressuring Banxico’s 2% inflation target (chart 25). A 20% increase in Mexico’s minimum wage kicked in back in January on the path to the election with current polling indicating that President Andrés Manuel López Obrador’s (AMLO) party, Morena, and its candidate, Claudia Sheinbaum, in the lead to succeed AMLO (chart 26). That wage increase may continue to filter through overall wages. Mexico’s wage gains are not supported by recent productivity (chart 27).
Colombia’s economy has posted little to no growth over the second half of 2023. Q1 GDP on Wednesday will hopefully put an end to that nonsense. Our Bogota-based economist Jackeline Pirajan expects growth to land at 1.1% q/q SA for the strongest reading since Q1 of last year.
The focus will also be on Peru’s economy this week when its monthly economic activity index is released for March on Wednesday. GDP is expected to grow by about 0.3% y/y according to our Lima-based economist Guillermo Arbe which would be slower than the 2.85% prior reading but primarily because of a shift in year-ago base effects that result in comparing to a stronger month a year ago than was the case for the prior month.

DISCLAIMER
This report has been prepared by Scotiabank Economics as a resource for the clients of Scotiabank. Opinions, estimates and projections contained herein are our own as of the date hereof and are subject to change without notice. The information and opinions contained herein have been compiled or arrived at from sources believed reliable but no representation or warranty, express or implied, is made as to their accuracy or completeness. Neither Scotiabank nor any of its officers, directors, partners, employees or affiliates accepts any liability whatsoever for any direct or consequential loss arising from any use of this report or its contents.
These reports are provided to you for informational purposes only. This report is not, and is not constructed as, an offer to sell or solicitation of any offer to buy any financial instrument, nor shall this report be construed as an opinion as to whether you should enter into any swap or trading strategy involving a swap or any other transaction. The information contained in this report is not intended to be, and does not constitute, a recommendation of a swap or trading strategy involving a swap within the meaning of U.S. Commodity Futures Trading Commission Regulation 23.434 and Appendix A thereto. This material is not intended to be individually tailored to your needs or characteristics and should not be viewed as a “call to action” or suggestion that you enter into a swap or trading strategy involving a swap or any other transaction. Scotiabank may engage in transactions in a manner inconsistent with the views discussed this report and may have positions, or be in the process of acquiring or disposing of positions, referred to in this report.
Scotiabank, its affiliates and any of their respective officers, directors and employees may from time to time take positions in currencies, act as managers, co-managers or underwriters of a public offering or act as principals or agents, deal in, own or act as market makers or advisors, brokers or commercial and/or investment bankers in relation to securities or related derivatives. As a result of these actions, Scotiabank may receive remuneration. All Scotiabank products and services are subject to the terms of applicable agreements and local regulations. Officers, directors and employees of Scotiabank and its affiliates may serve as directors of corporations.
Any securities discussed in this report may not be suitable for all investors. Scotiabank recommends that investors independently evaluate any issuer and security discussed in this report, and consult with any advisors they deem necessary prior to making any investment.
This report and all information, opinions and conclusions contained in it are protected by copyright. This information may not be reproduced without the prior express written consent of Scotiabank.
™ Trademark of The Bank of Nova Scotia. Used under license, where applicable.
Scotiabank, together with “Global Banking and Markets”, is a marketing name for the global corporate and investment banking and capital markets businesses of The Bank of Nova Scotia and certain of its affiliates in the countries where they operate, including; Scotiabank Europe plc; Scotiabank (Ireland) Designated Activity Company; Scotiabank Inverlat S.A., Institución de Banca Múltiple, Grupo Financiero Scotiabank Inverlat, Scotia Inverlat Casa de Bolsa, S.A. de C.V., Grupo Financiero Scotiabank Inverlat, Scotia Inverlat Derivados S.A. de C.V. – all members of the Scotiabank group and authorized users of the Scotiabank mark. The Bank of Nova Scotia is incorporated in Canada with limited liability and is authorised and regulated by the Office of the Superintendent of Financial Institutions Canada. The Bank of Nova Scotia is authorized by the UK Prudential Regulation Authority and is subject to regulation by the UK Financial Conduct Authority and limited regulation by the UK Prudential Regulation Authority. Details about the extent of The Bank of Nova Scotia's regulation by the UK Prudential Regulation Authority are available from us on request. Scotiabank Europe plc is authorized by the UK Prudential Regulation Authority and regulated by the UK Financial Conduct Authority and the UK Prudential Regulation Authority.
Scotiabank Inverlat, S.A., Scotia Inverlat Casa de Bolsa, S.A. de C.V, Grupo Financiero Scotiabank Inverlat, and Scotia Inverlat Derivados, S.A. de C.V., are each authorized and regulated by the Mexican financial authorities.
Not all products and services are offered in all jurisdictions. Services described are available in jurisdictions where permitted by law.