Next Week's Risk Dashboard
- US mid-terms and markets
- US CPI is likely to be hot again
- Mixed progress across global supply chains
- BoC’s Macklem to speak on jobs after blow-out
- Chinese core inflation likely to remain cool
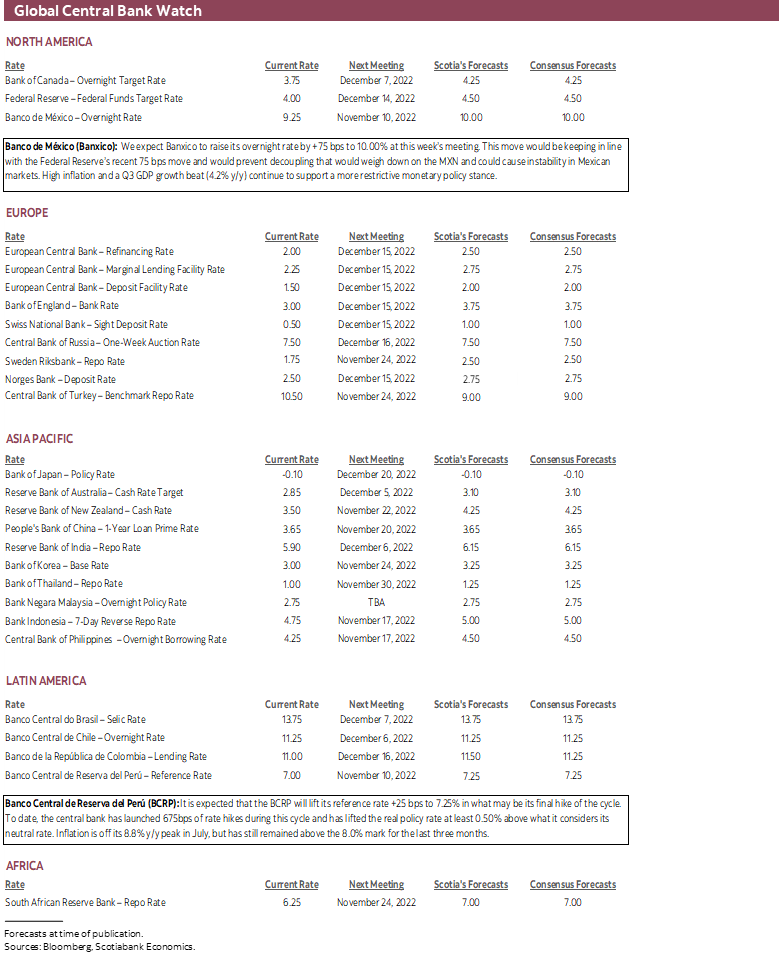
- Banxico to keep pace with the Fed
- Peru’s CB likely to hike again
- UK economy probably contracted
- LatAm, Asian inflation
- Other macro
Chart of the Week
A lighter than usual week across global markets and Friday’s Remembrance Day might give time to market participants to reflect upon the varied sources of geopolitical risk that have the world on edge and that could risk repeating history. The main events will be US inflation, US mid-term elections, inflation reports across other countries including China, a pair of LatAm central bank decisions and plenty of jawboning by central bank officials.
US INFLATION ISN’T COOLING YET
The path to the next Fed decision including full forecasts on December 14th will focus upon a pair of inflation reports and a pair of US job market readings including wage figures. CPI for October kicks it off on Thursday and it’s likely to be another hot one.
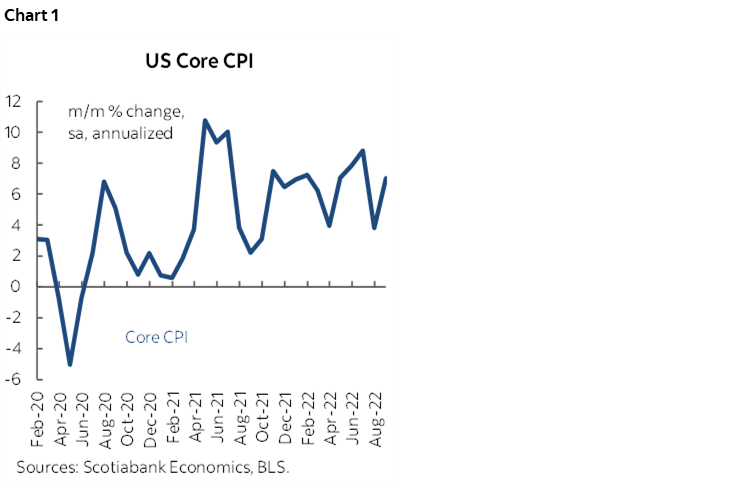
In fact, this could be the eleventh time in the past thirteen months that core CPI will have posted month-over-month seasonally adjusted gains of 0.5% or more. The annualized rate remains far above the Fed’s 2% headline target with no signs of cooling (chart 1).
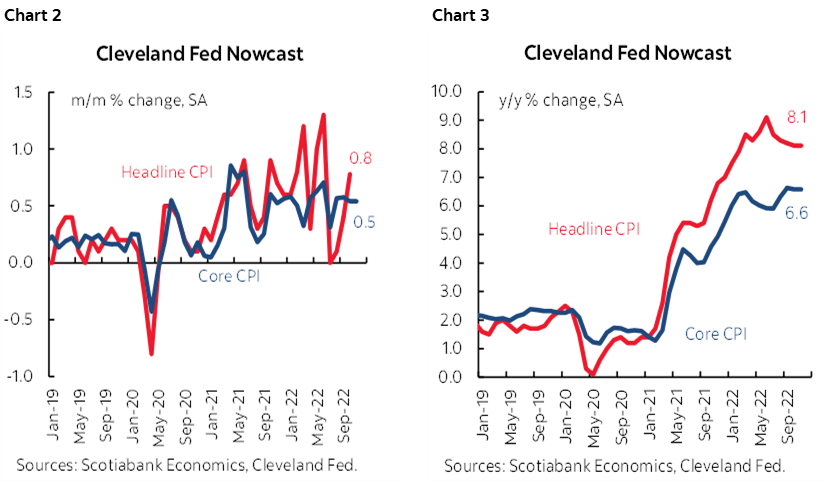
In this case, I’ve estimated 0.6% m/m SA and 6.6% y/y core CPI readings with headline CPI expected to rise by 0.8% m/m SA and 8.1% y/y (from 8.2% prior). The Cleveland Fed’s ‘nowcasts’ are shown in charts 2 and 3. They can recently tend to underestimate price changes and even at that they are showing very hot readings for headline and core CPI in month-over-month terms.
Among the expected drivers are the following factors:
- If nothing else changed other than year-ago base effects then the rate of inflation would ebb from 8.2% y/y in September to 7.3% in October. It’s vital to look through this toward the incremental price pressures in month-over-month seasonally adjusted and annualized terms.
- October tends to be a seasonal up-month for unadjusted prices as input into the year-over-year rate. I figure this seasonality would lift the year-over-year rate toward 7.6% y/y.
- Gas prices pushed higher by an estimated 3.7% m/m NSA which is more than is seasonally normal and so the seasonally adjusted gain was closer to 5% m/m.
- Natural gas prices fell sharply including Henry Hub spot prices that declined by about 17% m/m NSA and this can be a very rough guide to the piped fuels category, but a) it doesn’t all flow through CPI in a single month, b) there are other fuels in that category, and c) there is only a 1% weight attached to it.
- Used vehicle prices declined a bit, but the modest 4% weight on the category probably means at most a 0.1 ppt weighted drag on total CPI
- New vehicle prices were very little changed and should be a negligible effect on total CPI.
- Food retail prices are expected to remain hot in a continuation of large gains dating back to early 2021.
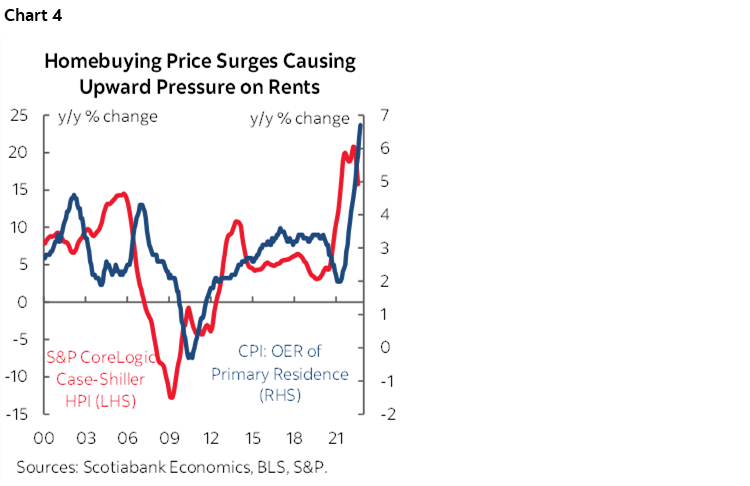
- Shelter costs—namely owners equivalent rent—will probably remain hot but with lagging downside effects of slipping repeat-sale house prices probably ahead into 2023 (chart 4).
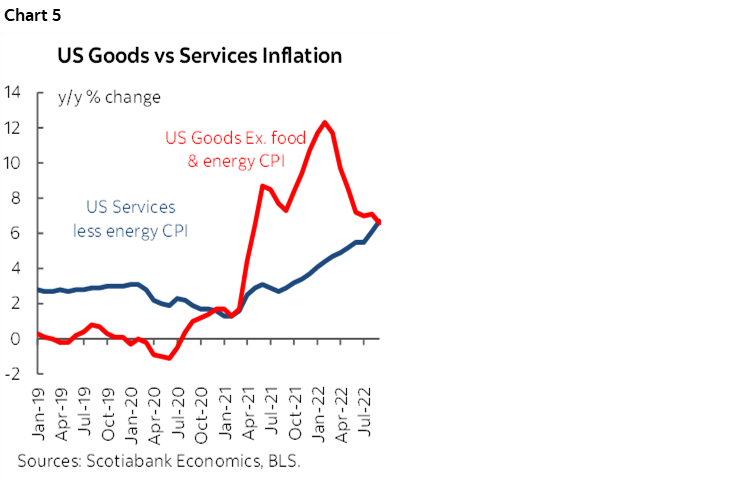
- A major driver, however, is likely to be ongoing strong gains in service price inflation. Services carry about a 60% weight in the basket. Strip out shelter which is about half of that and includes OER and also remove the 3.7% weight on energy services and ‘core’ services comprise about one-quarter of the CPI basket. The normalization of activity around this sector combined with unique challenges such as staffing and capacity issues continues to drive hot inflation (chart 5).
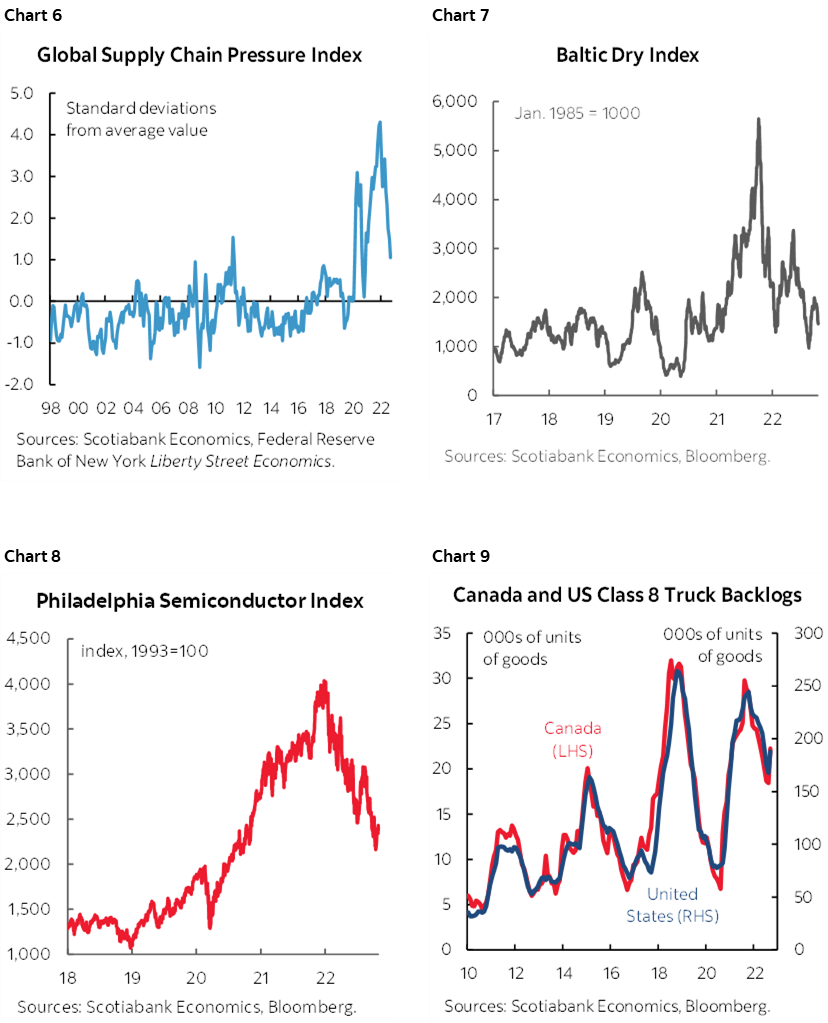
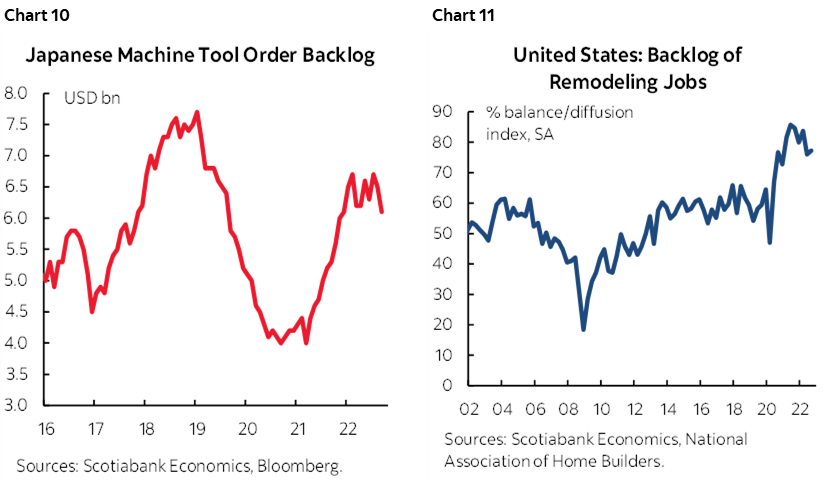
Against the backdrop of the latest inflation wiggles is the issue of whether or not supply chains continue to improve. On balance they are, but unevenly so. Ocean transit times have continued to decline for Transpacific eastbound traffic, but less so for traffic coming in the other direction (here) which highlights sensitivities around whether or not China is indeed on the cusp of easing its Covid Zero policy stance which so far seems to be more rumour than fact. Chart 6 shows another measure from the NY Fed that indicates lessening pressures upon global supply chains. The Baltic Dry index (chart 7) has fallen in part due to lessening supply chain pressures but also probably softening demand. Chart 8 shows that semiconductor prices are well off the peak but still significantly above pre-pandemic levels, though in my long held view likely on the path to a classic repeat of the sector’s boom-bust pattern. Heavy truck backlogs have improved but are still high (chart 9) and there hasn’t really been any improvement in backlogs for Japanese machine tool orders (chart 10). Last, home remodellers probably still have to patiently hand over their wallets (chart 11).
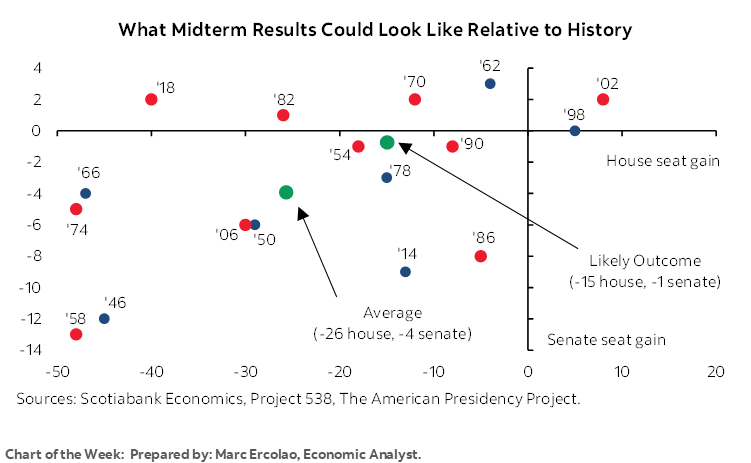
US MID-TERMS AND MARKETS
There once was a time when the US electoral cycle was rivalled perhaps only by Italy and Japan in terms of the frequency of major elections but that at least the US President was in power for a four year term with mid-terms shaking things up halfway through. That’s less the case now as Italy and Japan continue to churn through leaders and with the UK joining them as it embraces its fourth prime minister since the Brexit vote alongside Canada’s two failed attempts at turning a minority government into a majority.
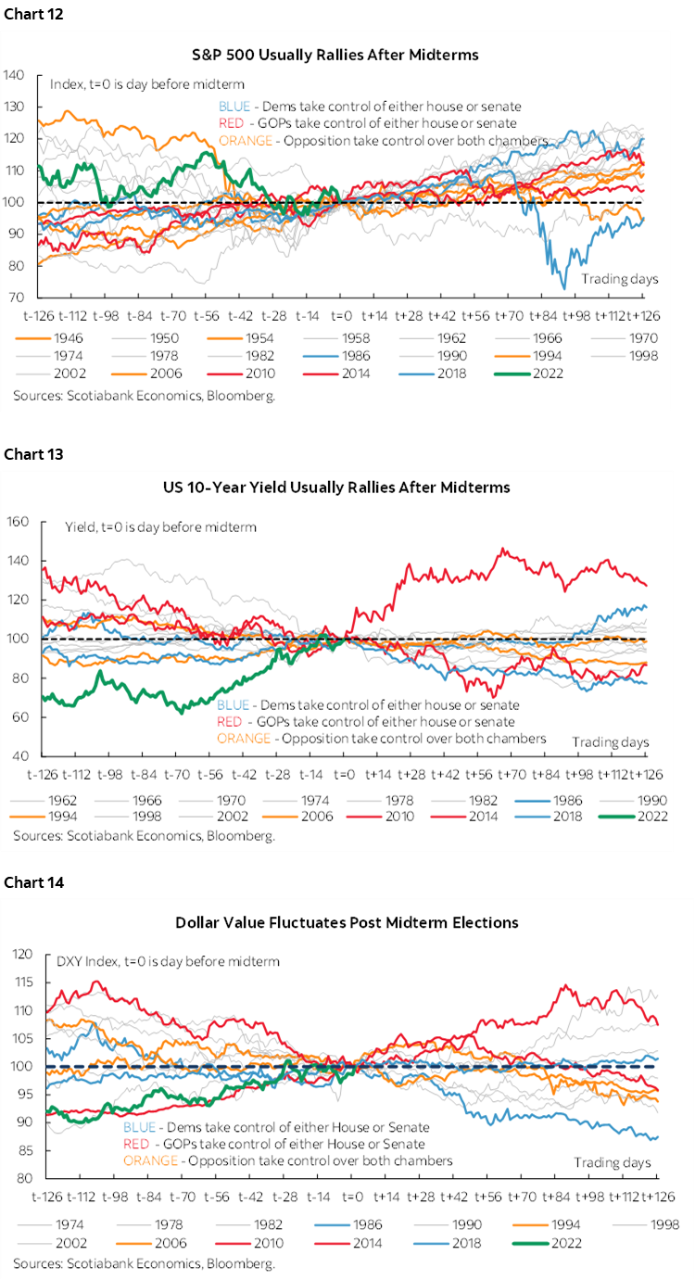
There is some evidence that markets can tend to react to mid-term election outcomes in the US, but it requires a fair amount of patience and a lot of uncertainty around why this might be true beyond merely spurious reasons. See charts 12–14 on the next separate page. Chart 12 shows that equity markets tend to soften into mid-terms (time t=0) and then tend to rally into the aftermath. The US 10 year Treasury yield tends to decline in the long aftermath of mid-terms (chart 13). The USD on a DXY basis tends to be rather mixed (chart 14). I wouldn’t say there is much by way of a rigorous explanation for these moves, but perhaps markets welcome the greater check on the incumbent administration’s powers and look forward to fresher ideas into the ensuing Presidential election.
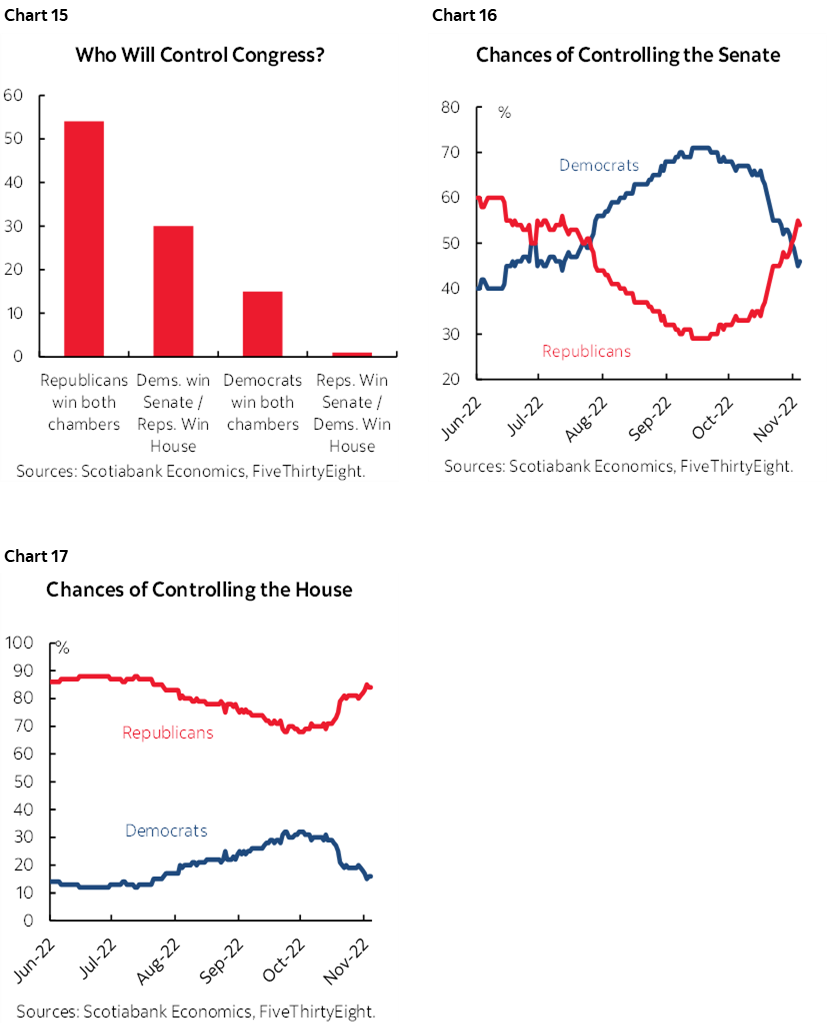
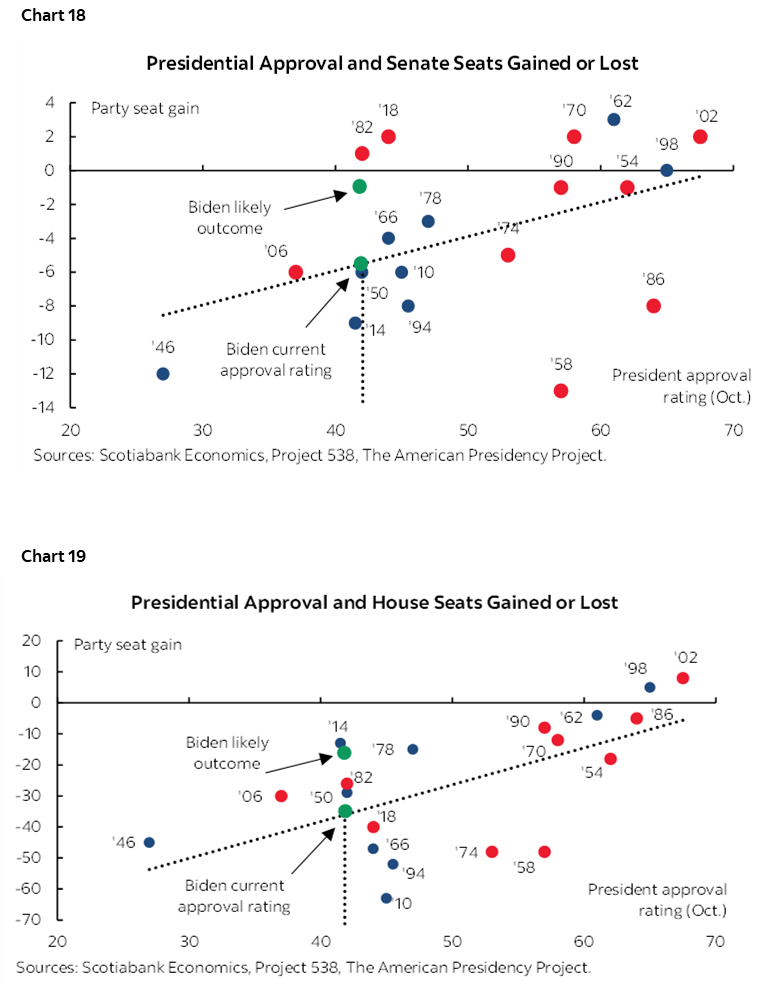
As for what to expect, the folks at fivethirtyeight.com—so named for the number of electors in the US electoral college—have been at their modelling for some time. Their latest projections for the House and the Senate are available here and shown in charts 15–17. Charts 18 and 19 look at how the Biden administration could fare in the Senate and House based upon where his current polling stands by comparison to past mid-term elections. Who gets control of the Senate is a very close contest, while the Republicans’ changes of picking up seats in the House have recently improved.
CENTRAL BANKS—ALL TALK, LITTLE ACTION
The week is full of speaking appearances across the Fed, ECB and BoE but there are only two central bank decisions on tap.
Banxico is widely expected to hike by another 75bps on Thursday as it generally follows the Fed. The FOMC’s more hawkish stance this past week is likely to keep Mexico’s central bank on a tightening path into at least early 2023 especially as growth is so far resilient after Q3 GDP climbed by 1% q/q (0.8% consensus). The October inflation report the day before the policy decision is expected to remain hot in month-over-month terms.
Peru’s central bank is also expected to raise its reference rate by another 25bps on Thursday in the final, final, no really, this time we mean it—final hike of the cycle. The FOMC’s hawkish pivot could raise pressure upon the sol and hence imported inflation if BCRP does not continue to tighten notwithstanding its cumulative tightening to date.
DID CANADA’S JOBS BLOW-OUT AFFECT THE BoC’S THINKING?
The only thing on Canada’s calendar will be another speech by Bank of Canada Governor Macklem on Thursday. His topic will be “The evolution of Canadian labour markets” which is rather fitting in the wake of a blow-out jobs report (recap here). Guidance points to both short-term and longer-term trends that will be addressed. His speech will be available at 11:50amET and there will be a press conference afterward. The timing is a bit awkward from a market standpoint given the 1pmET bond market closure that day ahead of the Remembrance Day holiday the next day.
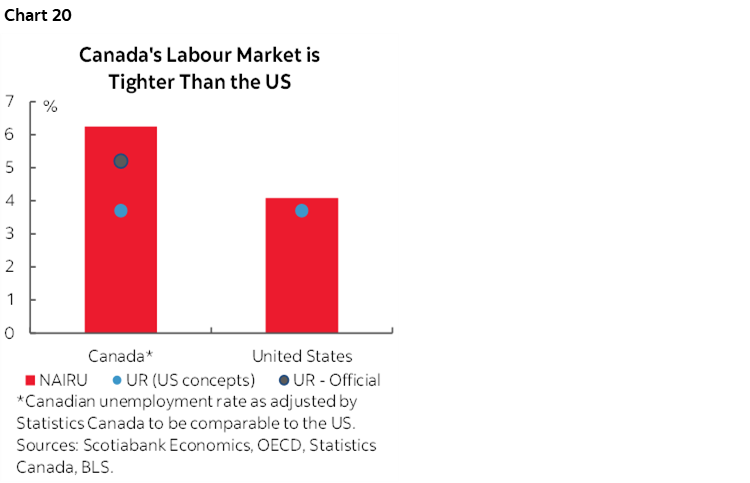
Obviously a key risk is whether the blow out with 108k jobs created and the acceleration of wage growth impacted his thinking toward the risk of a wage-price spiral. Regular readers know that I’ve been pounding the table on trend Canadian wage growth for a long time back now and stretching back into 2021 and so I continue to think Canada has greater wage pressures than the US. The fact that the job market is tighter in Canada than in the US as indicated by the unemployment rate’s distance beneath the longer-run equilibrium rate of unemployment is one reason for this (chart 20). Canada has had explosive wage growth in 12 of the past sixteen months while turning in awful relative productivity performance compared to the US. It’s a stretch to dismiss a long trend of powerful wage gains as just a unique transitory (not that word again….) function of the pandemic versus, say, today’s different demographics and the uncertainty and public policy mixture that restrains private investment.
OTHER DEVELOPMENTS
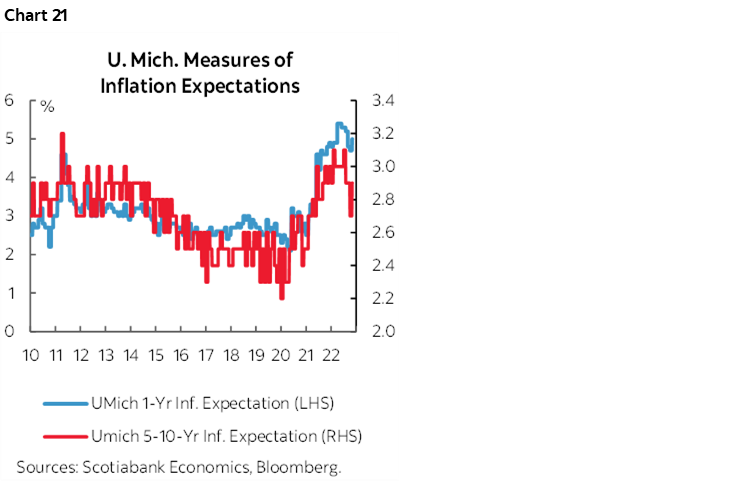
US markets will be dominated by CPI and mid-terms, with just the University of Michigan’s consumer sentiment reading on tap for Friday. Given today’s context, the main focus is likely to be upon consumers’ inflation expectations that had been slightly ebbing until the increase in October (chart 21). There will also be a whole host of Fed-speak on tap with the focus being upon the variety of opinions around the issues raised in Chair Powell’s hawkish press conference (recap here). Chief among them is agreement around how much higher the terminal rate might need to go given guidance that the September ‘dot plot’ is likely to be raised in the December version.
A spate of other global inflation reports will keep the topic front and center across global markets.
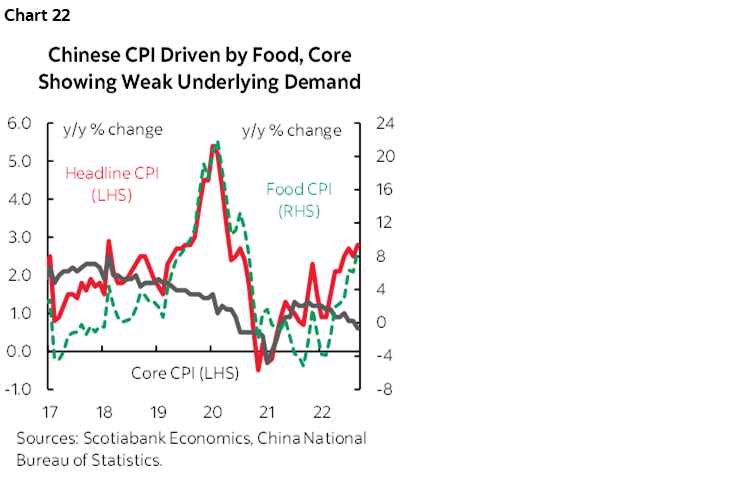
- China will update CPI on Tuesday. A cooler year-over-year pace might result from a higher year-ago base effect but the volatile trend pace of month-over-month gains has been fairly subdued and with food playing a major role (chart 22).
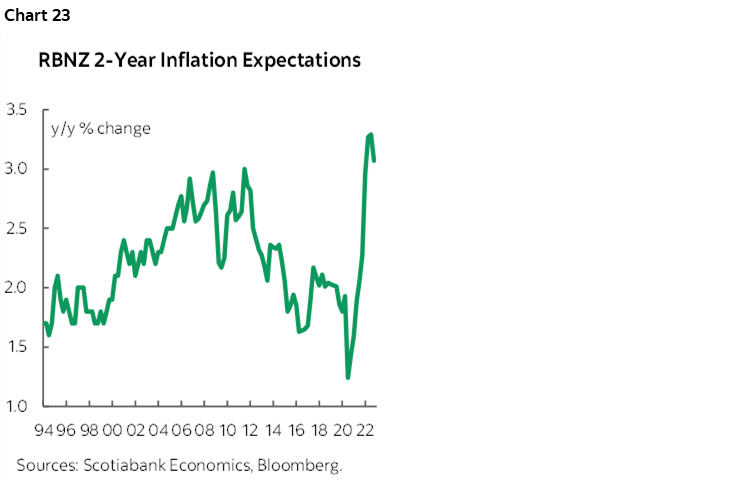
- The RBNZ measure of two-year ahead inflation expectations will be updated with the Q4 reading on Monday. It pulled back a bit in Q3 but remained well above the central bank’s 2% inflation target (chart 23). If it does likewise this time, or even higher, then it would add to concerns about inflationary pressures and the future pace of RBNZ tightening in the wake of the stronger than expected Q3 wage figures.
- LatAm markets will bring out CPI updates for October from Colombia (Saturday), Chile (Tuesday), Mexico (Wednesday) and Brazil (Thursday). The year-ago rates are expected to ebb for all but Colombia while month-ago rates of inflation should be elevated.
- Watch Norway’s latest underlying inflation reading (ie: ex-energy and taxes) for October (Thursday) after the prior report double consensus expectations for total CPI with a rise of 1.4% m/m and with underlying inflation landing at 1%.
Otherwise the line-up will be pretty light. China reports October exports into Monday’s markets and along with continued speculation and/or actual developments around relaxing Covid Zero policies (or not…) will further inform the strong equity market rally over the past week. The UK economy is expected to shrink when Q3 GDP arrives on Friday along with a batch of readings for September that will inform momentum into Q4. Indonesia (Sunday), Philippines (Wednesday) and Malaysia (Thursday) update Q3 GDP.

DISCLAIMER
This report has been prepared by Scotiabank Economics as a resource for the clients of Scotiabank. Opinions, estimates and projections contained herein are our own as of the date hereof and are subject to change without notice. The information and opinions contained herein have been compiled or arrived at from sources believed reliable but no representation or warranty, express or implied, is made as to their accuracy or completeness. Neither Scotiabank nor any of its officers, directors, partners, employees or affiliates accepts any liability whatsoever for any direct or consequential loss arising from any use of this report or its contents.
These reports are provided to you for informational purposes only. This report is not, and is not constructed as, an offer to sell or solicitation of any offer to buy any financial instrument, nor shall this report be construed as an opinion as to whether you should enter into any swap or trading strategy involving a swap or any other transaction. The information contained in this report is not intended to be, and does not constitute, a recommendation of a swap or trading strategy involving a swap within the meaning of U.S. Commodity Futures Trading Commission Regulation 23.434 and Appendix A thereto. This material is not intended to be individually tailored to your needs or characteristics and should not be viewed as a “call to action” or suggestion that you enter into a swap or trading strategy involving a swap or any other transaction. Scotiabank may engage in transactions in a manner inconsistent with the views discussed this report and may have positions, or be in the process of acquiring or disposing of positions, referred to in this report.
Scotiabank, its affiliates and any of their respective officers, directors and employees may from time to time take positions in currencies, act as managers, co-managers or underwriters of a public offering or act as principals or agents, deal in, own or act as market makers or advisors, brokers or commercial and/or investment bankers in relation to securities or related derivatives. As a result of these actions, Scotiabank may receive remuneration. All Scotiabank products and services are subject to the terms of applicable agreements and local regulations. Officers, directors and employees of Scotiabank and its affiliates may serve as directors of corporations.
Any securities discussed in this report may not be suitable for all investors. Scotiabank recommends that investors independently evaluate any issuer and security discussed in this report, and consult with any advisors they deem necessary prior to making any investment.
This report and all information, opinions and conclusions contained in it are protected by copyright. This information may not be reproduced without the prior express written consent of Scotiabank.
™ Trademark of The Bank of Nova Scotia. Used under license, where applicable.
Scotiabank, together with “Global Banking and Markets”, is a marketing name for the global corporate and investment banking and capital markets businesses of The Bank of Nova Scotia and certain of its affiliates in the countries where they operate, including; Scotiabank Europe plc; Scotiabank (Ireland) Designated Activity Company; Scotiabank Inverlat S.A., Institución de Banca Múltiple, Grupo Financiero Scotiabank Inverlat, Scotia Inverlat Casa de Bolsa, S.A. de C.V., Grupo Financiero Scotiabank Inverlat, Scotia Inverlat Derivados S.A. de C.V. – all members of the Scotiabank group and authorized users of the Scotiabank mark. The Bank of Nova Scotia is incorporated in Canada with limited liability and is authorised and regulated by the Office of the Superintendent of Financial Institutions Canada. The Bank of Nova Scotia is authorized by the UK Prudential Regulation Authority and is subject to regulation by the UK Financial Conduct Authority and limited regulation by the UK Prudential Regulation Authority. Details about the extent of The Bank of Nova Scotia's regulation by the UK Prudential Regulation Authority are available from us on request. Scotiabank Europe plc is authorized by the UK Prudential Regulation Authority and regulated by the UK Financial Conduct Authority and the UK Prudential Regulation Authority.
Scotiabank Inverlat, S.A., Scotia Inverlat Casa de Bolsa, S.A. de C.V, Grupo Financiero Scotiabank Inverlat, and Scotia Inverlat Derivados, S.A. de C.V., are each authorized and regulated by the Mexican financial authorities.
Not all products and services are offered in all jurisdictions. Services described are available in jurisdictions where permitted by law.