ON DECK FOR TUESDAY, DECEMBER 15

KEY POINTS:
- Risk appetite stabilizes
- BoC’s Macklem in focus
- Canada is driving housing imbalances and inflation…
- ...with vaccines and more federal stimulus ahead…
- ...that should can talk of further BoC easing
- Ex-utilities US industrial output posts a strong gain
- Canadian manufacturing softens
INTERNATIONAL
Risk appetite has stabilized this morning absent material new catalysts. Hours ahead of Governor Macklem’s traditional pre-holiday speech we got an overall set of readings on the Canadian economy that may inform the emergence of at least partly policy-driven imbalances that merit taking a breather before reassessing in the new year.
- US and Canadian equities are up by about ½%. European exchanges are mixed with London down ½% (on sterling’s Brexit-related rise), Paris flat, and the Dax up by just under 1%.
- The USD is mildly softer today as sterling, the yen and Mexican peso lead appreciating crosses.
- Sovereign curves are mildly cheaper in the US, UK and Canada while Italian and peripheral spreads narrow over bunds.
- Oil prices are up by three or four dimes in terms of WTI and Brent.
Chinese macro readings landed bang on expectations. Industrial output was up by 7% y/y in November and retail sales grew by 5% y/y. The PBOC left the 1 year Medium-term Lending Facility rate unchanged at 2.95% as confirmation of expectations for the 1-year and 5-year Loan Prime Rates to be left unchanged next week.
UK jobs data came in a bit better than expected, but the fact it’s for October in the face of forward-looking risks resulted in it being largely ignored by sterling and gilts. The unemployment rate was 4.9% (5.1% consensus, 4.8% prior) as 143k jobs were lost on a rolling three-month change basis (consensus -250k). Wage growth bounced back by more than expected (2.8% y/y, 1.9% prior, 2.6% consensus).
CANADA
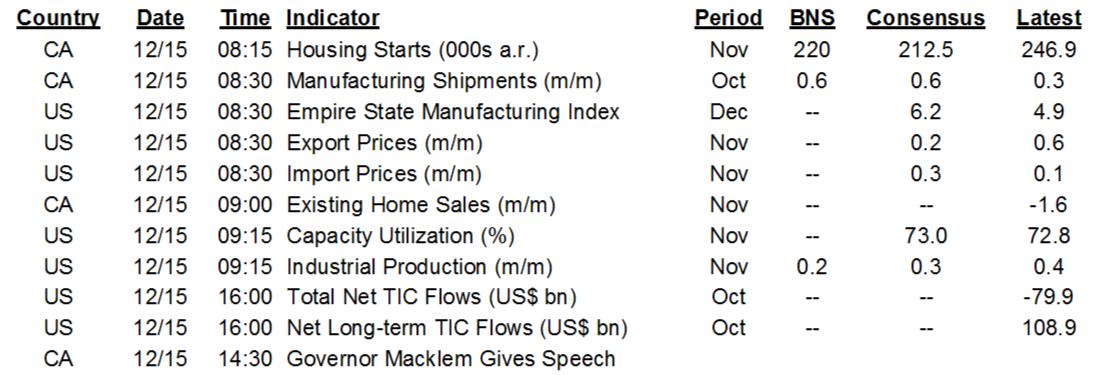
The main focus on this side of the pond will be BoC Governor Macklem’s speech (2:30pmET) and presser (3:45pmET) this afternoon. See last night’s Closing Points (here) for expectations.
A trio of releases posed low market risk but in an indirect way shed light on a part of the country’s inflationary pressures.
Canadian housing starts beat expectations by rising to 246k in November at a seasonally adjusted and annualized rate for the strongest gain since August. Multiple housing units including condos drove the 14% m/m rise with British Colombia and Quebec driving most of it. More details if interested.
Canadian existing home sales slipped by 1.6% m/m in November for the second straight decline. The biggest challenge here is the lack of product to buy. As chart 1 demonstrates, there basically isn’t any. Months’ supply fell to just 2.4 months which is an all-time low driven by soaring sales that have outpaced growth in new listings during what has shaped up to be a record year for existing home sales. At that low level, you’re basically seeing a minimal flow of new listings being snapped up the second they hit the market. The tight inventories in the resale segment are driving strong housing starts as the housing stock is under pressure to expand. Tight resale markets are driving activity into the new home segment.

In classic fashion, however, public policy is putting upward pressure on demand as supply lags. Raising immigration targets seeks to catch-up on prior lost immigration flows due to the pandemic and in a fairly short period of time. First time homebuyers incentives for people in the Toronto and Vancouver markets are being enhanced while moving toward a national foreign buyers tax that is likely to be a rounding error on housing demand compared to other drivers. Promising Canadians that rates will stay low for a dog’s age so go ahead and heap on massive debts while chasing soaring prices completes the picture of heavy housing demand stimulus while lagging supply creates imbalances. Witness chart 2 that compares repeat-sales house prices in Canada and the US.

Enter inflation. Shelter costs in CPI are up by 1.8% y/y as one of the stronger drivers along with food prices. What is driving shelter costs in CPI to be higher is the homeowners’ replacement cost component. That, in turn, is mostly driven by the house-only component of StatsCan’s new house price index (chart 3) as both of these readings shoot to the strongest gains since the acceleration that occurred over the 2016–17 period. That in turn happened as the lagging response after the BoC slashed borrowing costs in 2015 in response to the last transitory shock to hit the economy. The result was it over-heated housing.

Every time a shock arises, monetary policy throws gasoline onto housing supply imbalances and combines with stimulative demand-side policies. The BoC’s output gap framework serves as a blunt tool for assessing stimulus responses that naturally flow through in concentrated fashion to interest-sensitive sectors while arguably bringing forward competitiveness challenges to exporters and manufacturers. It’s like trying to solve all that ails the economy by the equivalent to sending Niagara Falls down a pea shooter. It’s easy to see an easing bias over this past year given mass under-utilization of resources measured in terms of unemployed Canadians and spare capacity, but there are still costs to this policy stance. Costs that drive housing to be less affordable with concomitant imbalances. Average core inflation sits at 1.8% y/y and inches from target as the operational guide to the 2% headline goalpost while housing markets are under pressure and both additional Federal fiscal stimulus and vaccines are in sight. Against that setting, the risk-reward calculus to further policy options shouldn’t even be speaking about easing possibilities in my view.
Canadian manufacturing shipments were up by just 0.3% m/m in value terms which fell a touch shy of StatsCan’s advance flash guidance that shipments probably climbed by 0.6% m/m. The whole report was fairly weak as shipment volumes were flat (ie: only a small rise in prices drove shipment values higher), new orders fell by 3.9% and unfilled orders in the pipeline fell by 2.3% m/m while the inventory-to-shipments ratio held little changed at a still elevated 1.6.
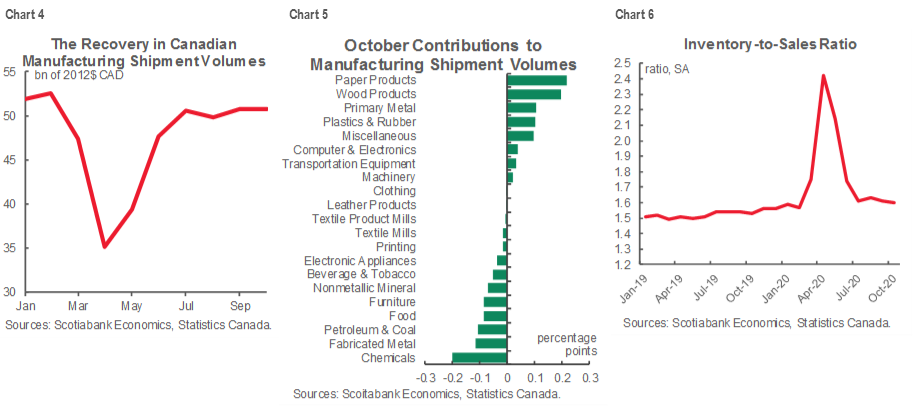
Chart 4 shows that following an initial recovery over the May–July period, shipment volumes have moved sideways since at roughly similar levels to that which existed before the pandemic struck. Chart 5 shows the weighted contributions to growth in shipment volumes during October over September by sector which indicates little breadth. Chart 6 shows the inventory-to-sales ratio and how it has come back down but remains a little above pre-pandemic levels.

UNITED STATES
A pair of US macro releases carried no real market impact.
The US Empire manufacturing gauge for December slipped a touch to 4.9 (6.3 prior). It’s a minor gauge on the path to the next ISM-manufacturing report in early January. The Richmond Fed and Philly Fed metrics usually offer more information to help firm up an ISM call.
US industrial output was up by 0.4% m/m in November (consensus 0.3%) but revised down a couple of ticks to a 0.9% m/m gain the prior month. Overall, the tally roughly met expectations but the details were robust after removing the effects of weather-driven utilities output that fell 4.3% m/m. Manufacturing was up another 0.8% m/m following a strong 1.1% prior gain for two back to back solid gains and generally a long string of gains for many months with September’s stall the only exception. Within manufacturing, autos were up 5.3% m/m, computers and electronics were up 1.1% m/m, and machinery slipped 0.5% m/m. Mining output also expanded by 2.3% m/m.

DISCLAIMER
This report has been prepared by Scotiabank Economics as a resource for the clients of Scotiabank. Opinions, estimates and projections contained herein are our own as of the date hereof and are subject to change without notice. The information and opinions contained herein have been compiled or arrived at from sources believed reliable but no representation or warranty, express or implied, is made as to their accuracy or completeness. Neither Scotiabank nor any of its officers, directors, partners, employees or affiliates accepts any liability whatsoever for any direct or consequential loss arising from any use of this report or its contents.
These reports are provided to you for informational purposes only. This report is not, and is not constructed as, an offer to sell or solicitation of any offer to buy any financial instrument, nor shall this report be construed as an opinion as to whether you should enter into any swap or trading strategy involving a swap or any other transaction. The information contained in this report is not intended to be, and does not constitute, a recommendation of a swap or trading strategy involving a swap within the meaning of U.S. Commodity Futures Trading Commission Regulation 23.434 and Appendix A thereto. This material is not intended to be individually tailored to your needs or characteristics and should not be viewed as a “call to action” or suggestion that you enter into a swap or trading strategy involving a swap or any other transaction. Scotiabank may engage in transactions in a manner inconsistent with the views discussed this report and may have positions, or be in the process of acquiring or disposing of positions, referred to in this report.
Scotiabank, its affiliates and any of their respective officers, directors and employees may from time to time take positions in currencies, act as managers, co-managers or underwriters of a public offering or act as principals or agents, deal in, own or act as market makers or advisors, brokers or commercial and/or investment bankers in relation to securities or related derivatives. As a result of these actions, Scotiabank may receive remuneration. All Scotiabank products and services are subject to the terms of applicable agreements and local regulations. Officers, directors and employees of Scotiabank and its affiliates may serve as directors of corporations.
Any securities discussed in this report may not be suitable for all investors. Scotiabank recommends that investors independently evaluate any issuer and security discussed in this report, and consult with any advisors they deem necessary prior to making any investment.
This report and all information, opinions and conclusions contained in it are protected by copyright. This information may not be reproduced without the prior express written consent of Scotiabank.
™ Trademark of The Bank of Nova Scotia. Used under license, where applicable.
Scotiabank, together with “Global Banking and Markets”, is a marketing name for the global corporate and investment banking and capital markets businesses of The Bank of Nova Scotia and certain of its affiliates in the countries where they operate, including; Scotiabank Europe plc; Scotiabank (Ireland) Designated Activity Company; Scotiabank Inverlat S.A., Institución de Banca Múltiple, Grupo Financiero Scotiabank Inverlat, Scotia Inverlat Casa de Bolsa, S.A. de C.V., Grupo Financiero Scotiabank Inverlat, Scotia Inverlat Derivados S.A. de C.V. – all members of the Scotiabank group and authorized users of the Scotiabank mark. The Bank of Nova Scotia is incorporated in Canada with limited liability and is authorised and regulated by the Office of the Superintendent of Financial Institutions Canada. The Bank of Nova Scotia is authorized by the UK Prudential Regulation Authority and is subject to regulation by the UK Financial Conduct Authority and limited regulation by the UK Prudential Regulation Authority. Details about the extent of The Bank of Nova Scotia's regulation by the UK Prudential Regulation Authority are available from us on request. Scotiabank Europe plc is authorized by the UK Prudential Regulation Authority and regulated by the UK Financial Conduct Authority and the UK Prudential Regulation Authority.
Scotiabank Inverlat, S.A., Scotia Inverlat Casa de Bolsa, S.A. de C.V, Grupo Financiero Scotiabank Inverlat, and Scotia Inverlat Derivados, S.A. de C.V., are each authorized and regulated by the Mexican financial authorities.
Not all products and services are offered in all jurisdictions. Services described are available in jurisdictions where permitted by law.

