- Chile: The path to moderation in the constitutional process continues
- Colombia: Q3 GDP growth beats, imports fall from high, economists revise inflation and BanRep rates higher
- Peru: Disappointingly low GDP growth in September… again
Colombia’s Fin Min and BanRep board member Ocampo speaks later today at 14.15ET at a Forbes event following yesterday’s stronger than expected Q3 GDP data and the bank’s economists survey that showed a further deviation in inflation expectations (see Colombia section below). Ocampo said yesterday that he expects inflation will slow to 7% in 2023—still well above the bank’s 2-4% target band. He also highlighted the decline in the market’s risk perception of Colombia, in line with a 100bps+ decline in 5-yr CDS spreads since the Oct 21 high, although the trend since spring remains positive (i.e., broad increase in aversion to Colombian assets).
Yesterday, despite strong data, the COP had its worst performance since early-month, shedding 0.75%—and lagging all its Latam peers for the week. The COP is lagging in the region with a 0.7% loss on the day after currencies had performed better overnight as the dollar broadly lost ground on some easing of fears around Russia’s war on Ukraine. Trading is volatile at writing, however, around the release of US retail sales data.
Brazilian markets reopen to news that Lula’s transition team is shifting back to an originally proposed BRL175bn carve-out for social spending from the fiscal cap for the Bolsa Familia programme. This is up from the USD130bn ‘compromise’ that Bloomberg had reported on Monday However, the proposal may be watered down from indefinitely to only a four-year period to meet the opposition ‘halfway’—as they think it should only be valid for the first year of Lula’s government.
—Juan Manuel Herrera
CHILE: THE PATH TO MODERATION IN THE CONSTITUTIONAL PROCESS CONTINUES
Negotiations between political parties remain on a path to an agreement that will allow the constitutional process to continue. Today, left-wing political parties will hold a new meeting to arrive with a single position for the negotiation with opposition parliamentarians on Friday, November 18th. Within the government coalition, indecision persists around the mechanism to elect the new constituent assembly and its composition. The proposal of a 100% elected assembly does not convince all the official parliamentarians, while the proposed inclusion of a group of experts appointed by Congress gains support. The new constitutional process, with the “boundaries” established by the centre/right-wing parties, will give no space for extreme proposals.
The path to moderation in the constitutional process continues. In our view, political uncertainty will slowly diminish, generating a better relative performance of Chilean assets.
—Aníbal Alarcón
COLOMBIA: Q3 GDP GROWTH BEATS, IMPORTS FALL FROM HIGH, ECONOMISTS REVISE INFLATION AND BANREP RATES HIGHER
Growth surprises to the upside again
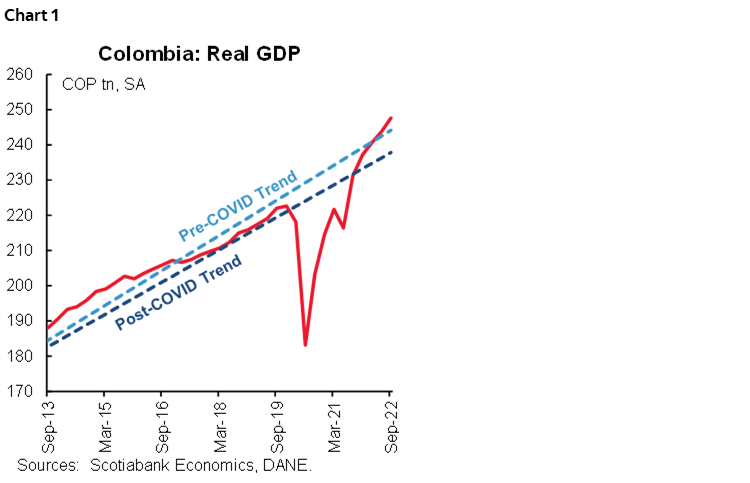
Data released on Tuesday from Colombia’s statistical agency, DANE, showed that Colombia’s real GDP grew by 7.0% y/y in 3Q-2022, above both the consensus (6.6% y/y according to Bloomberg) and our forecast of 5.3% y/y. Growth was +1.6% q/q on a seasonally adjusted basis (chart 1), with positive contributions from service-related sectors. The economy continues to surprise with its performance, showing a 9.4% y/y expansion so far this year. It is worth noting that economic activity remained robust, but its composition is different as private consumption moderated on a quarterly basis while investment rebounded.
The solid growth results reflect the positive response of the economy in all activities, especially those related to services, given that it has been a year with a calendar full of large-attendance events and the return of several typical festivities. Additionally, in-person activities in workplaces, schools, and sports venues also contributed.
On the demand side, private consumption continued above trend levels, however it contracted vs the previous quarter by 2.6% q/q sa, while investment picked up (+5.4% q/q sa), especially in machinery and to some degree in construction given the completion of some housing projects. That said, despite the high-inflation environment that has implied a further tightening of the monetary policy rate, economic activity remained solid.
Looking forward, while the expectation has been for consumption to slow to more sustainable levels, there have been some mixed signals as indicators such as retail sales remain strong. With these data in mind, our growth forecast for 2022 is 7.6% but with some upward bias if we continue to see similar dynamics in consumption, which may be explained by the good performance of remittances.
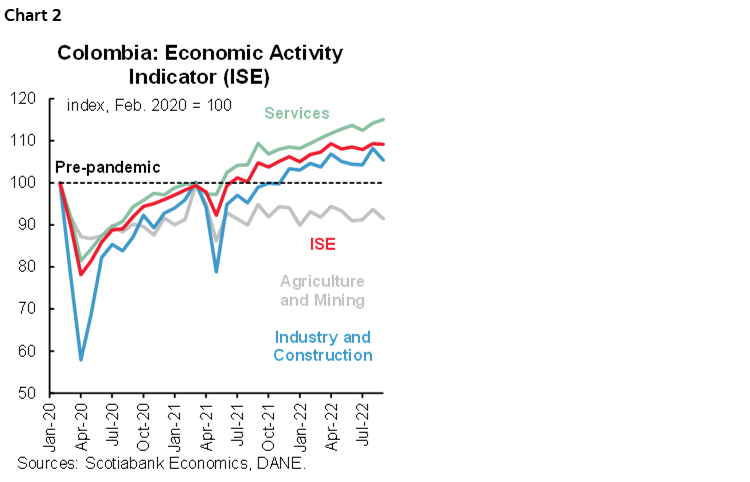
According to the monthly indicator (ISE), economic activity showed a positive but less strong expansion of 4.2% y/y in September (-0.1% m/m sa), growing by a robust 9.3% YTD and running 9.2% above the pre-pandemic high (chart 2). In September, the largest year-over-year gains came from leisure (46.9% y/y), commerce, transport and hotels (7.0% y/y), information and communications (12% y/y) and manufacturing industries (6.2% y/y). In seasonally adjusted monthly terms, leisure activities (13.3% m/m) were a strong contributor while on the negative side, construction (-9.2% m/m) and agriculture (-4.0% m/m) recorded the largest contractions.
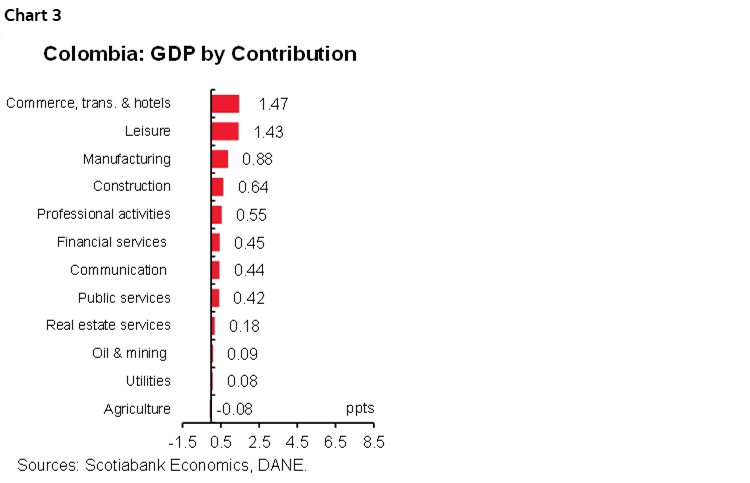
Regarding the Q3-2022 performance from the supply side, we highlight:
- The sectors that contributed the most to growth in the second quarter of the year were commerce, transportation and hospitality (1.6ppts), leisure (1.1ppts) and manufacturing (0.9ppts), accounting for 60% of total growth (chart 3).
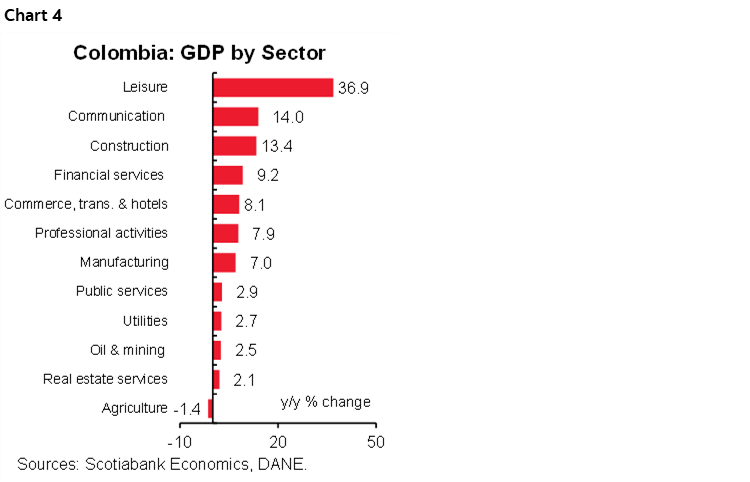
- All sectors grew during the second quarter of 2022 (chart 4), with the largest expansions coming from leisure (36.9% y/y), information and communications (14% y/y), commerce, transportation and hospitality (8.1% y/y) and manufacturing (7.0% y/y). The weakest performance during the quarter came from agriculture (-1.4 y/y) and mining (+2.5% y/y) explained by some declines in coal production and in agriculture due to high input costs and the winter wave affecting crops.
- The normalization of mobility and more large-attendance events are reflected in the dynamism of service-related sectors. On a seasonally adjusted basis, commercial activity showed a strong rebound (+7.5% q/q sa). On the flip side, the agricultural sector is weakening due to higher fertilizer costs and winter effects that have led to softness in the sector, which has increased pressures on inflation.
- The construction sector is also showing improved momentum in with a 4.9% q/q expansion which can be explained by improved housing construction. We expect that construction activity will remain robust and lead to higher growth for the rest of the year, despite higher interest rates and still costly inputs that may impact its performance to close out the year.
Expenditure side GDP Q3-2022:
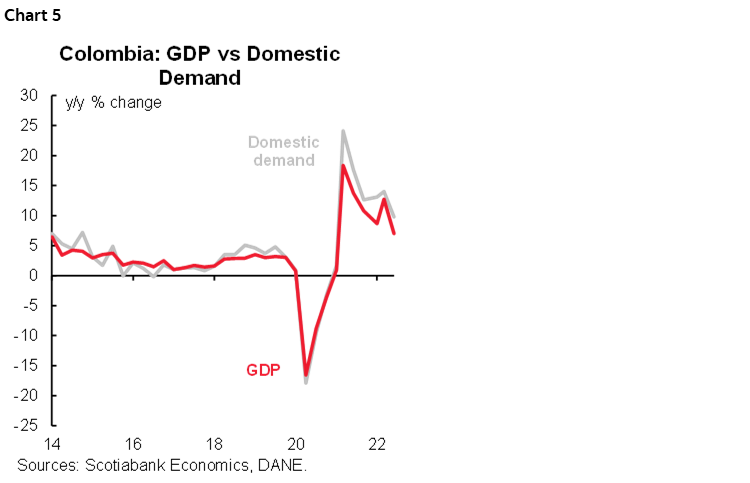
Domestic demand increased by 9.8% y/y in Q3-22 (chart 5), well above the total GDP expansion (7.0% y/y), pointing to a widening of the real external deficit. On a quarter-on-quarter basis, domestic demand expanded by 2.1%. In the quarter, the expansion in investment was more robust that the one in private demand, which was also reflected in higher imports.
- Private consumption (+7.8% y/y) contributed the most to overall growth (+5.7ppts) in Q3-22 (chart 6). In seasonally adjusted quarterly terms, private consumption registered a slowdown (-2.1% q/q) which may be explained by inflationary pressures and more expensive and less accessible credit. Public sector consumption increased by +1.6% y/y and was flat quarter-on-quarter reflecting the change of government and the low deployment of resources. Although consumption fell on the aggregate, it continues to add significantly to year-on-year growth while moderating through year-end due to persistent inflationary pressures and rate adjustments that imply an increase in the price of consumer credit. On the public spending side, in Q4-2022, it is possible that there will be some lower spending amid the start of a new government.
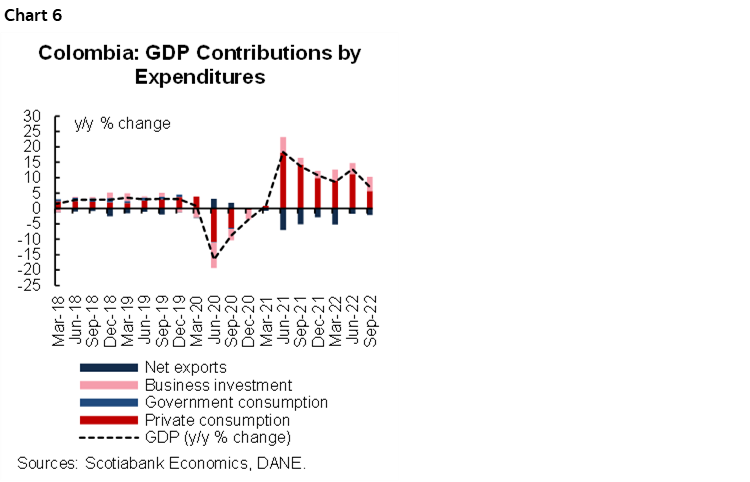
- Investment expanded 16.1% y/y and contributed 2.9ppts to total growth, showing a positive performance in machinery and equipment purchases. The 5.4% q/q gain may be associated with a better performance in housing and other building construction. We expect investment to continue gaining momentum though a headwind for the sector is higher input prices and interest rates.
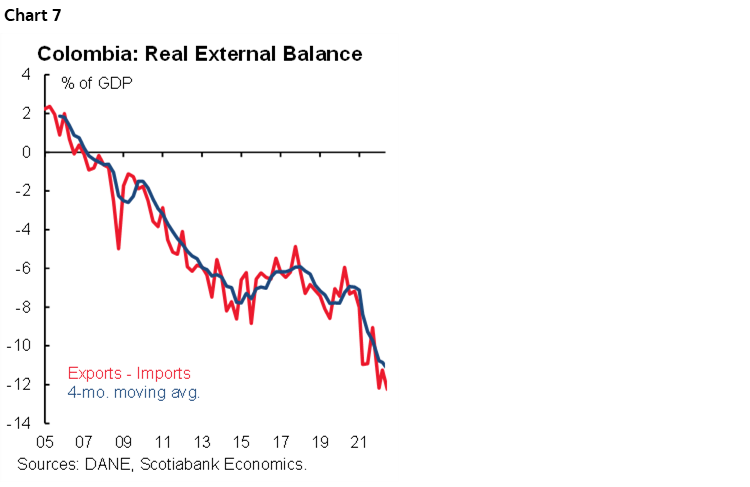
- The real external deficit widened in Q3-2022 (chart 7), averaging 12.3% of GDP. Exports (+14.5% y/y) expanded at a slower pace than imports (+23.3% y/y), showing the impact of somewhat weak mining activity despite high external prices while imports remain solid due to improved economic activity.
All in all, the Colombian economy performed better than expected in Q3, thanks to solid domestic demand. From a sectoral perspective, services led the gains, but gains were also supported by manufacturing. On the demand side, the highlights were private consumption and investment—on the back of a stronger construction sector, but purchases of machinery and equipment again contributed as the manufacturing expansion continues.
Strong economic activity and inflationary pressures for year-end combine with inflation expectations well off the central bank’s target and strengthening indexation pressures on prices. Given these factors, the economic data tilt our base case scenario of a 50bps hike at BanRep’s December 16 meeting to a potential 100 bps move. The pause in the hiking cycle will depend on signs of lower inflation, which may occur at the beginning of 2023.
Inflation expectations deviated further from the target, while the terminal rate is now expected at 12%
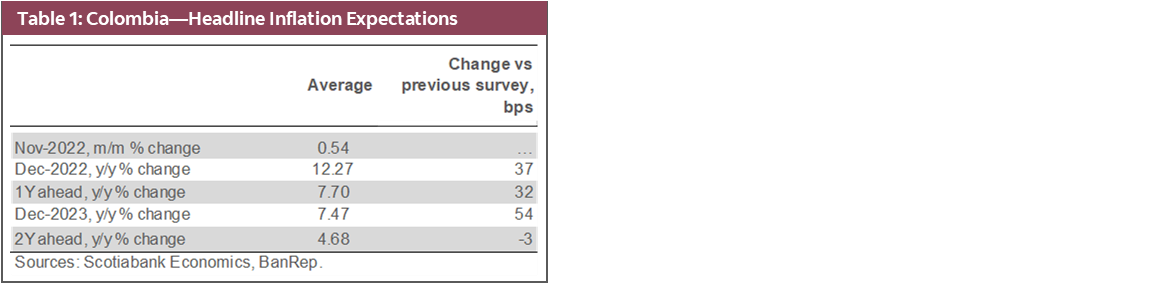
Late on Tuesday, November 15, the central bank, BanRep, released its monthly survey of economic expectations (table 1). Inflation expectations (IE) for the end of 2022 increased by 37bps, due to the upside surprise in October’s inflation. By the end of 2023, the survey showed inflation expectations well above the central bank target, at 7.47%. Monthly inflation for November is expected at 0.54% m/m, in Scotiabank Economics the expectation is at 0.67% m/m, by the end of the year we expect 12.37%, and by the end of 2023 6.09%.
Under the previous context, market consensus expects the hiking cycle to continue in 2022, with a final hike of 100bps in December to reach 12% as the terminal rate (+50bps vs the previous survey). In Scotiabank Economics Colombia the expectation is tilted towards a 100bps hike in December amid recent strong economic activity results and given that inflation expectations remain strongly deviated from the target.
- Short-term inflation expectation (chart 8). For November consensus is 0.54% m/m, which places annual inflation at 12.26% year-on-year (from 12.22% in October). The dispersion of the survey remains high with the bottom expectation at 0.15% m/m and a maximum of +0.80% m/m. Scotiabank Economics expects monthly inflation for November to be +0.67% m/m and 12.42% y/y, which is expected to be the peak. In October, we will have upside effects from Foodstuff prices, gasoline prices, tradable goods, and some offsetting effects in utilities.
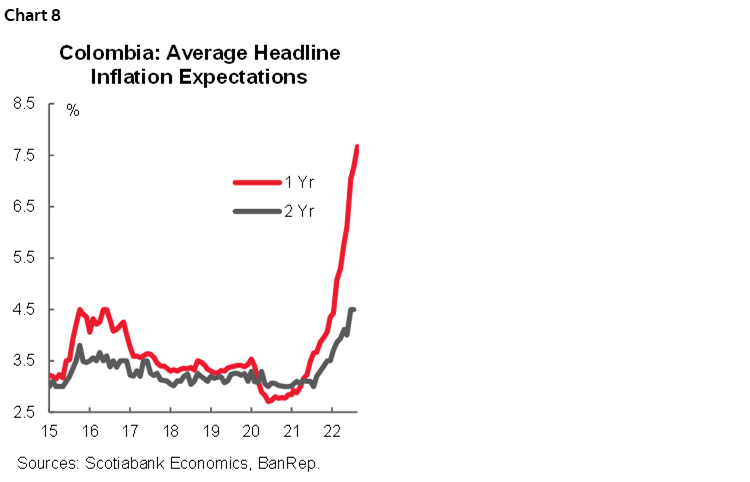
- Medium-term inflation. Inflation expectations rose to 12.27% y/y for December 2022, 37 basis points above last month's survey (table 1 again), showing the effect of the upside surprise in October’s results. It is worth noting that the VAT holiday would contribute to seeing more moderate inflation by the end of the year. That said, the potential peak of inflation could be expected between November/December 2022. IE for 1-year ahead stood at 7.70% y/y (above last month's reading of 7.38% y/y); while the 2-year forward decreased by 3bps to 4.68% y/y, still wee deviated from the central bank target.
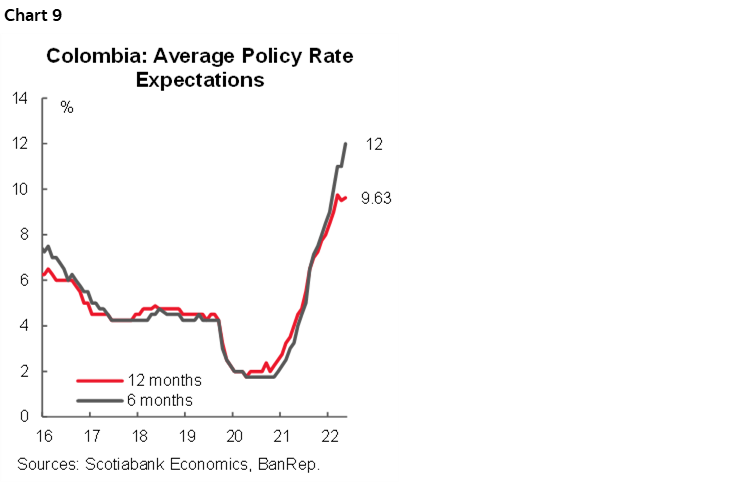
- Policy rate (chart 9). Median of the expectations points to a 100bps rate hike at the December 16 meeting, to leave the rate at 12% (from the current 11%); Scotiabank Economics, is also tilting its expectation to 100bps also, however the end of the cycle will depend on inflation confirming a peak. Market consensus expects the end of the hiking cycle in December 2022 and the first cut in June 2023 to close the year at 9%.
- FX. The USDCOP projections for the end of 2022 were located at 4,796 pesos on average (above the previous survey 4,484 pesos). By December 2023, respondents think, on average, that the peso will end the year at USDCOP 4,600, and in 2024 at 4,441. We believe that the USDCOP would close in 2022 at around 4,781 pesos.
Imports retreated from record highs, while the YTD trade deficit remains similar to 2021
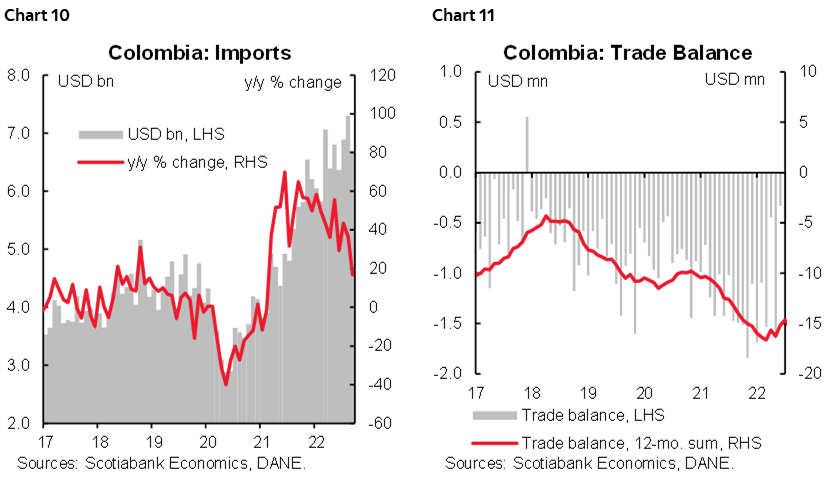
September’s imports data, released by DANE on Tuesday, came in at USD6.7bn (CIF terms), expanding by 16.8% y/y (chart 10), and slightly below the historical-high registered in August. The monthly trade deficit stood at USD1.40bn, which is below last September’s figure of USD1.49bn (chart 11). The YTD trade deficit was USD10.86bn, 0.60% above the same period in 2021, i.e., relatively stable. The data firm up our expectation of a ~ USD17bn current account deficit, which represents ~5.3% of GDP in 2022.
Manufacturing imports expanded by 11.8% y/y, and are still the main contributor to imports growth, while agriculture-related imports increased by 38.4% y/y, and oil-related imports increased by 70.5% y/y.
From the perspective of imports by use (chart 12), the three major segments showed strong increases compared with September 2021:
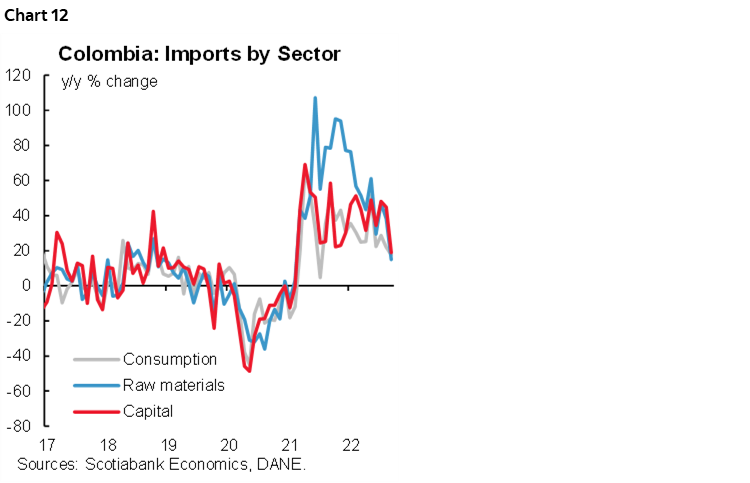
- Consumption-goods imports increased by +17% y/y and stood at USD1.57bn. Non-durable goods imports increased the most vs the previous month. In y/y terms expanded by +17.8% y/y, while durables expanded by 21.1% y/y. In the case of non-durable goods, food purchases (+16.9% y/y) lead the gains again. In the case of durable goods, it is relevant to note that vehicle purchases remained robust increasing by 29.9% y/y.
- Raw-materials imports grew by 15.1% y/y to USD3.11bn and remained the main contributor to the overall imports increase. Imports of raw materials for the industry (+9.6% y/y) is the main contributor, especially due to food-related products. However, compares with the previous month, raw material imports for the industry slowed-down.
- Capital-goods imports were up by 18.9% y/y to USD2.0bn. Purchases of investment-related goods in the industry lead the gains (+11.5% y/y), especially due to purchases of industrial machinery. Transport equipment (+29.4% y/y) remains robust, which shows a resilience in investment activity.
Imports in September moderated from the historically high levels registered in August. Purchases of raw materials for the industry slowed down but, in general, imports are showing still robust domestic activity. The trade deficit is hovering at similar levels to those observed in 2021, which is compatible with our current account deficit forecast of USD17bn equivalent to 5.3% of GDP in 2022. In terms of financing, the prevalence of high capital goods imports points to better FDI. However, we highlight that the external deficit remains one of the main issues of concern in Colombia’s macroeconomic metrics. Either way, from the fundamental perspective, the USDCOP exchange rate is well above what macro fundamentals would suggest.
—Sergio Olarte, María (Tatiana) Mejía & Jackeline Piraján
PERU: DISAPPOINTINGLY LOW GDP GROWTH IN SEPTEMBER… AGAIN
September GDP growth came in at a disappointing 1.7% y/y (table 2). The figure was low, but in line with previous months (1.7% y/y in August and 1.4% y/y in July, charts 13 and 14). What made the figure a particular disappointment, however, was that early indicators had been pointing to growth of over 2%. The best one can say, for now, is that at least GDP is inching up in m/m terms, rising 0.7% m/m in September.
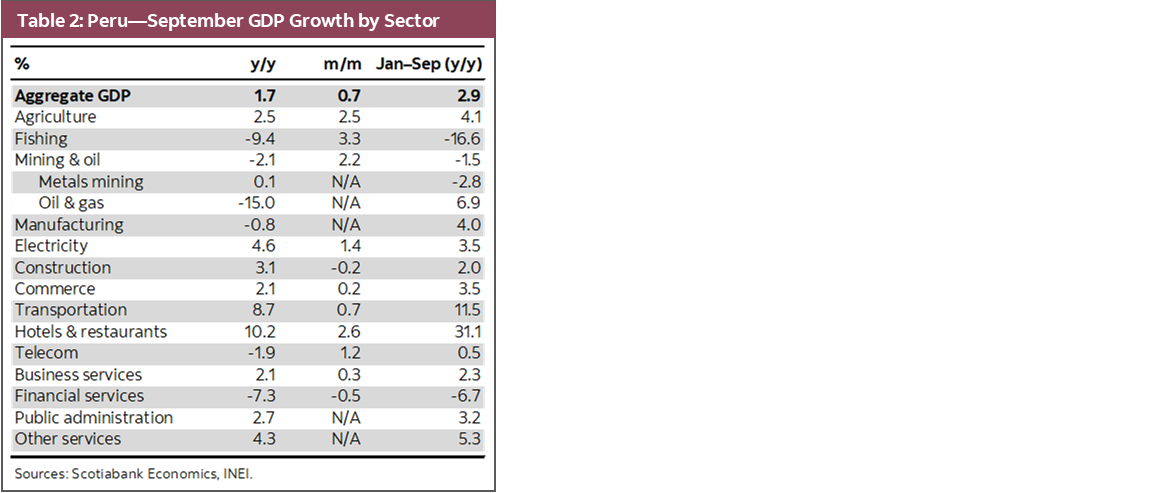
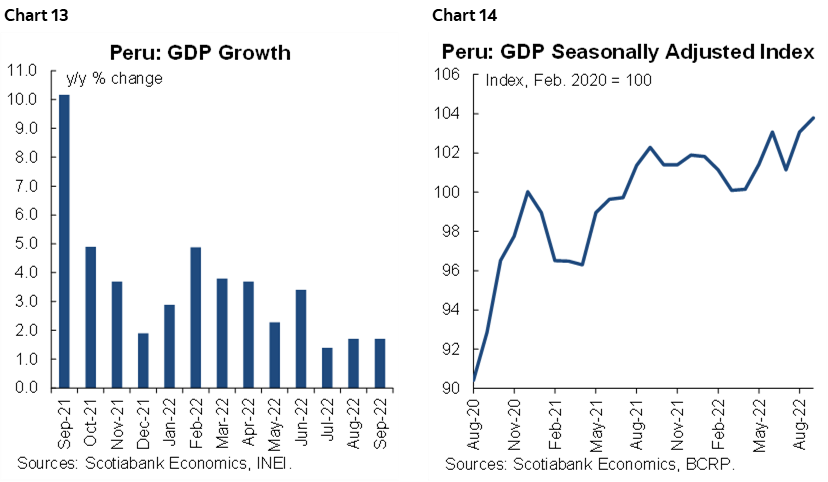
GDP growth appears to be stabilizing at between 1.5% y/y and 1.9% y/y. These are low levels that currently are very closely aligned to domestic demand. In general, monthly GDP figures now are a much better representation of the true strength of the economy, as the exceptional base comparison issues of the past have all but disappeared. Even if GDP begins to accelerate to over 2% in future months, the improvement will mostly be a reflection of the new Quellaveco copper mine. Domestic demand growth will continue to run below 2%, we expect.
The sector that disappointed the most was manufacturing (non-resource processing), which fell 0.8%. This is the sector that is more closely linked to consumption. Hospitality (hotels & restaurants) and transportation did continue to benefit from post-COVID-19 normalization, but the magnitude of the impact is declining. Construction rose 3.1%, y/y, but was stable m/m. In any event, construction activity was dominated by public investment, rather than private residential projects. Metals mining, which was stable, evidently still did not reflect the new Quellaveco mine, which was still in the ‘trial’ stage. Official approval for the mine to operate was not given until late-October.
Third quarter GDP growth and demand components will be published on Thursday/Friday. Given the monthly figures for July to September, we expect Q3 growth of 1.6% y/y. It will be interesting to see how much consumption contributed to growth, and whether private investment contributed anything at all.
—Guillermo Arbe
DISCLAIMER
This report has been prepared by Scotiabank Economics as a resource for the clients of Scotiabank. Opinions, estimates and projections contained herein are our own as of the date hereof and are subject to change without notice. The information and opinions contained herein have been compiled or arrived at from sources believed reliable but no representation or warranty, express or implied, is made as to their accuracy or completeness. Neither Scotiabank nor any of its officers, directors, partners, employees or affiliates accepts any liability whatsoever for any direct or consequential loss arising from any use of this report or its contents.
These reports are provided to you for informational purposes only. This report is not, and is not constructed as, an offer to sell or solicitation of any offer to buy any financial instrument, nor shall this report be construed as an opinion as to whether you should enter into any swap or trading strategy involving a swap or any other transaction. The information contained in this report is not intended to be, and does not constitute, a recommendation of a swap or trading strategy involving a swap within the meaning of U.S. Commodity Futures Trading Commission Regulation 23.434 and Appendix A thereto. This material is not intended to be individually tailored to your needs or characteristics and should not be viewed as a “call to action” or suggestion that you enter into a swap or trading strategy involving a swap or any other transaction. Scotiabank may engage in transactions in a manner inconsistent with the views discussed this report and may have positions, or be in the process of acquiring or disposing of positions, referred to in this report.
Scotiabank, its affiliates and any of their respective officers, directors and employees may from time to time take positions in currencies, act as managers, co-managers or underwriters of a public offering or act as principals or agents, deal in, own or act as market makers or advisors, brokers or commercial and/or investment bankers in relation to securities or related derivatives. As a result of these actions, Scotiabank may receive remuneration. All Scotiabank products and services are subject to the terms of applicable agreements and local regulations. Officers, directors and employees of Scotiabank and its affiliates may serve as directors of corporations.
Any securities discussed in this report may not be suitable for all investors. Scotiabank recommends that investors independently evaluate any issuer and security discussed in this report, and consult with any advisors they deem necessary prior to making any investment.
This report and all information, opinions and conclusions contained in it are protected by copyright. This information may not be reproduced without the prior express written consent of Scotiabank.
™ Trademark of The Bank of Nova Scotia. Used under license, where applicable.
Scotiabank, together with “Global Banking and Markets”, is a marketing name for the global corporate and investment banking and capital markets businesses of The Bank of Nova Scotia and certain of its affiliates in the countries where they operate, including; Scotiabank Europe plc; Scotiabank (Ireland) Designated Activity Company; Scotiabank Inverlat S.A., Institución de Banca Múltiple, Grupo Financiero Scotiabank Inverlat, Scotia Inverlat Casa de Bolsa, S.A. de C.V., Grupo Financiero Scotiabank Inverlat, Scotia Inverlat Derivados S.A. de C.V. – all members of the Scotiabank group and authorized users of the Scotiabank mark. The Bank of Nova Scotia is incorporated in Canada with limited liability and is authorised and regulated by the Office of the Superintendent of Financial Institutions Canada. The Bank of Nova Scotia is authorized by the UK Prudential Regulation Authority and is subject to regulation by the UK Financial Conduct Authority and limited regulation by the UK Prudential Regulation Authority. Details about the extent of The Bank of Nova Scotia's regulation by the UK Prudential Regulation Authority are available from us on request. Scotiabank Europe plc is authorized by the UK Prudential Regulation Authority and regulated by the UK Financial Conduct Authority and the UK Prudential Regulation Authority.
Scotiabank Inverlat, S.A., Scotia Inverlat Casa de Bolsa, S.A. de C.V, Grupo Financiero Scotiabank Inverlat, and Scotia Inverlat Derivados, S.A. de C.V., are each authorized and regulated by the Mexican financial authorities.
Not all products and services are offered in all jurisdictions. Services described are available in jurisdictions where permitted by law.