SUMMARY
Prices for most major commodities continue to trend higher, in line with economic data that increasingly point to a V-shaped global recovery from COVID-19 lockdowns and travel restrictions.
Industrial metals continue to witness strong gains, supported by robust Chinese demand and supply restrictions in key mining regions.
Energy infrastructure in the US Gulf Coast (USGC) appears to have been spared the worst of Hurricane Laura; we continue to anticipate that oil prices will climb back to pre-virus heights gradually.
STRONG GLOBAL REBOUND PERSISTS
Control of COVID-19’s spread has enabled an easing of physical distancing restrictions in many countries; cases remain on the rise in some nations, but economic data suggest that a V-shaped recovery is underway (chart 1). A number of jurisdictions have now recouped significant portions of the consumer and business activity lost over the period of more severe lockdowns. Markets have naturally responded positively to these developments, as well as to news of progress with respect to COVID-19 vaccine development and virus treatment, and commodity prices broadly continue to rise.

Yet we are not out of the woods. The recovery still looks to be in an early phase: the reopening process is largely complete among countries thus far driving the largest economic gains. As such, it is unlikely that the torrid pace of economic growth experienced of late will be sustained in the coming months. The US—where contagion has not been brought under control, the current administration is again embracing confrontational protectionist vitriol, and there is a risk of premature policy support withdrawal—remains a question mark. In all, we continue to anticipate that levels of economic activity in most jurisdictions will remain below pre-pandemic levels for some time.
METALS: INDUSTRIALS, GOLD STILL STRONG
Copper prices continue to rise. This month, it cleared the 3 USD/lb threshold for the first time since 2018, and is now more than 40% higher than the nadir reached in late March. Chinese demand continued to drive the complex higher, as reflected in a number of reports of surging metals imports that are naturally invoking comparisons to the post-GFC commodities boom. Tight metals inventories at Chinese ports continue to add price pressures (chart 2). Supply concerns also remain in place, notably in Latin America, still grappling with elevated COVID-19 caseloads.
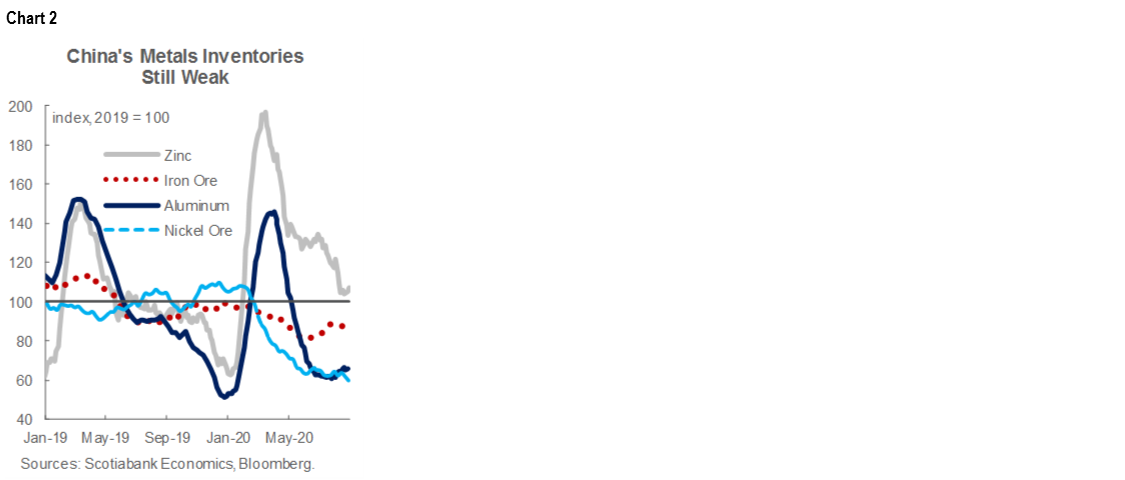
The story is much the same for the broader industrial metals complex. Aluminum, zinc, nickel, and iron ore all rose last month and sit more than 20% from their early-year lows, supported by the global industrial sector rally.
For gold, the key development this month was the Federal Reserve’s shift in tone. The US central bank’s apparent tolerance for inflation above the traditional 2% target, alongside already low interest rates—at least for now—are being interpreted by markets as potentially softer US real rates over the medium-term. However, this effect mightunwind over the longer-run as implementation is put to the test.
OIL: HURRICANE, PANDEMIC IMPACTS TAKE SHAPE
Oil industry headlines have been dominated of late by Hurricane Laura, whose top wind speed of 150 mph put it among the strongest storms on record in the US. As firms braced for storm surges and gale force winds, the USGC saw numerous platform evacuations and production shut-ins. Those supply reductions nudged WTI above 43 USD/bbl late last week, with price gains limited by ongoing fears of demand-side weakness related to COVID-19. Hurricane Harvey and its severe 2017 market disruptions and shutdowns are naturally being invoked, but that storm’s outsized impact was largely a product of the flooding and rains that resulted when it stalled over the Houston Area. At this stage, flooding at inland plants looks to have been avoided, reducing the likelihood of a sustained Laura-related impact.
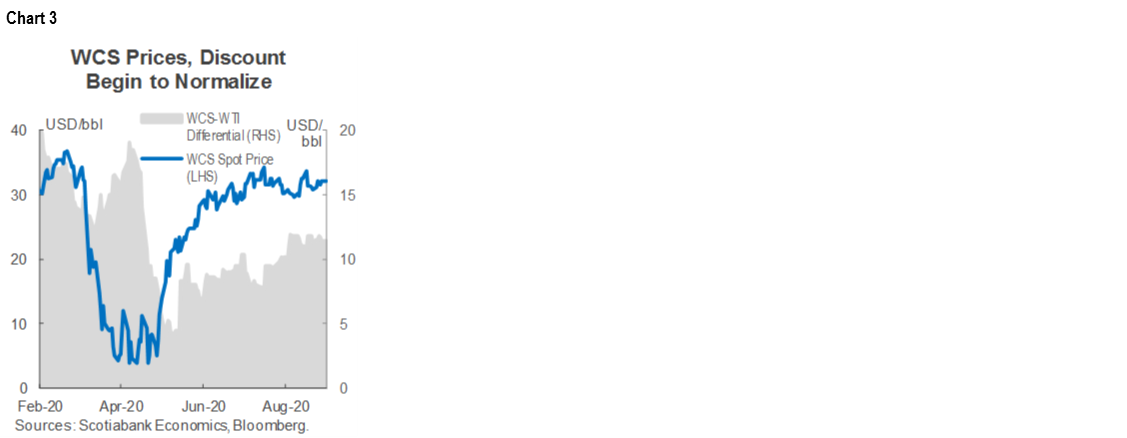
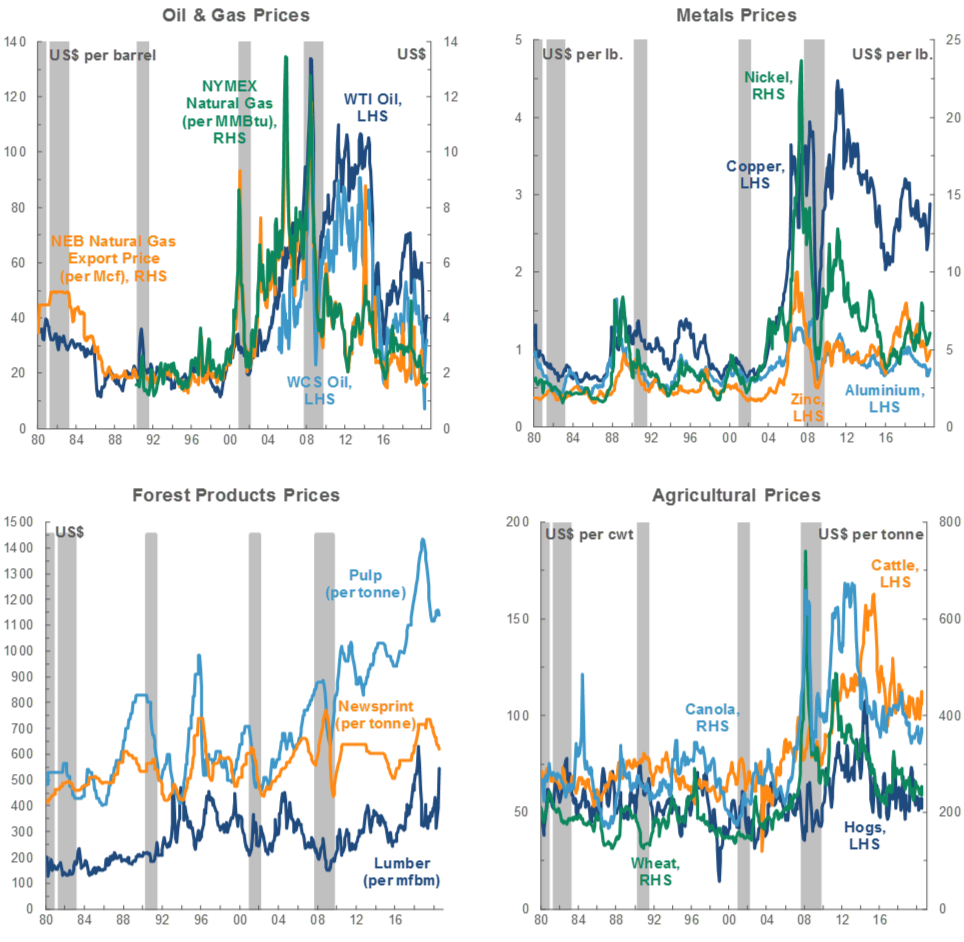
Western Canadian oil producers will be breathing a sigh of relief with refinery infrastructure at their marginal barrels’ primary destination looking to have been spared the worst of the storm. The WCS benchmark held steady in August, while its discount to WTI widened to the 11–12 USD/bbl range (chart 3). Spot prices remain below pre-pandemic heights, but their differential to WTI has been unsustainably narrow this year as a result of temporary excess egress capacity and reduced Venezuelan heavy oil output. Convergence towards the equilibrium 15–17 USD/bbl range reflects the heavy oil market’s ongoing rebalancing process as fuel demand and production continue to recover. Still, durable long-run balance cannot be achieved until fuel consumption normalizes and new pipelines enter service.
Alberta’s first fiscal update since COVID-19 reached Canadian shores (see our note)—the last such report among Canada’s provinces—allows for further stock-taking on the pandemic’s oil and gas sector impact. Record or near-record economic contractions, job losses, budget deficits, and debt loads are now expected across the net oil-producing provinces this year. Alberta will also incur further costs associated with its crude-by-rail program—contracts for which have now been sold to the private sector—with weaker pricing and this year’s narrowing of the WCS-WTI discount eroding related revenues. Also of note, Alberta anticipates that even after a strong growth bounce-back next year, real GDP will sit more than 6% below its 2014 peak, which would extend the downturn that began in 2015 to at least eight years.
SOFTWOOD LUMBER RULING A MORAL VICTORY FOR GREAT WHITE NORTH
This month’s WTO statement that the US Department of Commerce erred in 2017 when it imposed countervailing duties on Canadian softwood lumber exports was the latest chapter in a multi-decade cross-border spat. The US is the primary destination of Canada’s softwood lumber exports, and contends that its neighbour’s stumpage fees constitute a de facto subsidy system that justifies the use of countervailing duties on shipments from the Great White North. Policy changes are uncertain, but the decision has nonetheless been cheered by Canadian producers following the US’ move to restore aluminum import tariffs.
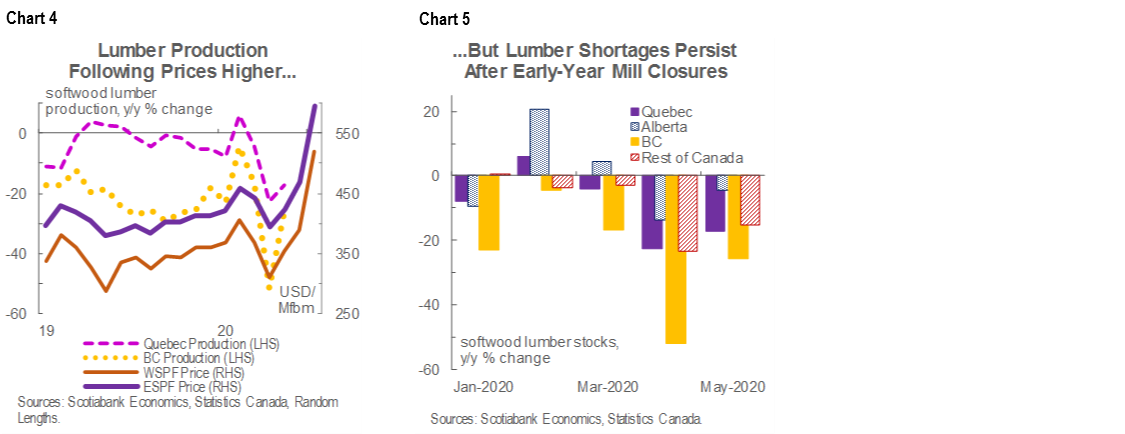
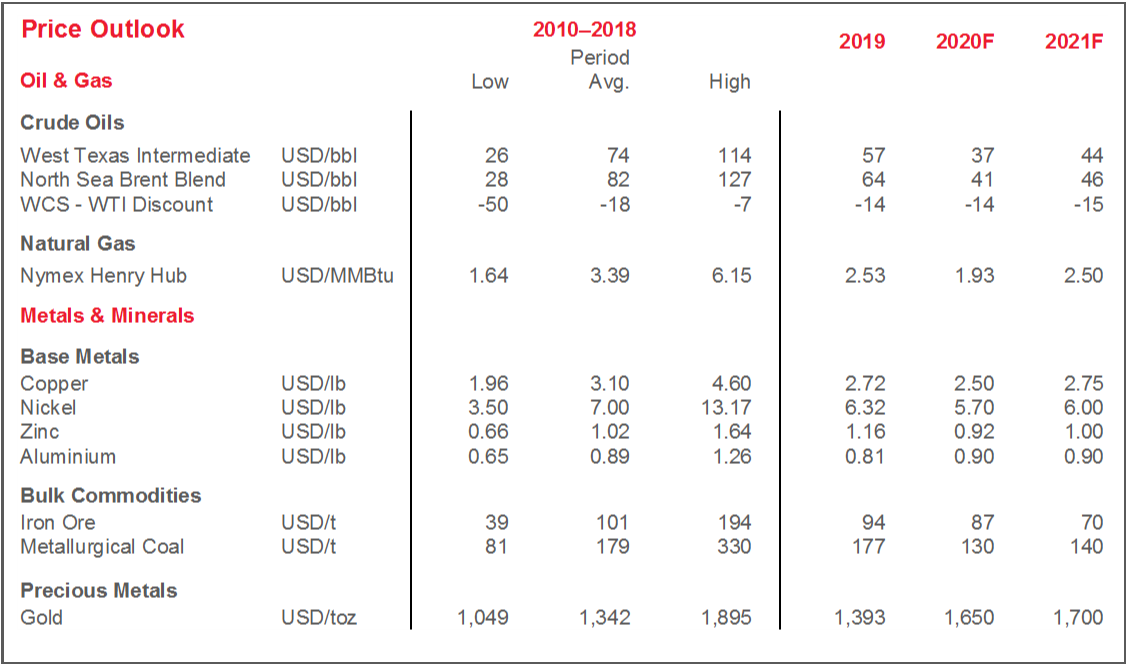
Against that backdrop, Canadian lumber producers are in the midst of hefty price gains. Expecting a pandemic-induced plunge in in demand, the industry cut back production in March and April. Yet, with US home building recovering, tariffs on American lumber imports still in place, and output only beginning to ramp up, prices for Western and Eastern Spruce Pine Fir (WSPF, ESPF) 2×4s in July surged above 500 USD/Mfbm (chart 4, p.2). More recent futures prices indicate prices in the 900–1,000 USD/Mfbm range—all-time highs for both. Lumber prices are known to be volatile and the US’s recovery is uncertain given its failure to contain COVID-19’s spread. Still, shortages that have developed across Canada in the early months of the year (chart 5, p.2) may continue to put upward pressure on prices in the next few months.
TECHNICAL NOTE
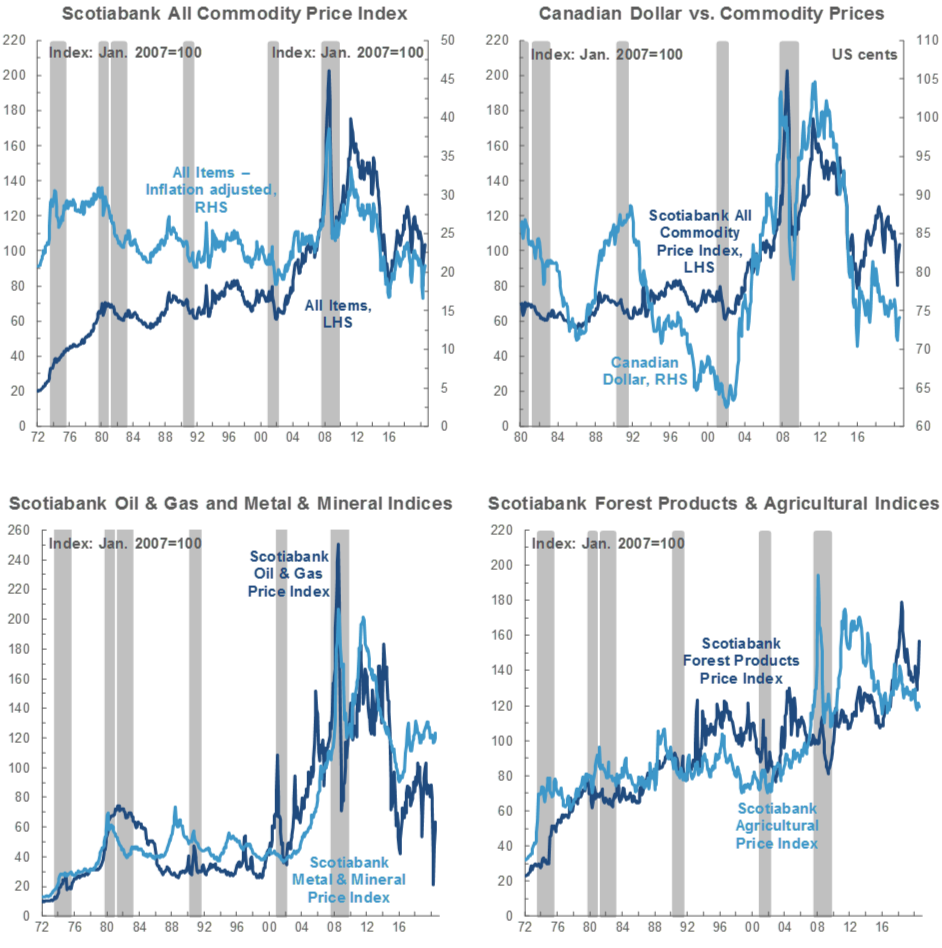
Scotiabank Commodity Price Index — Principal Canadian Exports
January 2007 = 100
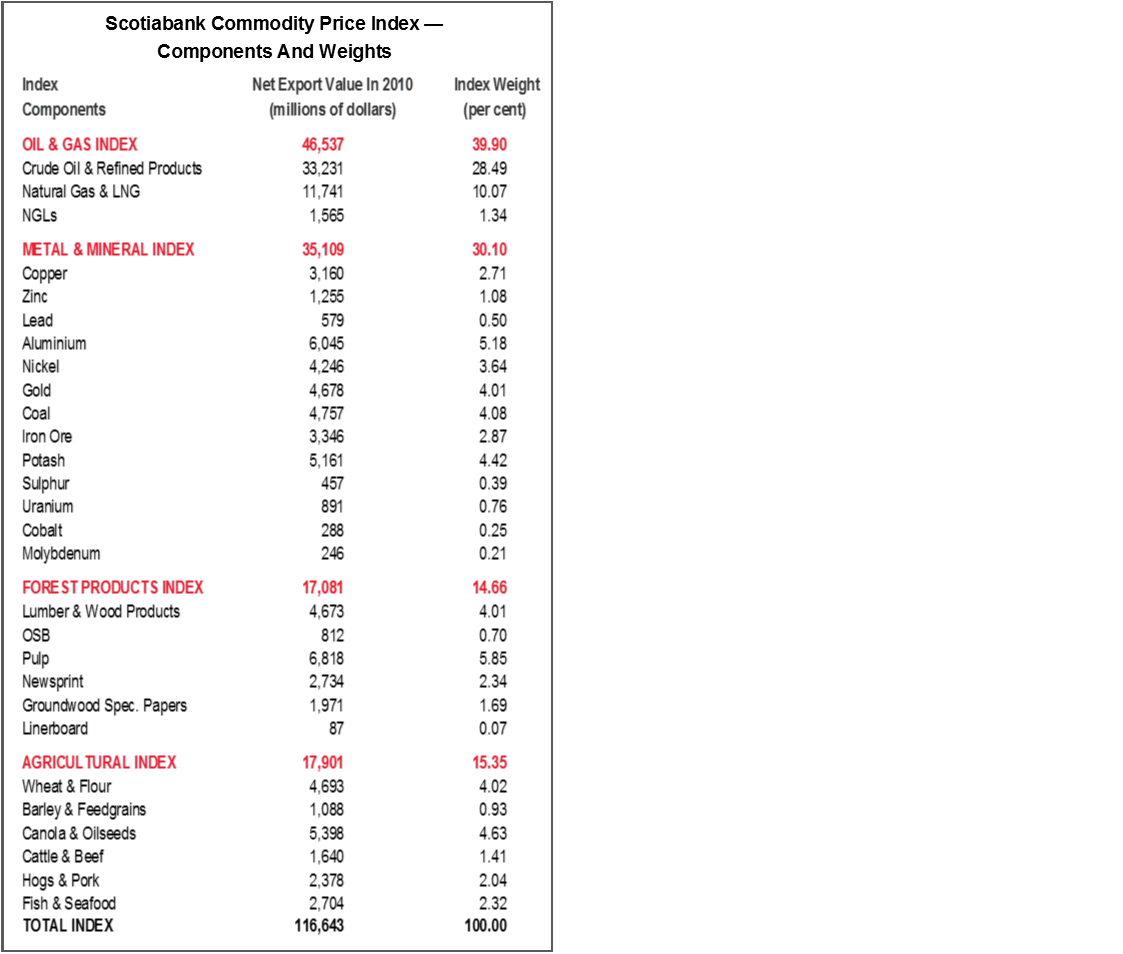
This Index has been designed to track the spot or transactions prices paid in U.S. dollars for key Canadian commodities and resource-based manufactured goods in export markets. The weight of each component is based upon its net export value in 2010. Prior to January 2007, the weight of each component was based on its export value in 1995-97, except for crude oil & refined petroleum products, uncoated freesheet paper and linerboard, where net exports were used. Canada imports a significant quantity of these products, and use of their export value alone would have overstated the importance in Canada’s trade performance.
The following prices are included:
OIL & GAS
Crude Oil & Refined Petroleum Products (US$ per bbl) MSW light sweet crude oil at Edmonton (previously Edmonton Par crude) and Western Canadian Select heavy oil at Hardisty, Alberta; price differentials off WTI near-by futures from Bloomberg.
Natural Gas (US$ per mcf) Average export price quoted by the National Energy Board.
Natural Gas Liquids (NGLs – Propane, Butane, Ethane & Pentanes-Plus) (US$ per bbl), Propane at Edmonton & Sarnia.
METALS & MINERALS
Copper & Products (US$ per lb) LME official cash settlement price for grade A copper.
Zinc (US$ per lb) LME SHG cash settlement: prior to Sept 1990, U.S. producers’ price for high-grade zinc delivered.
Lead (US$ per lb) LME official cash settlement price; prior to Jan. 1991, U.S. producers’ price for common grade delivered.
Aluminium & Products (US$ per lb) since 1979, LME official cash settlement price.
Nickel (US$ per lb) since 1980, LME official cash settlement price.
Gold (US$ per oz) ‘LBMA Gold Price PM’ as of March 20, 2015.
Potash (US$ per tonne) Standard potassium chloride, spot price, FOB Vancouver.
Sulphur (US$ per tonne) Solid, spot price, FOB Vancouver.
Metallurgical Coal (US$ per tonne) Contract price for premium-grade hard coking coal, FOB Vancouver.
Iron Ore (US cents per dmtu) Spot price fines 62% Fe, CFR Qingdao, China; prior to Jan 2011, term-contract price for concentrates 66% Fe from Labrador/Quebec to Northern Europe (FOB Sept-Iles).
Uranium (US$ per lb) U3O8 near-by-futures from Bloomberg.
Molybdenum (US$ per lb) since March 1992, MW dealer oxide.
Cobalt (US$ per lb) MW dealer price.
FOREST PRODUCTS
Lumber & Wood Products, Western Spruce-Pine-Fir 2x4 No.2 & Btr (US$ per mfbm) FOB mill.
Oriented Strandboard (US$ per thousand sq. ft.), U.S. North Central region, 7/16 inch.
Pulp, Bleached Northern Softwood Kraft (US$ per tonne) Transactions price, delivery USA.
Newsprint (US$ per tonne) Average transactions price, 45 grams, delivery Eastern USA.
Groundwood Specialty Papers (US$ per ton) Supercalendered-A paper, 35 lb., delivery USA.
Linerboard (US$ per ton), delivery Eastern USA with zone discounts.
AGRICULTURE
Wheat & Flour (US$ per tonne), DNS No 1 14% protein Duluth, Minn; prior to April 2011 No.1 CWRS, 13.5% protein at St. Lawrence.
Barley (US$ per tonne), Manitoba Agriculture and Food No. 1 Canadian western barley aggregate spot price; historical data No. 1 at Lethbridge, Alberta.
Canola & Oilseeds (US$ per tonne) No.1 Canada, in store Vancouver.
Cattle & Beef (US$ per cwt) Steers over 1,051 pounds at Toronto; from Jan 1993, Ontario average.
Hogs & Pork (US$ per cwt) 100 Index Hogs at Toronto; from Jan 1993, Ontario average.
Fish & Seafood (US$ per lb) West Coast silver coho salmon; Atlantic lobster prices; prior to 1986 cod fillets & blocks.
DISCLAIMER
This report has been prepared by Scotiabank Economics as a resource for the clients of Scotiabank. Opinions, estimates and projections contained herein are our own as of the date hereof and are subject to change without notice. The information and opinions contained herein have been compiled or arrived at from sources believed reliable but no representation or warranty, express or implied, is made as to their accuracy or completeness. Neither Scotiabank nor any of its officers, directors, partners, employees or affiliates accepts any liability whatsoever for any direct or consequential loss arising from any use of this report or its contents.
These reports are provided to you for informational purposes only. This report is not, and is not constructed as, an offer to sell or solicitation of any offer to buy any financial instrument, nor shall this report be construed as an opinion as to whether you should enter into any swap or trading strategy involving a swap or any other transaction. The information contained in this report is not intended to be, and does not constitute, a recommendation of a swap or trading strategy involving a swap within the meaning of U.S. Commodity Futures Trading Commission Regulation 23.434 and Appendix A thereto. This material is not intended to be individually tailored to your needs or characteristics and should not be viewed as a “call to action” or suggestion that you enter into a swap or trading strategy involving a swap or any other transaction. Scotiabank may engage in transactions in a manner inconsistent with the views discussed this report and may have positions, or be in the process of acquiring or disposing of positions, referred to in this report.
Scotiabank, its affiliates and any of their respective officers, directors and employees may from time to time take positions in currencies, act as managers, co-managers or underwriters of a public offering or act as principals or agents, deal in, own or act as market makers or advisors, brokers or commercial and/or investment bankers in relation to securities or related derivatives. As a result of these actions, Scotiabank may receive remuneration. All Scotiabank products and services are subject to the terms of applicable agreements and local regulations. Officers, directors and employees of Scotiabank and its affiliates may serve as directors of corporations.
Any securities discussed in this report may not be suitable for all investors. Scotiabank recommends that investors independently evaluate any issuer and security discussed in this report, and consult with any advisors they deem necessary prior to making any investment.
This report and all information, opinions and conclusions contained in it are protected by copyright. This information may not be reproduced without the prior express written consent of Scotiabank.
™ Trademark of The Bank of Nova Scotia. Used under license, where applicable.
Scotiabank, together with “Global Banking and Markets”, is a marketing name for the global corporate and investment banking and capital markets businesses of The Bank of Nova Scotia and certain of its affiliates in the countries where they operate, including, Scotiabanc Inc.; Citadel Hill Advisors L.L.C.; The Bank of Nova Scotia Trust Company of New York; Scotiabank Europe plc; Scotiabank (Ireland) Limited; Scotiabank Inverlat S.A., Institución de Banca Múltiple, Scotia Inverlat Casa de Bolsa S.A. de C.V., Scotia Inverlat Derivados S.A. de C.V. – all members of the Scotiabank group and authorized users of the Scotiabank mark. The Bank of Nova Scotia is incorporated in Canada with limited liability and is authorised and regulated by the Office of the Superintendent of Financial Institutions Canada. The Bank of Nova Scotia is authorised by the UK Prudential Regulation Authority and is subject to regulation by the UK Financial Conduct Authority and limited regulation by the UK Prudential Regulation Authority. Details about the extent of The Bank of Nova Scotia's regulation by the UK Prudential Regulation Authority are available from us on request. Scotiabank Europe plc is authorised by the UK Prudential Regulation Authority and regulated by the UK Financial Conduct Authority and the UK Prudential Regulation Authority.
Scotiabank Inverlat, S.A., Scotia Inverlat Casa de Bolsa, S.A. de C.V., and Scotia Derivados, S.A. de C.V., are each authorized and regulated by the Mexican financial authorities.
Not all products and services are offered in all jurisdictions. Services described are available in jurisdictions where permitted by law.