SUMMARY
- Fear that restrictions related to the new Omicron variant of COVID-19 will weaken commodity demand dominated markets; we have included a small uncertainty-related impact in our economic forecast.
- Inflation readings continued to breach multi-decade highs around the world; following a marked shift in Federal Reserve communications, we now forecast a more aggressive monetary tightening path in the US.
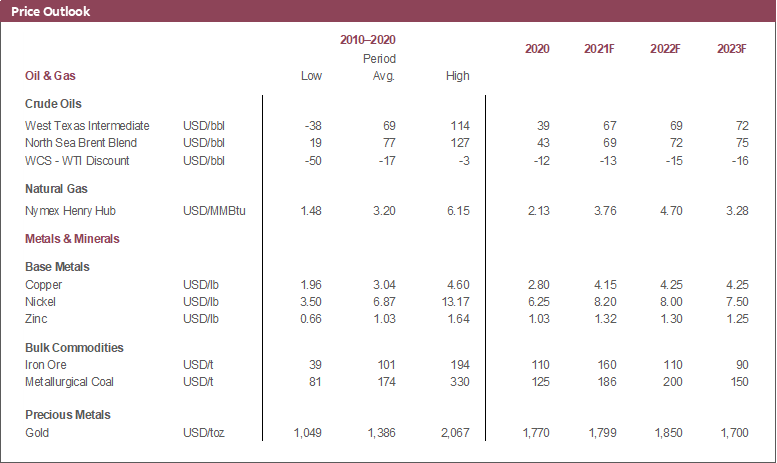
- Gold prices have so far held steady in the 1,765–1,800 USD/oz range this month, at the confluence of strong safe-haven demand amid Omicron’s proliferation and the dampening effects of more hawkish monetary policy expectations.
- The new variant laid a beating on oil prices as virus spread and fresh containment measures were seen to weaken the fuel demand outlook; related news flow will no doubt continue to drive crude values going forward.
- WCS’s discount to WTI narrowed as US Gulf Coast (USGC) refinery activity rallied and energy costs eased.
- Industrial metals prices reacted to COVID-19 developments, but also benefited from an upbeat Federal Reserve outlook and factors such as production disruptions in Latin America and expectations of stronger Chinese steel output .
- In the first five weeks since severe flooding and mudslides hit British Columbia, supply constraints plus continued robust demand have driven WSPF lumber prices more than 400 USD/thousand board-foot higher.
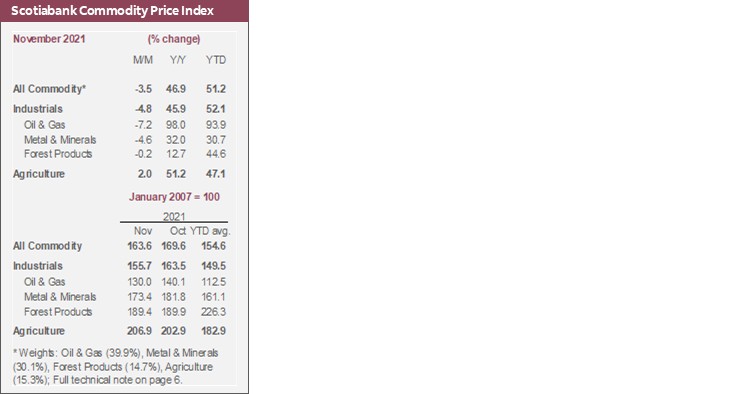
- This is the final Scotiabank Commodity Price Index article; beginning in January 2022, we will release a new monthly report on commodity price developments.
NEW VARIANT SPREADS ALONGSIDE PRICE PRESSURES
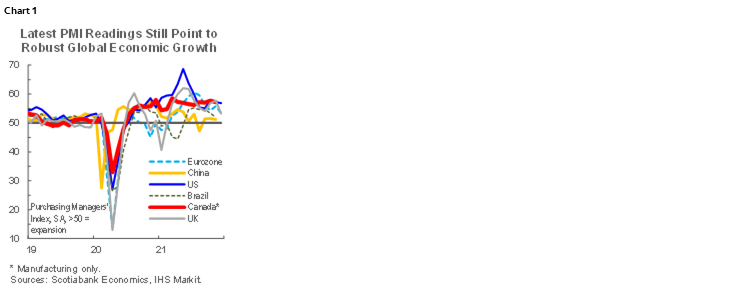
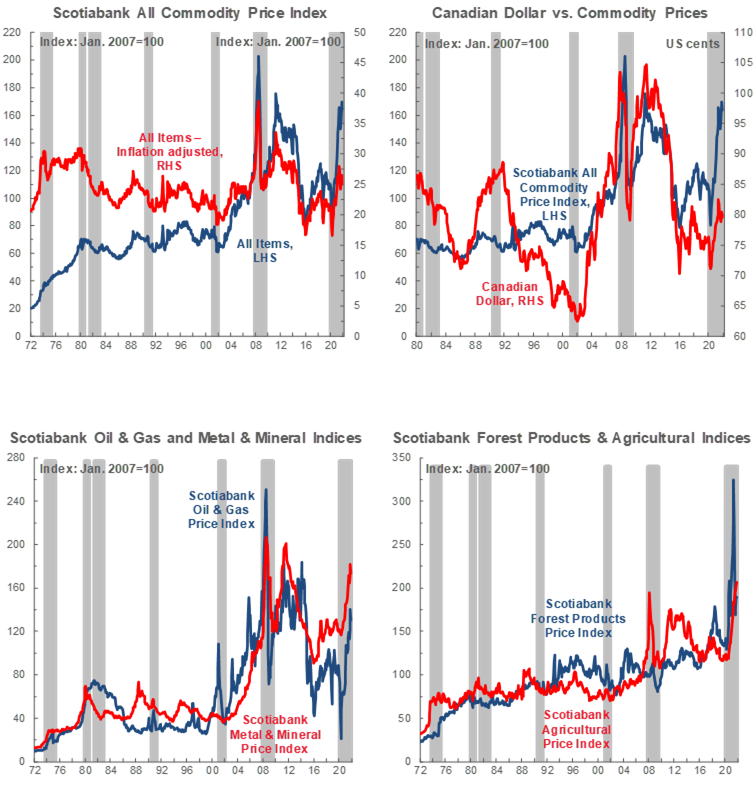
Economic growth remains robust around much of the world as the global economy continues to reopen and recover from COVID-19 (chart 1), and that is still contributing to supply-demand imbalances and broad price pressures. Inflation readings continued to breach multi-decade highs this past month.
With rising inflation and a marked shift in Federal Reserve communications in recent weeks, we now expect the Fed to raise interest rates by 25 bps in June 2022 followed by another 75 bps of tightening by year-end. For several quarters, our models have suggested that interest rates in the US should rise in early 2022, but Fed messaging indicated that that was unrealistic. The central bank is now more concerned about inflation and has begun unwinding stimulative bond purchases. Moreover, while employment is well below pre-pandemic levels—which argues for a supportive rate environment—weak labour force participation suggests that the US is closer to full-employment levels than implied by the jobs data alone.
Our outlook incorporates a small negative growth impact this quarter and next related to the newly discovered Omicron variant of COVID-19. That effect largely reflected the idea that the variant’s spread will create uncertainty that weighs on consumer spending and business activity, not expectations of a return to full-fledged lockdowns. We will re-assess our growth and rate forecasts next month with new restrictions now in place and more data available. Omicron appears to be more transmissible than previous virus iterations (chart 2, p.3). Regardless, variant news flow dominated financial markets this month, as investors feared that it would prompt new lockdowns and sap commodity demand.

OMICRON HITS CRUDE VALUES HARD
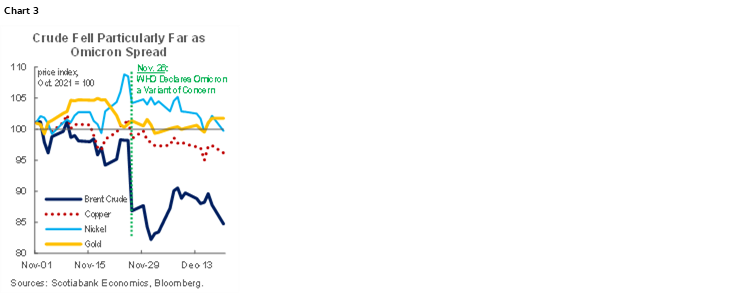
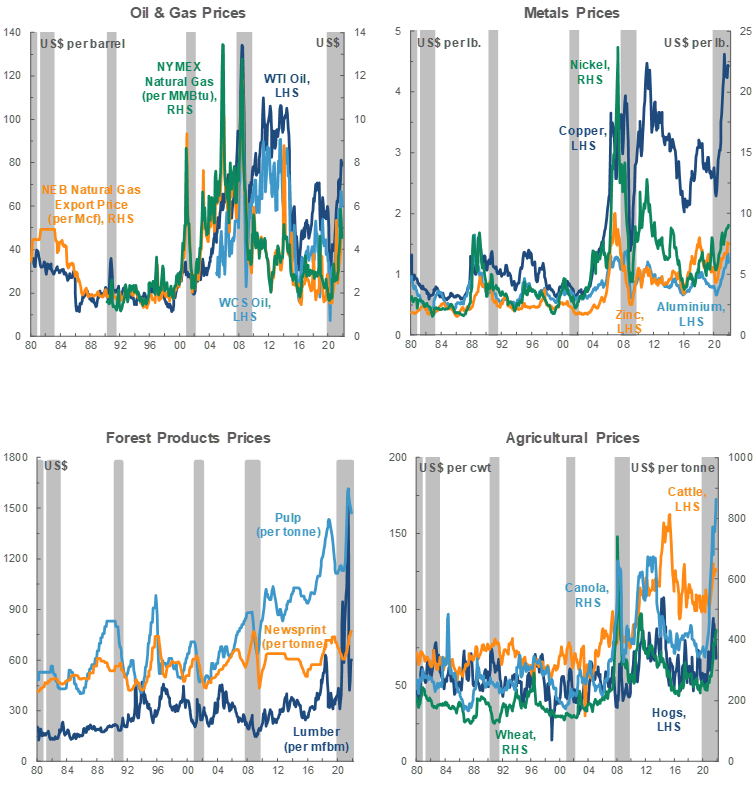
The new variant laid a beating on oil prices. On the day that the World Health Organization declared Omicron a variant of concern, the Brent global crude benchmark plunged by 10 USD/bbl (11.5%) (chart 3, p.3); though that drop did coincide with the front-month futures contract expiry date, it also clearly reflects expectations of weaker fuel consumption in the coming months. Evidently, we did not predict the speed with which Omicron has spread or the magnitude of the price drop, but we did project in the most recent update to our commodity price forecasts that news flow related to the pandemic would cause volatility in crude values. Developments related to virus proliferation and containment measures will surely continue to weigh on crude values going forward. Still, we note that at the time of writing, the physical market is tight. For instance, US oil storage at the Cushing, Oklahoma hub has risen in three straight weeks but remains low relative to recent history.
As Omicron spread, OPEC+ opted to maintain planned production increases. The decision likely reflects: the need for producers to generate funds for the global green energy transition, expectations of market tightness given plans for capital discipline in the industry, a desire to compensate for below-quota production levels reported in November, and political pressure to stabilize consumer prices from major crude-consuming countries—particularly the US. All these forces will likely remain in place at the cartel’s January 4th, 2022 meeting, though further proliferation of the new COVID-19 variant or additional restrictions could mean further pressure to freeze output.
WCS’s discount to WTI narrowed from a high of more than 20 USD/bbl last month to about 15 USD/bbl by late December. Capacity use at USGC refineries—a key source of demand for marginal Western Canadian barrels—continues to recover from Hurricane Ida-related shutdowns. Moreover, North American natural gas prices—which influence operating costs at fuel upgrading facilities—have fallen significantly amid warmer weather and strategic reserve releases. The Line 3 pipeline expansion now in operation should offer further support for Western Canadian oil prices via increased transportation capacity, though we continue to suspect that OPEC+ output growth will offset some of that boost to the extent that they increase heavy sour crude availability in the USGC.
GOLD: A TUG OF WAR BETWEEN FED POLICY AND SAFE HAVEN DEMAND
Gold prices have held steady in the 1,765–1,800 USD/oz range so far in December. Recall that they surged in early November on a strong US inflation print and questions about whether US president Biden would entrench more dovish monetary policy at the top of the Federal Reserve. They then fell back below the 1,800 USD/oz mark when it was confirmed that Jerome Powell would reman Fed Chair. On the one hand, risk aversion was evident in financial markets this month as Omicron spread rapidly, and that naturally supports bullion as a safe haven asset. On the other, markets and economic forecasters now expect more and earlier rate hikes next year than they did just a few months ago, which reduce the metal’s draw as a hedge against inflation.
SUPPLY CONSTRAINTS MITIGATE OMICRON LOSSES FOR COPPER AND NICKEL, IRON ORE REGAINS SOME GROUND
Copper prices have been rangebound thus far in December. Optimistically, red metal values gained following last week’s Federal Reserve communications as investors appear to have largely taken an apparently accelerated tightening path as a sign of strengthening economic activity. US dollar weakness related to stimulus package negotiation uncertainty also buoyed greenback-denominated commodities, and there remain concerns about supply coming out of Peru—the world’s second-largest copper producer—amid road blockages. However, Omicron proliferation and associated fears about industrial demand weakness likely held back further gains.
Nickel largely followed the same path as copper this month. Prices generally fell in response to negative COVID-19 news but regained ground on signs of strong economic activity in China and the US. Weak inventories at the London Metals Exchange likely limited more serious declines.
Iron ore climbed back above 120 USD/t for the first time since late October. The metal continues to be bolstered by softening Chinese steel production. Though steelmaking is the primary source of iron ore demand and China is by far the world’s largest steel producer, recent softness suggests that there is now scope for mills to ramp up production following restrictions imposed to rein in carbon emissions before next year’s Winter Olympics. Elevated inventories of iron ore at Chinese ports may undermine further gains to the extent that they loosen domestic supply-demand balances.
LUMBER PRICES SOARING AGAIN
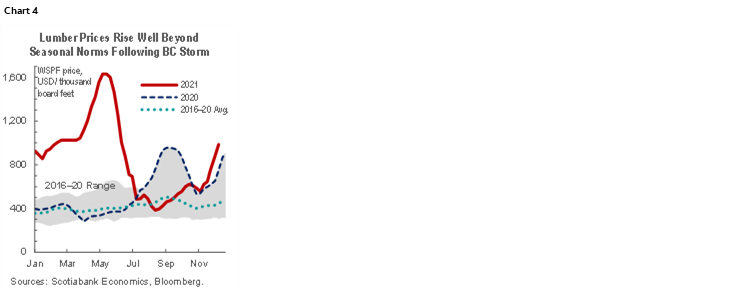
In the week before floods and mudslides hammered British Columbia, WSPF prices averaged 555 USD/thousand board feet; last week, the per-unit value hit 985 USD. Many mills remain cut off from forests and customers in the aftermath of the storm, which has reinforced the price gains that tends to occur in the winter months (chart 4) as builders purchase product in preparation for spring construction. Abnormally warm autumn weather may have also contributed to a longer-than-usual building season. The fundamental outlook remains strong. We expect US housing starts to exceed 1.5 mn units again next year—in November, they approached 1.7 mn units on a seasonally adjusted, annualized basis, the second-highest monthly level since 2006. A doubling of US duty rates on Canadian lumber as of December 2 should add to price pressures.
TECHNICAL NOTE
Scotiabank Commodity Price Index — Principal Canadian Exports
January 2007 = 100
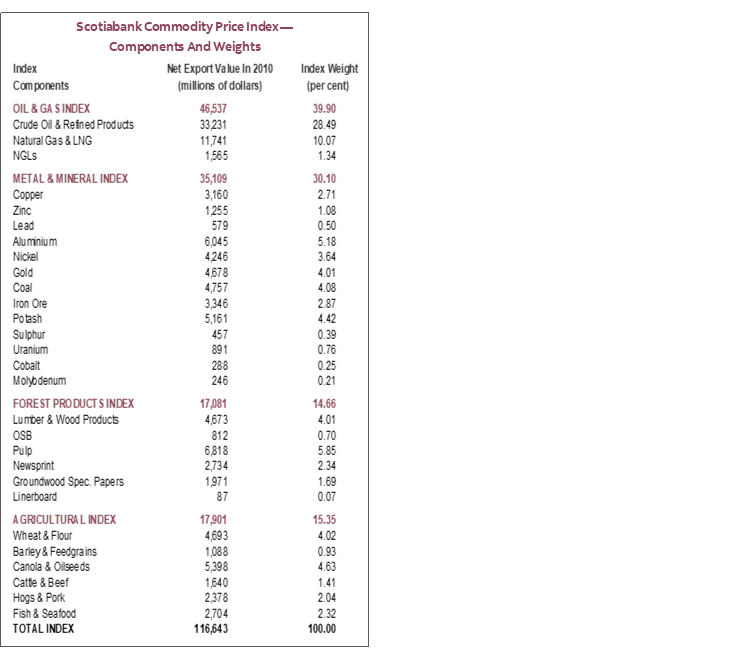
This Index has been designed to track the spot or transactions prices paid in U.S. dollars for key Canadian commodities and resource-based manufactured goods in export markets. The weight of each component is based upon its net export value in 2010. Prior to January 2007, the weight of each component was based on its export value in 1995-97, except for crude oil & refined petroleum products, uncoated freesheet paper and linerboard, where net exports were used. Canada imports a significant quantity of these products, and use of their export value alone would have overstated the importance in Canada’s trade performance.
The following prices are included:
OIL & GAS
Crude Oil & Refined Petroleum Products (US$ per bbl) MSW light sweet crude oil at Edmonton (previously Edmonton Par crude) and Western Canadian Select heavy oil at Hardisty, Alberta; price differentials off WTI near-by futures from Bloomberg.
Natural Gas (US$ per mcf) Average export price quoted by the National Energy Board.
Natural Gas Liquids (NGLs – Propane, Butane, Ethane & Pentanes-Plus) (US$ per bbl), Propane at Edmonton & Sarnia.
METALS & MINERALS
Copper & Products (US$ per lb) LME official cash settlement price for grade A copper.
Zinc (US$ per lb) LME SHG cash settlement: prior to Sept 1990, U.S. producers’ price for high-grade zinc delivered.
Lead (US$ per lb) LME official cash settlement price; prior to Jan. 1991, U.S. producers’ price for common grade delivered.
Aluminium & Products (US$ per lb) since 1979, LME official cash settlement price.
Nickel (US$ per lb) since 1980, LME official cash settlement price.
Gold (US$ per oz) ‘LBMA Gold Price PM’ as of March 20, 2015.
Potash (US$ per tonne) Standard potassium chloride, spot price, FOB Vancouver.
Sulphur (US$ per tonne) Solid, spot price, FOB Vancouver.
Metallurgical Coal (US$ per tonne) Contract price for premium-grade hard coking coal, FOB Vancouver.
Iron Ore (US cents per dmtu) Spot price fines 62% Fe, CFR Qingdao, China; prior to Jan 2011, term-contract price for concentrates 66% Fe from Labrador/Quebec to Northern Europe (FOB Sept-Iles).
Uranium (US$ per lb) U3O8 near-by-futures from Bloomberg.
Molybdenum (US$ per lb) since March 1992, MW dealer oxide.
Cobalt (US$ per lb) MW dealer price.
FOREST PRODUCTS
Lumber & Wood Products, Western Spruce-Pine-Fir 2x4 No.2 & Btr (US$ per mfbm) FOB mill.
Oriented Strandboard (US$ per thousand sq. ft.), U.S. North Central region, 7/16 inch.
Pulp, Bleached Northern Softwood Kraft (US$ per tonne) Transactions price, delivery USA.
Newsprint (US$ per tonne) Average transactions price, 45 grams, delivery Eastern USA.
Groundwood Specialty Papers (US$ per ton) Supercalendered-A paper, 35 lb., delivery USA.
Linerboard (US$ per ton), delivery Eastern USA with zone discounts.
AGRICULTURE
Wheat & Flour (US$ per tonne), DNS No 1 14% protein Duluth, Minn; prior to April 2011 No.1 CWRS, 13.5% protein at St. Lawrence.
Barley (US$ per tonne), Manitoba Agriculture and Food No. 1 Canadian western barley aggregate spot price; historical data No. 1 at Lethbridge, Alberta.
Canola & Oilseeds (US$ per tonne) No.1 Canada, in store Vancouver.
Cattle & Beef (US$ per cwt) Steers over 1,051 pounds at Toronto; from Jan 1993, Ontario average.
Hogs & Pork (US$ per cwt) 100 Index Hogs at Toronto; from Jan 1993, Ontario average.
Fish & Seafood (US$ per lb) West Coast silver coho salmon; Atlantic lobster prices; prior to 1986 cod fillets & blocks.
DISCLAIMER
This report has been prepared by Scotiabank Economics as a resource for the clients of Scotiabank. Opinions, estimates and projections contained herein are our own as of the date hereof and are subject to change without notice. The information and opinions contained herein have been compiled or arrived at from sources believed reliable but no representation or warranty, express or implied, is made as to their accuracy or completeness. Neither Scotiabank nor any of its officers, directors, partners, employees or affiliates accepts any liability whatsoever for any direct or consequential loss arising from any use of this report or its contents.
These reports are provided to you for informational purposes only. This report is not, and is not constructed as, an offer to sell or solicitation of any offer to buy any financial instrument, nor shall this report be construed as an opinion as to whether you should enter into any swap or trading strategy involving a swap or any other transaction. The information contained in this report is not intended to be, and does not constitute, a recommendation of a swap or trading strategy involving a swap within the meaning of U.S. Commodity Futures Trading Commission Regulation 23.434 and Appendix A thereto. This material is not intended to be individually tailored to your needs or characteristics and should not be viewed as a “call to action” or suggestion that you enter into a swap or trading strategy involving a swap or any other transaction. Scotiabank may engage in transactions in a manner inconsistent with the views discussed this report and may have positions, or be in the process of acquiring or disposing of positions, referred to in this report.
Scotiabank, its affiliates and any of their respective officers, directors and employees may from time to time take positions in currencies, act as managers, co-managers or underwriters of a public offering or act as principals or agents, deal in, own or act as market makers or advisors, brokers or commercial and/or investment bankers in relation to securities or related derivatives. As a result of these actions, Scotiabank may receive remuneration. All Scotiabank products and services are subject to the terms of applicable agreements and local regulations. Officers, directors and employees of Scotiabank and its affiliates may serve as directors of corporations.
Any securities discussed in this report may not be suitable for all investors. Scotiabank recommends that investors independently evaluate any issuer and security discussed in this report, and consult with any advisors they deem necessary prior to making any investment.
This report and all information, opinions and conclusions contained in it are protected by copyright. This information may not be reproduced without the prior express written consent of Scotiabank.
™ Trademark of The Bank of Nova Scotia. Used under license, where applicable.
Scotiabank, together with “Global Banking and Markets”, is a marketing name for the global corporate and investment banking and capital markets businesses of The Bank of Nova Scotia and certain of its affiliates in the countries where they operate, including; Scotiabank Europe plc; Scotiabank (Ireland) Designated Activity Company; Scotiabank Inverlat S.A., Institución de Banca Múltiple, Grupo Financiero Scotiabank Inverlat, Scotia Inverlat Casa de Bolsa, S.A. de C.V., Grupo Financiero Scotiabank Inverlat, Scotia Inverlat Derivados S.A. de C.V. – all members of the Scotiabank group and authorized users of the Scotiabank mark. The Bank of Nova Scotia is incorporated in Canada with limited liability and is authorised and regulated by the Office of the Superintendent of Financial Institutions Canada. The Bank of Nova Scotia is authorized by the UK Prudential Regulation Authority and is subject to regulation by the UK Financial Conduct Authority and limited regulation by the UK Prudential Regulation Authority. Details about the extent of The Bank of Nova Scotia's regulation by the UK Prudential Regulation Authority are available from us on request. Scotiabank Europe plc is authorized by the UK Prudential Regulation Authority and regulated by the UK Financial Conduct Authority and the UK Prudential Regulation Authority.
Scotiabank Inverlat, S.A., Scotia Inverlat Casa de Bolsa, S.A. de C.V, Grupo Financiero Scotiabank Inverlat, and Scotia Inverlat Derivados, S.A. de C.V., are each authorized and regulated by the Mexican financial authorities.
Not all products and services are offered in all jurisdictions. Services described are available in jurisdictions where permitted by law.