- Our updated forecast assumes more persistent imbalances between the demand- and supply-sides of the global economy; we see commodity price volatility in the near-term as we work through those imbalances.
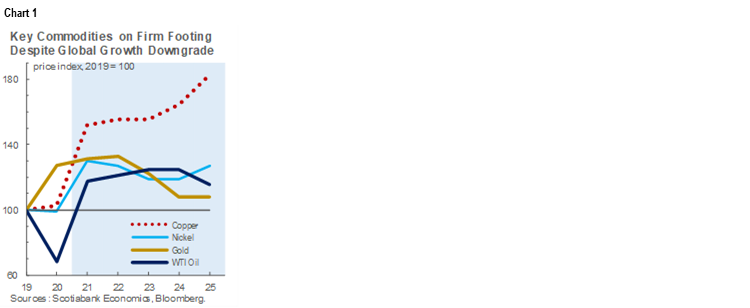
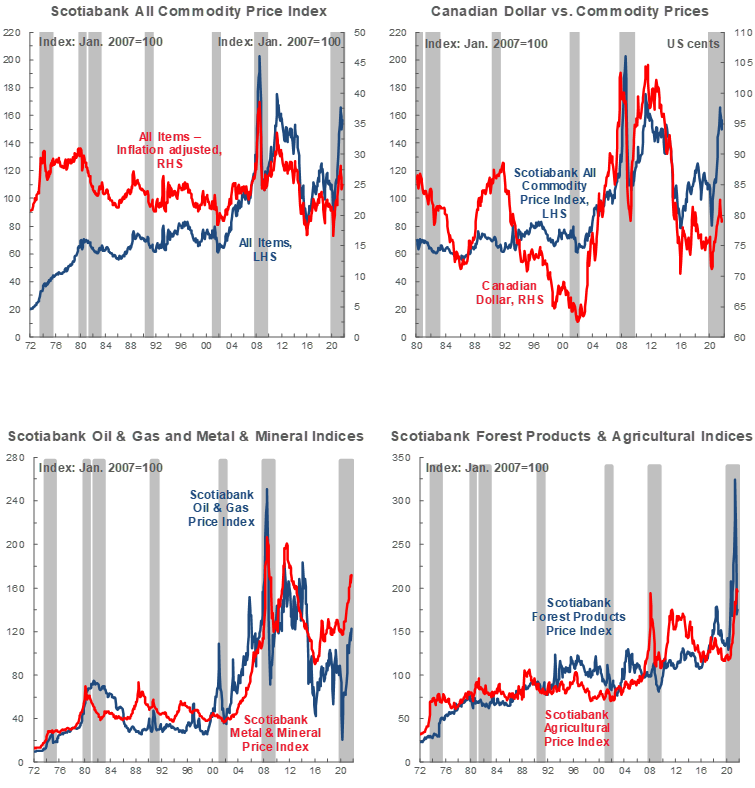
- Still, a strong global recovery should anchor fundamental support—particularly for energy and base metals—over the next several years (chart 1).
- We have revised our outlook for US and Canadian natural gas prices significantly higher.
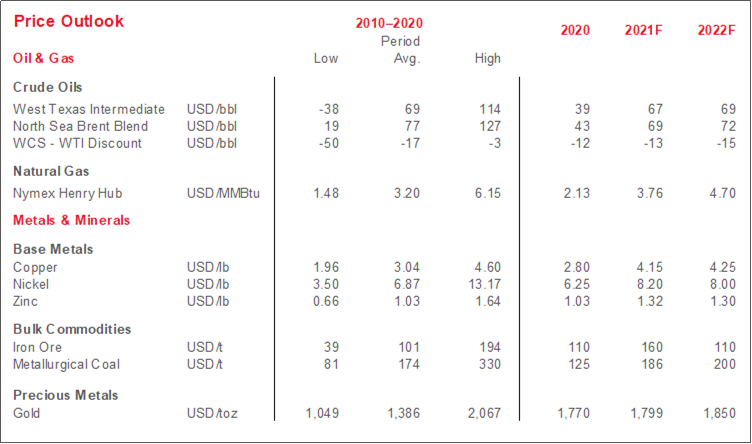
- WTI breached 80 USD/bbl for the first time since 2014, but we expect light oil prices to ease towards their previously forecast trajectory by early next year, resulting in 72 USD/bbl WTI by end-2022.
- While we project that WCS prices will generally move with their light crude counterparts, we expect their discount to WTI to widen towards 15 USD/bbl by end-2022.
- We have modestly lowered our fourth-quarter copper price forecast, but the fundamental outlook for the red metal remains strong; we have revised our nickel price outlook higher through 2023.
SUPPLY CHAIN PRESSURES MORE PERSISTENT
Our latest forecast update assumes that the imbalance between the demand- and supply-sides of economies around the world will prove more persistent than previously anticipated. Demand remains robust in many jurisdictions as they reopen from COVID-19 lockdowns, but production and transportation networks are increasingly unable to respond quickly enough to meet it. These pressures are acute in North America, where auto production guidance has been cut, manufacturing activity continues to weaken, and record numbers of job vacancies are being reported each month. We recently lowered our North American economic growth forecasts in light of these forces, while production curtailment to curb local emissions contributes to a softer Chinese outlook.
These supply bottlenecks are clearly inflationary, and we have consequently revised the outlook for price appreciation in our key markets higher. We still view the supply disruptions—and price pressures—as temporary, but they are clearly more persistent than we had previously projected. In light of this new inflation trajectory, we now believe that the Bank of Canada will raise its overnight rate by 100 basis points in H2-2022—50 bp more than anticipated as of our September forecast. We expect the Fed to begin hiking in late 2022.
In addition to supply chain constraints, we expect power grid fluctuations and emissions reduction efforts in China to drive further imbalances—and price volatility—in the near-term. Fears about elevated debt levels at Evergrande—one of China’s largest property developers—also remain and should continue to cause anxiety about the durability of economic growth in the world’s foremost metals consumer.
NATURAL GAS SPIKES, OIL’S POSITIVE AND NEGATIVE FORCES OFFSET
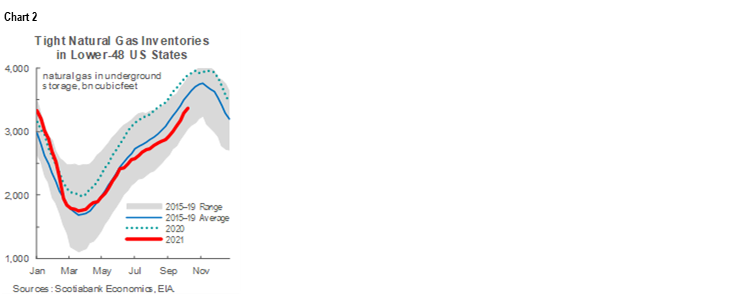
We have revised our outlook for US natural gas prices higher. Gas availability is not as limited in the US—where storage is currently about 5% below the five-year mean (chart 2, p.2)—as it is in Europe and Asia. However, the gas crunch has led to a pick up in LNG shipments and driven the Henry Hub natural gas benchmark to its highest level in almost 10 years. Still, with tight inventories and producer discipline expected to persist to some degree, we expect Henry Hub prices to peak at 5.80 USD/mn Btu in Q1 of next year and average about 4.70 USD/mn Btu for the full year. That is a 1.60 USD increase versus last quarter’s forecast for all of 2022.
Given broad increases in the benchmarks off which Western Canadian natural gas is priced, we have accordingly revised our AECO price forecasts higher. Western Canadian natural gas values continue to be weighed down by limited egress capacity, but should get some reprieve in 2022 as the NGTL pipeline system expansion is completed.
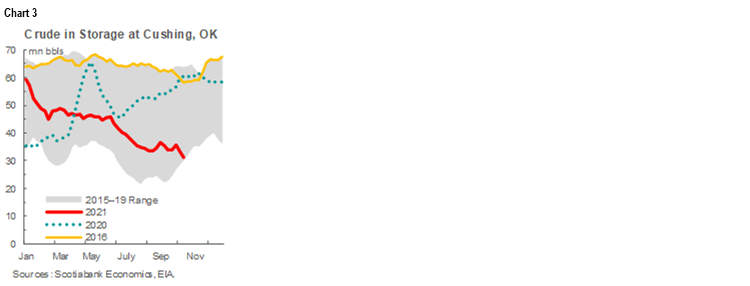
Energy users are seeking out alternative fuels as gas prices soar; with gas consumption rising, oil storage at the key Cushing hub hit its lowest levels since 2018 (chart 3) and WTI breached 80 USD/bbl for the first time since 2014. However, we expect light oil prices to ease towards their previously forecast trajectory early by next year, resulting in 75 USD/bbl Brent and 72 USD/bbl WTI by end-2022. In the near-term, we anticipate that market sentiment will fluctuate significantly in response to pandemic news flow.
As we progress through next year, we expect positive and negative pricing developments to roughly offset for global oil benchmarks. Downward revisions to Chinese growth and industrial activity as that economy works through factors such as emissions restrictions and elevated real estate sector debt levels are clearly bearish for global crude values. More positively, we expect continued capital discipline in the US shale patch to limit output growth and keep global market balances tight; that regionally concentrated limit in investment is behind a modest forecast narrowing of the forecast Brent-WTI differential. Moreover, we no longer assume that the US and Iran will proceed with a nuclear deal—which would have brought more of the latter nation’s barrels online—this year or in H1-2022.
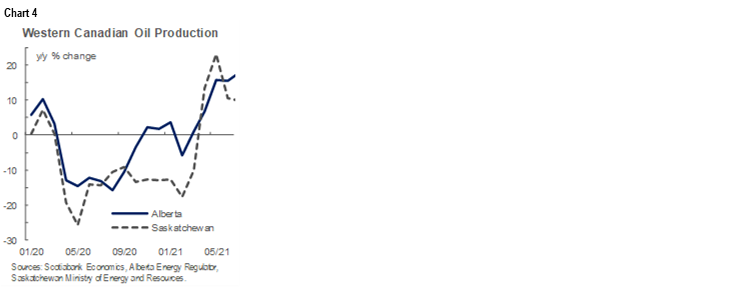
While we project that WCS prices will rise alongside their light crude counterparts, we expect the discount between the Western Canadian benchmark and WTI to widen towards 15 USD/bbl by end-2022. Key to that trajectory is our assumption that unwinding of OPEC+ production caps will increase the number of heavy sour barrels available in the US Gulf Coast—the primary destination of marginal Western Canadian crude imports—loosening the market. Our latest forecast assumes that the WTI-WCS differential will increase only to an average of just over 14 USD/bbl In the coming quarter. Added transportation capacity via the start of the Enbridge Line 3 pipeline should help to offset a wider blowout that can normally be expected in an environment of strongly rising Western Canadian crude production (chart 4) following the end of seasonal refinery turnarounds.
INDUSTRIALS: NEAR-TERM VOLATILITY, COPPER OUTLOOK BUOYANT
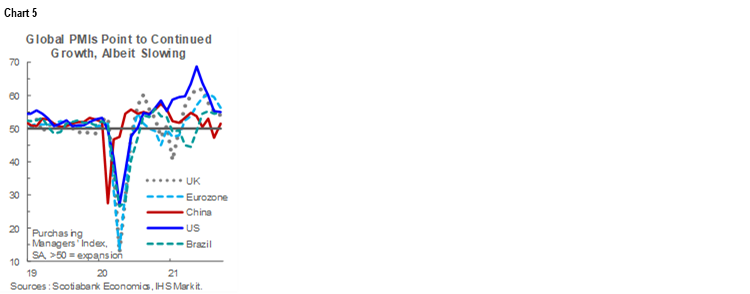
We have modestly lowered our fourth-quarter copper price forecast, but the fundamental outlook for the red metal remains strong in our view. Revisions reflect expectations of softer-than-previously-anticipated economic growth in China, a trend that already looks to have filtered into PMI readings for the country (chart 5). Yet, near-term supply challenges may provide a partial offset. Chinese emissions crackdowns and related power grid fluctuations have lowered inventories at smelters, and output disruptions in Latin America could also contribute to market tightness. Over the next several years, we foresee structural supply deficits and a price level rise towards 5 USD/lb. This assumes strong demand for the red metal via global ramp-up of decarbonization efforts, as well as limited new major project activity amid depletions at existing mines.
Though influenced by many of the same forces as copper—industrial sector activity, Chinese energy consumption, the green energy transition—we have revised our near- and long-term nickel prices higher. We still see prices easing over time, but it will be from the current range near 9 USD/lb to 7.50 by 2023, rather than from 8 USD/lb range to 7.25 as anticipated in previous forecasts. Stainless steel made up about 60% of nickel use last year; global appetite for related products via pent-up consumer demand surged in Q3 to drive nickel prices to their highest levels in nearly 10 years. Yet, that momentum has ebbed and the metal should continue to experience downward price pressure so long as Chinese power controls hamper stainless output. Over the next several years, we expect electric vehicle battery demand to be supportive, but dominated by global market oversupply as Indonesian nickel pig iron output climbs.
The depth of the recent iron ore price plunge and expected persistence of its drivers have led us to lower our forecasts for the metal. In H1-2021, it surged due to fundamental support—via robust Chinese steel output and concerns about supply coming out of Brazil—and speculative activity. It has since dropped in response to power reductions in the Middle Kingdom, Evergrande concerns, and a softer steel production outlook. With our Chinese growth outlook lowered and steel production limits likely to remain in place until after next year’s Winter Olympics, we expect iron ore prices to average about 110 USD/t through 2022. However, prospects for medium-term supply growth are uncertain with Vale’s planned production rises expected to be gradual and Sino-Australian tensions likely to discourage new capacity in the latter country.
GOLD SUPPORTED BY STILL-LOOSE US MONETARY POLICY, LINGERING UNCERTAINTY
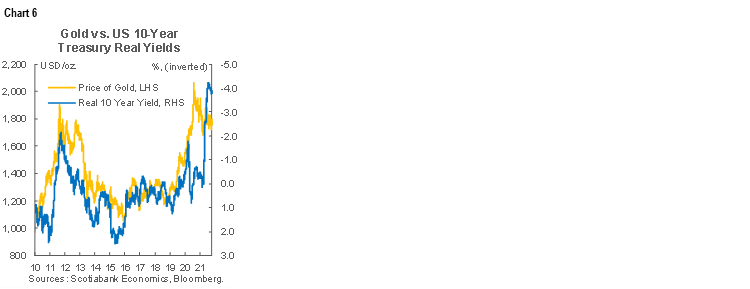
Our gold price forecast is largely unchanged at this time. We still anticipate that 2022 will be a good year for bullion pricing, and have pencilled in a historically elevated average value of 1,850 USD/oz. Values of the yellow metal tend to follow real US rates (chart 6), which should remain supportive given expectations of lingering pandemic and economic recovery uncertainty, still-accommodative US monetary policy, and stronger inflation—against which the yellow metal is seen as a hedge. We expect gold to begin to converge towards its long-run price of 1,500 USD/oz once US central bank rates begin to normalize in 2023.
TECHNICAL NOTE
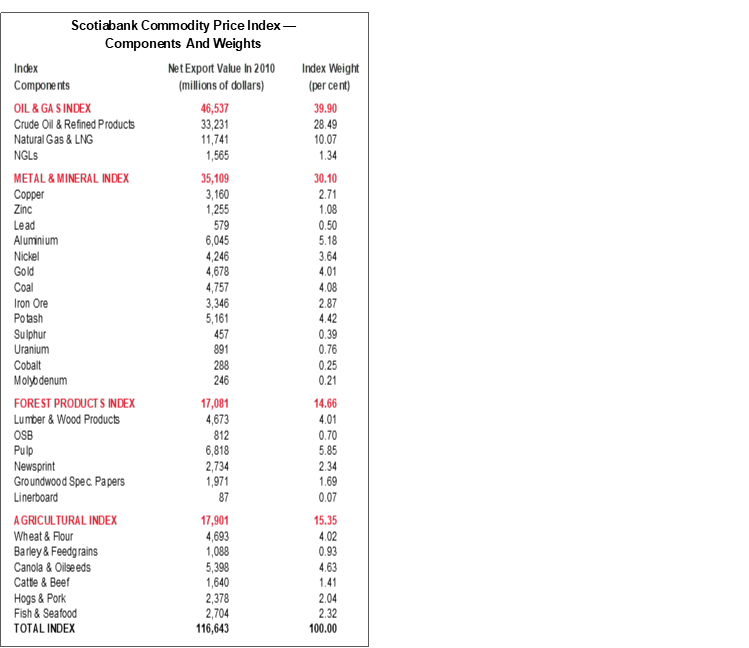
Scotiabank Commodity Price Index — Principal Canadian Exports
January 2007 = 100
This Index has been designed to track the spot or transactions prices paid in U.S. dollars for key Canadian commodities and resource-based manufactured goods in export markets. The weight of each component is based upon its net export value in 2010. Prior to January 2007, the weight of each component was based on its export value in 1995-97, except for crude oil & refined petroleum products, uncoated freesheet paper and linerboard, where net exports were used. Canada imports a significant quantity of these products, and use of their export value alone would have overstated the importance in Canada’s trade performance.
The following prices are included:
OIL & GAS
Crude Oil & Refined Petroleum Products (US$ per bbl) MSW light sweet crude oil at Edmonton (previously Edmonton Par crude) and Western Canadian Select heavy oil at Hardisty, Alberta; price differentials off WTI near-by futures from Bloomberg.
Natural Gas (US$ per mcf) Average export price quoted by the National Energy Board.
Natural Gas Liquids (NGLs – Propane, Butane, Ethane & Pentanes-Plus) (US$ per bbl), Propane at Edmonton & Sarnia.
METALS & MINERALS
Copper & Products (US$ per lb) LME official cash settlement price for grade A copper.
Zinc (US$ per lb) LME SHG cash settlement: prior to Sept 1990, U.S. producers’ price for high-grade zinc delivered.
Lead (US$ per lb) LME official cash settlement price; prior to Jan. 1991, U.S. producers’ price for common grade delivered.
Aluminium & Products (US$ per lb) since 1979, LME official cash settlement price.
Nickel (US$ per lb) since 1980, LME official cash settlement price.
Gold (US$ per oz) ‘LBMA Gold Price PM’ as of March 20, 2015.
Potash (US$ per tonne) Standard potassium chloride, spot price, FOB Vancouver.
Sulphur (US$ per tonne) Solid, spot price, FOB Vancouver.
Metallurgical Coal (US$ per tonne) Contract price for premium-grade hard coking coal, FOB Vancouver.
Iron Ore (US cents per dmtu) Spot price fines 62% Fe, CFR Qingdao, China; prior to Jan 2011, term-contract price for concentrates 66% Fe from Labrador/Quebec to Northern Europe (FOB Sept-Iles).
Uranium (US$ per lb) U3O8 near-by-futures from Bloomberg.
Molybdenum (US$ per lb) since March 1992, MW dealer oxide.
Cobalt (US$ per lb) MW dealer price.
FOREST PRODUCTS
Lumber & Wood Products, Western Spruce-Pine-Fir 2x4 No.2 & Btr (US$ per mfbm) FOB mill.
Oriented Strandboard (US$ per thousand sq. ft.), U.S. North Central region, 7/16 inch.
Pulp, Bleached Northern Softwood Kraft (US$ per tonne) Transactions price, delivery USA.
Newsprint (US$ per tonne) Average transactions price, 45 grams, delivery Eastern USA.
Groundwood Specialty Papers (US$ per ton) Supercalendered-A paper, 35 lb., delivery USA.
Linerboard (US$ per ton), delivery Eastern USA with zone discounts.
AGRICULTURE
Wheat & Flour (US$ per tonne), DNS No 1 14% protein Duluth, Minn; prior to April 2011 No.1 CWRS, 13.5% protein at St. Lawrence.
Barley (US$ per tonne), Manitoba Agriculture and Food No. 1 Canadian western barley aggregate spot price; historical data No. 1 at Lethbridge, Alberta.
Canola & Oilseeds (US$ per tonne) No.1 Canada, in store Vancouver.
Cattle & Beef (US$ per cwt) Steers over 1,051 pounds at Toronto; from Jan 1993, Ontario average.
Hogs & Pork (US$ per cwt) 100 Index Hogs at Toronto; from Jan 1993, Ontario average.
Fish & Seafood (US$ per lb) West Coast silver coho salmon; Atlantic lobster prices; prior to 1986 cod fillets & blocks.
DISCLAIMER
This report has been prepared by Scotiabank Economics as a resource for the clients of Scotiabank. Opinions, estimates and projections contained herein are our own as of the date hereof and are subject to change without notice. The information and opinions contained herein have been compiled or arrived at from sources believed reliable but no representation or warranty, express or implied, is made as to their accuracy or completeness. Neither Scotiabank nor any of its officers, directors, partners, employees or affiliates accepts any liability whatsoever for any direct or consequential loss arising from any use of this report or its contents.
These reports are provided to you for informational purposes only. This report is not, and is not constructed as, an offer to sell or solicitation of any offer to buy any financial instrument, nor shall this report be construed as an opinion as to whether you should enter into any swap or trading strategy involving a swap or any other transaction. The information contained in this report is not intended to be, and does not constitute, a recommendation of a swap or trading strategy involving a swap within the meaning of U.S. Commodity Futures Trading Commission Regulation 23.434 and Appendix A thereto. This material is not intended to be individually tailored to your needs or characteristics and should not be viewed as a “call to action” or suggestion that you enter into a swap or trading strategy involving a swap or any other transaction. Scotiabank may engage in transactions in a manner inconsistent with the views discussed this report and may have positions, or be in the process of acquiring or disposing of positions, referred to in this report.
Scotiabank, its affiliates and any of their respective officers, directors and employees may from time to time take positions in currencies, act as managers, co-managers or underwriters of a public offering or act as principals or agents, deal in, own or act as market makers or advisors, brokers or commercial and/or investment bankers in relation to securities or related derivatives. As a result of these actions, Scotiabank may receive remuneration. All Scotiabank products and services are subject to the terms of applicable agreements and local regulations. Officers, directors and employees of Scotiabank and its affiliates may serve as directors of corporations.
Any securities discussed in this report may not be suitable for all investors. Scotiabank recommends that investors independently evaluate any issuer and security discussed in this report, and consult with any advisors they deem necessary prior to making any investment.
This report and all information, opinions and conclusions contained in it are protected by copyright. This information may not be reproduced without the prior express written consent of Scotiabank.
™ Trademark of The Bank of Nova Scotia. Used under license, where applicable.
Scotiabank, together with “Global Banking and Markets”, is a marketing name for the global corporate and investment banking and capital markets businesses of The Bank of Nova Scotia and certain of its affiliates in the countries where they operate, including; Scotiabank Europe plc; Scotiabank (Ireland) Designated Activity Company; Scotiabank Inverlat S.A., Institución de Banca Múltiple, Grupo Financiero Scotiabank Inverlat, Scotia Inverlat Casa de Bolsa, S.A. de C.V., Grupo Financiero Scotiabank Inverlat, Scotia Inverlat Derivados S.A. de C.V. – all members of the Scotiabank group and authorized users of the Scotiabank mark. The Bank of Nova Scotia is incorporated in Canada with limited liability and is authorised and regulated by the Office of the Superintendent of Financial Institutions Canada. The Bank of Nova Scotia is authorized by the UK Prudential Regulation Authority and is subject to regulation by the UK Financial Conduct Authority and limited regulation by the UK Prudential Regulation Authority. Details about the extent of The Bank of Nova Scotia's regulation by the UK Prudential Regulation Authority are available from us on request. Scotiabank Europe plc is authorized by the UK Prudential Regulation Authority and regulated by the UK Financial Conduct Authority and the UK Prudential Regulation Authority.
Scotiabank Inverlat, S.A., Scotia Inverlat Casa de Bolsa, S.A. de C.V, Grupo Financiero Scotiabank Inverlat, and Scotia Inverlat Derivados, S.A. de C.V., are each authorized and regulated by the Mexican financial authorities.
Not all products and services are offered in all jurisdictions. Services described are available in jurisdictions where permitted by law.