SUMMARY
- Economic data released in November continued to highlight supply chain challenges, accelerating price gains, and supply-demand imbalances; these continued to influence commodity markets.
- Gold prices closed as high as 1,865 USD/oz for the first time since June 2021 in response to inflationary signals, then gave up some ground later in the month.
- Crude supplies are still very tight, but prices slid late this month in response to new COVID-19 lockdown fears and news that strategic reserves could be released to combat the global supply crunch.
- WCS’s discount to WTI has blown out due to greater heavy oil availability in the US Gulf Coast (USGC), lingering Hurricane Ida impacts, and higher refinery costs via elevated natural gas prices.
- Industrial metals remain well-supported despite uncertainty on the supply chain front; China’s apparent success in reducing output in emissions-intensive sectors may lead to stronger near-term activity.
- We plan to stop producing the Scotiabank Commodity Price Index in January 2022, but will continue to release a monthly report on commodity price developments.
PRICE GAINS STILL DOMINATING GLOBAL ECONOMIC HEADLINES
Incoming data continue to indicate that the global economy is in the midst of accelerating price pressures, and that has clearly influenced market sentiment and commodity price movements. October’s headline +6.2% y/y CPI print for the US, for instance, was the fastest rate of inflation reported in that country in more than 30 years, and jurisdictions around the world continue to release above-target readings. Against that backdrop, the US Federal Reserve began to wind down stimulative bond purchases this month, and markets are increasingly pricing in American central bank rate hikes beginning in Q3-2022.
This month, policy changes also influenced commodity pricing. Markets appeared to respond not only to inflation readings and bond buying plans, but to the choice of who will lead the Federal Reserve in the next term. China may be ready to ease some steel production restrictions that drove pricing volatility in recent months. And crude traders are clearly watching plans for strategic petroleum reserves as well as OPEC+ production guidance.
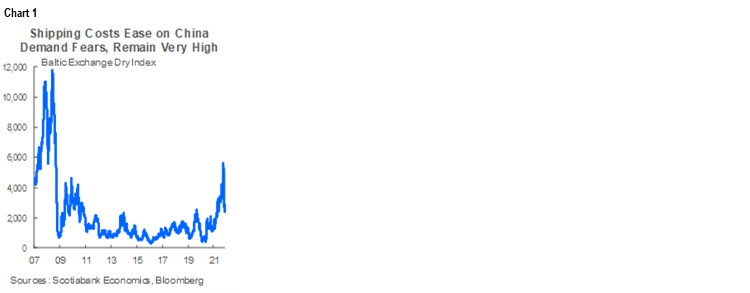
How long will these price pressures last? Our view remains that they are being driven primarily by global supply chains’ inability to meet demand in these early stages of the global economic reopening. We expect these imbalances to subside as we progress through next year and gain more control of COVID-19 globally. In fact, shipping costs—recently cited as a major hindrance to growth around the world—already appear to be easing from the 12-year high attained earlier this year (chart 1, p.1). Some of that likely relates to recent fears of softer growth in China, but there is downside on the potential spread of the virus.
HOT INFLATION READINGS CONTINUE TO BUOY PRECIOUS METALS
Gold prices jumped this month to temporarily exceed the 1,860 USD/oz mark for the first time since June 2021. Bullion investors are clearly responding to inflationary anxiety, as suggested by the surge in values since a stronger-than-anticipated y/y climb in the US consumer price index early this month (chart 2). Continued dovish communications from several central banks reinforced price gains, and look to have also contributed to gold’s draw as an inflation hedge. However, the yellow metal lost almost 50 USD/oz on Monday as news broke that US President Biden would keep Jerome Powell as Chair of the Federal Reserve, which markets interpreted as a hawkish signal. Still, our forecast of above-target inflation and still-low US interest rates into next year implies well-supported bullion values in 2022.

By the same token, silver prices eclipsed the 25 USD/oz threshold for the first time since July and are on track for their first monthly gain since May. Also perceived as a safe haven and an inflation hedge, the metal’s value is influenced by many of the same factors as that of bullion. However, given silver’s range of industrial applications and our expectations of some China-driven near-term slowdown in construction and manufacturing activity, we are less optimistic about its near-term prospects than we are for bullion.
OIL AND GAS PRICES SLIDE WITH NEW LOCKDOWNS, RESERVE RELEASES
It was a broadly negative month for oil prices, reflecting global growth concerns related to new lockdowns in Europe and expectations that strategic petroleum reserves could be released in the US and Asia to combat supply shortages. Additional supply-side pressures came when Libya’s National Oil Company announced that output at the Al-Khair oilfield (10k bpd) would be allowed to go ahead, while weakening Chinese imports weighed on demand. Crude values saw modest gains towards the end of the month when news broke that OPEC+ might ease plans to increase production in an effort to offset the recent slide.
In the US, weak oil and gas inventories continue to reinforce each other. Though the amount of natural gas in storage has converged towards its five-year average amid warmer-than-anticipated weather, supplies remain tight and some projections point to a cooler winter. Germany’s suspension of certification of Nord Stream 2—a pipeline that would transport natural gas from Russia to Germany—raised fears that global gas market tightness will be exacerbated. Against that backdrop, crude oil inventories are very low as consumers seek out alternative fuel sources.
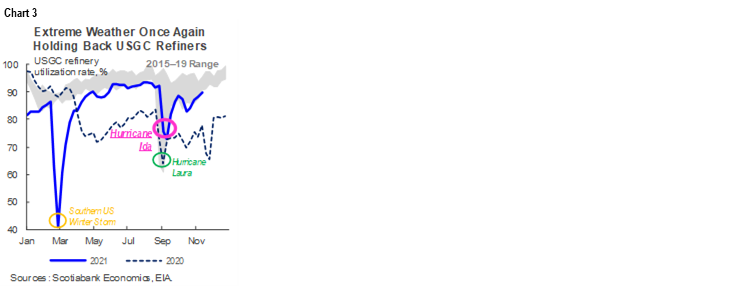
WCS’s discount to WTI is blowing out; this month it eclipsed 20 USD/bbl twice and averaged about 19 USD/bbl—the highest levels seen since before the pandemic. We highlight three drivers of the wider differential. First, as noted several times in recent months, rising OPEC+ production has increased the availability of heavy barrels in the US Gulf Coast (USGC), unwinding Western Canada’s advantage during the pandemic thus far. Alberta output is also well above pre-pandemic levels, while Saskatchewan production continues to recover. Second, USGC refinery capacity has yet to fully bounce back from shutdowns related to Hurricane Ida (chart 3, p.2), which means reduced demand for Canadian and other heavy crude for upgrade. Finally, we suspect that elevated natural gas prices are contributing to higher costs at refineries.
MIXED INDUSTRIAL METALS RESULTS
Copper prices edged lower to average about 4.40 USD/lb in November despite a preponderance of bearish signals on the demand side. The index for the US dollar—in which the red metal is priced—climbed in anticipation of faster-than-previously stated Fed rate hikes. Economic data from China also continue to suggest a slowdown in the world’s largest metals consumer—particularly in the copper-intensive real estate sector. Yet, the bellwether red metal got a bit of a boost from the apparently amicable start to diplomatic talks between Washington and Beijing. Going forward, we Chinese power grid restrictions that aim to cut emissions before February’s Winter Olympics should weigh on smelter activity and prices.
Nickel prices continued to rise this month—their average just under 9 USD/lb was the highest since February 2012. Some of that movement may relate to seasonal rain in the Philippines that has limited that country’s export capacity and led to expectations of market tightness. The metal has also benefited from strong stainless steel demand and scarcity vis-à-vis supply chain issues. Pricing looks to have responded positively to a stronger-than-anticipated European PMI reading for November—published this week—as well. We still see a risk of oversupply next year as Indonesian nickel pig iron production ramps up, which could push prices lower; however, nickel will likely enter 2022 with considerably more momentum than we anticipated as of our last forecast update.
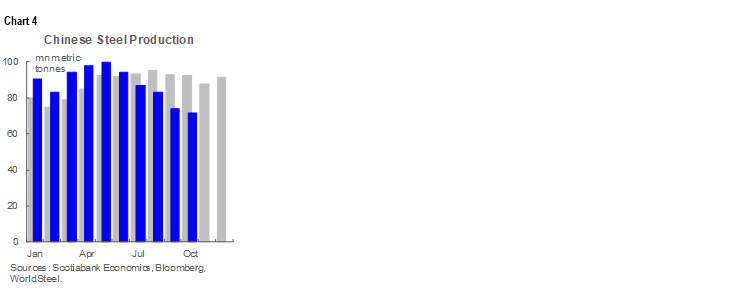
Iron ore prices continued to slide in November with Chinese steel output curbs in place, but gained towards the end of the month as news broke that steelmakers may be able to resume production. Prices closed as low as 90 USD/t this month—the lowest level since May of last year. However, data from October suggest that China was able to reduce January–October steel output versus year-earlier levels (chart 4, p.2)—quite a feat given the strong start to 2021—which leaves room to raise production in the coming months. These movements are consistent with our forecast. We had already anticipated that prices would rebound as easing Chinese restrictions increasingly contribute to higher steel production and better iron ore demand in the leadup to and after the 2022 Winter Olympics in Beijing.
LUMBER PRICES JUMP IN WAKE OF BRITISH COLUMBIA STORM
Assessment of the full impacts of the floods and mudslides in British Columbia will take months, but lumber prices have already responded. WSPF climbed to 620 USD/thousand board-feet last week—a state of emergency was declared in BC on November 17th—a per-unit increase of 65 USD that represented the strongest weekly gain since May. Product shortages are expected with roads and rail routes out of Canada’s largest lumber-producing region blocked. Lumber prices usually begin to climb at this time of year as builders tend to stockpile materials during the winter in order to meet peak construction demand in the spring; flood impacts will likely add to this dynamic. They also come on the heels of this summer`s extreme heat and record wildfires, which similarly snarled BC transportation routes.


TECHNICAL NOTE
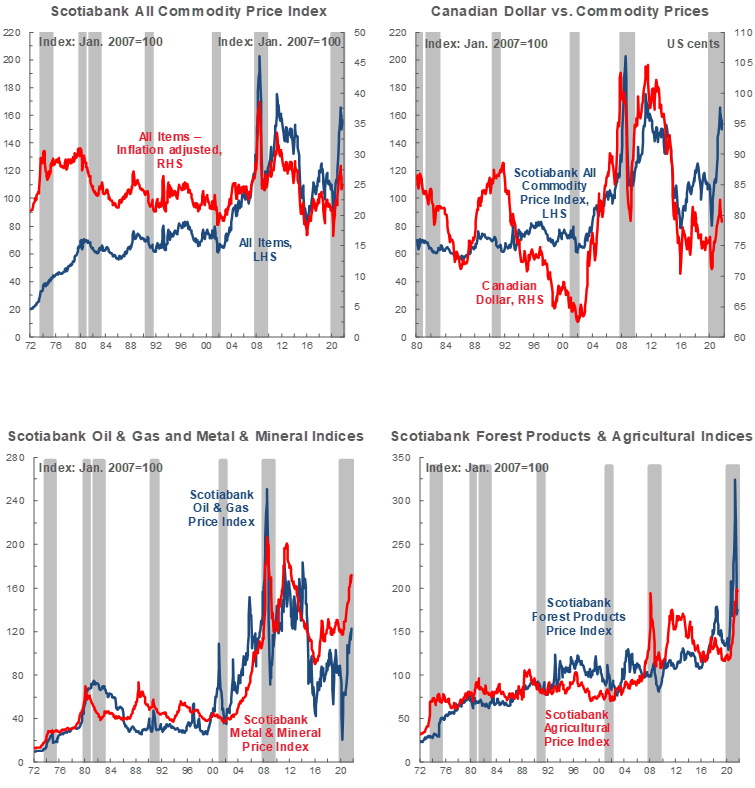
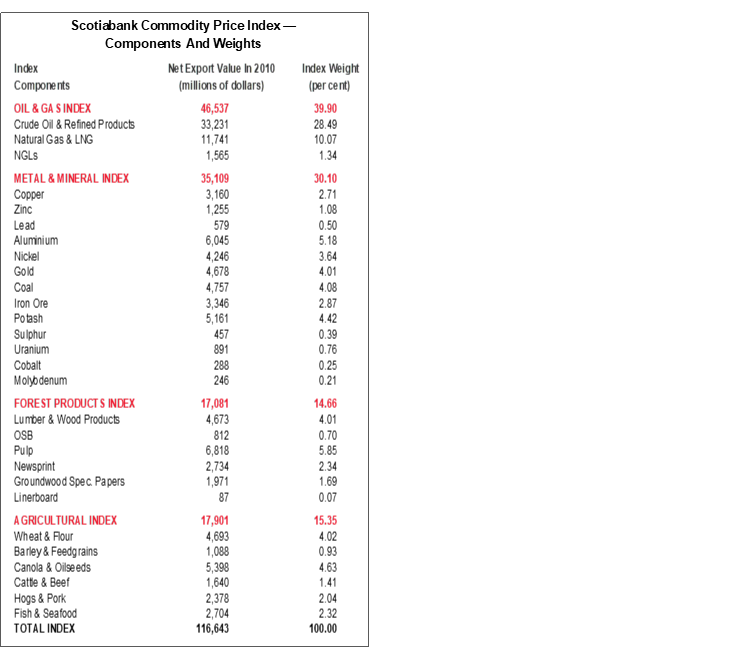
Scotiabank Commodity Price Index — Principal Canadian Exports
January 2007 = 100
This Index has been designed to track the spot or transactions prices paid in U.S. dollars for key Canadian commodities and resource-based manufactured goods in export markets. The weight of each component is based upon its net export value in 2010. Prior to January 2007, the weight of each component was based on its export value in 1995-97, except for crude oil & refined petroleum products, uncoated freesheet paper and linerboard, where net exports were used. Canada imports a significant quantity of these products, and use of their export value alone would have overstated the importance in Canada’s trade performance.
The following prices are included:
OIL & GAS
Crude Oil & Refined Petroleum Products (US$ per bbl) MSW light sweet crude oil at Edmonton (previously Edmonton Par crude) and Western Canadian Select heavy oil at Hardisty, Alberta; price differentials off WTI near-by futures from Bloomberg.
Natural Gas (US$ per mcf) Average export price quoted by the National Energy Board.
Natural Gas Liquids (NGLs – Propane, Butane, Ethane & Pentanes-Plus) (US$ per bbl), Propane at Edmonton & Sarnia.
METALS & MINERALS
Copper & Products (US$ per lb) LME official cash settlement price for grade A copper.
Zinc (US$ per lb) LME SHG cash settlement: prior to Sept 1990, U.S. producers’ price for high-grade zinc delivered.
Lead (US$ per lb) LME official cash settlement price; prior to Jan. 1991, U.S. producers’ price for common grade delivered.
Aluminium & Products (US$ per lb) since 1979, LME official cash settlement price.
Nickel (US$ per lb) since 1980, LME official cash settlement price.
Gold (US$ per oz) ‘LBMA Gold Price PM’ as of March 20, 2015.
Potash (US$ per tonne) Standard potassium chloride, spot price, FOB Vancouver.
Sulphur (US$ per tonne) Solid, spot price, FOB Vancouver.
Metallurgical Coal (US$ per tonne) Contract price for premium-grade hard coking coal, FOB Vancouver.
Iron Ore (US cents per dmtu) Spot price fines 62% Fe, CFR Qingdao, China; prior to Jan 2011, term-contract price for concentrates 66% Fe from Labrador/Quebec to Northern Europe (FOB Sept-Iles).
Uranium (US$ per lb) U3O8 near-by-futures from Bloomberg.
Molybdenum (US$ per lb) since March 1992, MW dealer oxide.
Cobalt (US$ per lb) MW dealer price.
FOREST PRODUCTS
Lumber & Wood Products, Western Spruce-Pine-Fir 2x4 No.2 & Btr (US$ per mfbm) FOB mill.
Oriented Strandboard (US$ per thousand sq. ft.), U.S. North Central region, 7/16 inch.
Pulp, Bleached Northern Softwood Kraft (US$ per tonne) Transactions price, delivery USA.
Newsprint (US$ per tonne) Average transactions price, 45 grams, delivery Eastern USA.
Groundwood Specialty Papers (US$ per ton) Supercalendered-A paper, 35 lb., delivery USA.
Linerboard (US$ per ton), delivery Eastern USA with zone discounts.
AGRICULTURE
Wheat & Flour (US$ per tonne), DNS No 1 14% protein Duluth, Minn; prior to April 2011 No.1 CWRS, 13.5% protein at St. Lawrence.
Barley (US$ per tonne), Manitoba Agriculture and Food No. 1 Canadian western barley aggregate spot price; historical data No. 1 at Lethbridge, Alberta.
Canola & Oilseeds (US$ per tonne) No.1 Canada, in store Vancouver.
Cattle & Beef (US$ per cwt) Steers over 1,051 pounds at Toronto; from Jan 1993, Ontario average.
Hogs & Pork (US$ per cwt) 100 Index Hogs at Toronto; from Jan 1993, Ontario average.
Fish & Seafood (US$ per lb) West Coast silver coho salmon; Atlantic lobster prices; prior to 1986 cod fillets & blocks.
DISCLAIMER
This report has been prepared by Scotiabank Economics as a resource for the clients of Scotiabank. Opinions, estimates and projections contained herein are our own as of the date hereof and are subject to change without notice. The information and opinions contained herein have been compiled or arrived at from sources believed reliable but no representation or warranty, express or implied, is made as to their accuracy or completeness. Neither Scotiabank nor any of its officers, directors, partners, employees or affiliates accepts any liability whatsoever for any direct or consequential loss arising from any use of this report or its contents.
These reports are provided to you for informational purposes only. This report is not, and is not constructed as, an offer to sell or solicitation of any offer to buy any financial instrument, nor shall this report be construed as an opinion as to whether you should enter into any swap or trading strategy involving a swap or any other transaction. The information contained in this report is not intended to be, and does not constitute, a recommendation of a swap or trading strategy involving a swap within the meaning of U.S. Commodity Futures Trading Commission Regulation 23.434 and Appendix A thereto. This material is not intended to be individually tailored to your needs or characteristics and should not be viewed as a “call to action” or suggestion that you enter into a swap or trading strategy involving a swap or any other transaction. Scotiabank may engage in transactions in a manner inconsistent with the views discussed this report and may have positions, or be in the process of acquiring or disposing of positions, referred to in this report.
Scotiabank, its affiliates and any of their respective officers, directors and employees may from time to time take positions in currencies, act as managers, co-managers or underwriters of a public offering or act as principals or agents, deal in, own or act as market makers or advisors, brokers or commercial and/or investment bankers in relation to securities or related derivatives. As a result of these actions, Scotiabank may receive remuneration. All Scotiabank products and services are subject to the terms of applicable agreements and local regulations. Officers, directors and employees of Scotiabank and its affiliates may serve as directors of corporations.
Any securities discussed in this report may not be suitable for all investors. Scotiabank recommends that investors independently evaluate any issuer and security discussed in this report, and consult with any advisors they deem necessary prior to making any investment.
This report and all information, opinions and conclusions contained in it are protected by copyright. This information may not be reproduced without the prior express written consent of Scotiabank.
™ Trademark of The Bank of Nova Scotia. Used under license, where applicable.
Scotiabank, together with “Global Banking and Markets”, is a marketing name for the global corporate and investment banking and capital markets businesses of The Bank of Nova Scotia and certain of its affiliates in the countries where they operate, including; Scotiabank Europe plc; Scotiabank (Ireland) Designated Activity Company; Scotiabank Inverlat S.A., Institución de Banca Múltiple, Grupo Financiero Scotiabank Inverlat, Scotia Inverlat Casa de Bolsa, S.A. de C.V., Grupo Financiero Scotiabank Inverlat, Scotia Inverlat Derivados S.A. de C.V. – all members of the Scotiabank group and authorized users of the Scotiabank mark. The Bank of Nova Scotia is incorporated in Canada with limited liability and is authorised and regulated by the Office of the Superintendent of Financial Institutions Canada. The Bank of Nova Scotia is authorized by the UK Prudential Regulation Authority and is subject to regulation by the UK Financial Conduct Authority and limited regulation by the UK Prudential Regulation Authority. Details about the extent of The Bank of Nova Scotia's regulation by the UK Prudential Regulation Authority are available from us on request. Scotiabank Europe plc is authorized by the UK Prudential Regulation Authority and regulated by the UK Financial Conduct Authority and the UK Prudential Regulation Authority.
Scotiabank Inverlat, S.A., Scotia Inverlat Casa de Bolsa, S.A. de C.V, Grupo Financiero Scotiabank Inverlat, and Scotia Inverlat Derivados, S.A. de C.V., are each authorized and regulated by the Mexican financial authorities.
Not all products and services are offered in all jurisdictions. Services described are available in jurisdictions where permitted by law.