SUMMARY
- Imbalances between the demand- and supply-sides of the world economy have led us to revise growth forecasts lower, and set the stage for commodity price volatility in the coming months.
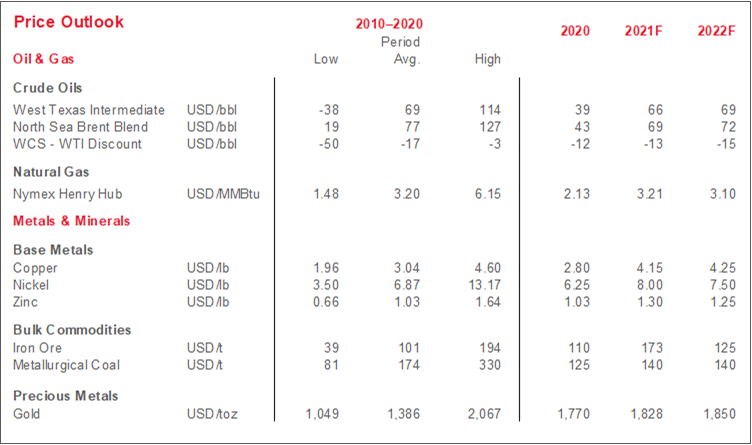
- Light crude prices gained on hurricane-related US Gulf Coast (USGC) production shut-ins and signs of rising fuel consumption.
- Western Canadian crude pricing slid to begin September as USGC activity faltered but regained ground in response to a supply cut later in the month; production and drilling data continued to come in strong.
- Alongside supply chain issues mounting across the global economy, fears about Evergrande’s debt levels and China’s ongoing pollution reduction efforts spurred fluctuations in industrial metals prices.
SUPPLY CHAIN CONSTRAINTS HOLD BACK ECONOMIC GROWTH
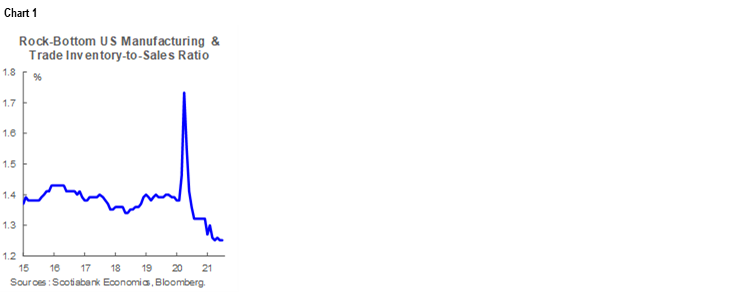
If one issue dominates the current global landscape, it is the imbalance between the demand- and supply-sides of economies around the world. Demand is robust in many jurisdictions as they reopen from COVID-19 lockdowns, but production and transportation networks are not able to respond quickly enough to meet it. In the US, product inventories are exceptionally low (chart 1) and output reductions have been announced in the auto sector—particularly reliant on complex global supply chains. In Canada, a surprise second quarter contraction resulted from these factors, and record numbers of job vacancies are being reported each month. We recently lowered our North American economic growth forecasts in light of these forces.
Though we still see conditions as conducive to strong growth over the next several years, revisions to our outlook are clearly consistent with stronger inflation, and bottlenecks have already driven jumps in input product prices. In both Canada and the US, we expect measures of core inflation to hover above the rates targeted by central banks through 2023. We remain confident that the Bank of Canada will raise its policy rate mid-late next year despite the mark-down to our growth forecasts, and that the Fed will follow in 2023.
With supply chain issues mounting across the global economy, regional developments added to imbalances and volatility in commodity markets this month. Fears about elevated debt levels at Evergrande—one of China’s largest property developers—rippled through financial markets and caused anxiety about the durability of economic growth in the world’s foremost metals consumer. Moreover, Beijing’s ongoing efforts to rein in emissions in advance of next year’s Winter Olympics are subduing factory activity and local energy use, which has impacted base metals demand and supply. US data also revealed some of the early impacts of Hurricane Ida.
Near-term volatility is the most likely result of these trends. While we still see the growth outlook as supportive of values of most commodities in our coverage universe, prices will no doubt adjust in the coming months as consumers and businesses alike grapple with supply-demand imbalances.
PRODUCTION SHUT-INS LIFT CRUDE VALUES
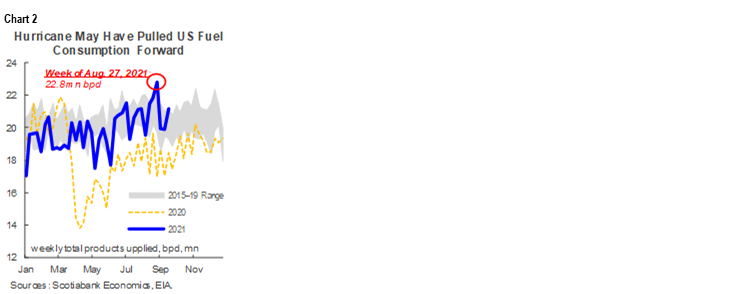
Light crude prices rebounded nicely in September after experiencing steep drops in August. WTI’s rise above the 75 USD/bbl mark reflected a double whammy of effects from Hurricane Ida—shut-in Gulf Coast activity drove expectations of tighter North American oil market balances and also looks to have pulled some demand forward. Weekly US product supplied—a proxy for American fuel consumption—made headlines for reaching its highest level since 1990 (chart 2). Against that backdrop, OPEC+ maintained its previously planned output cuts amid signs of improving global demand. Accordingly, Brent neared the 80 USD/bbl mark towards month-end.
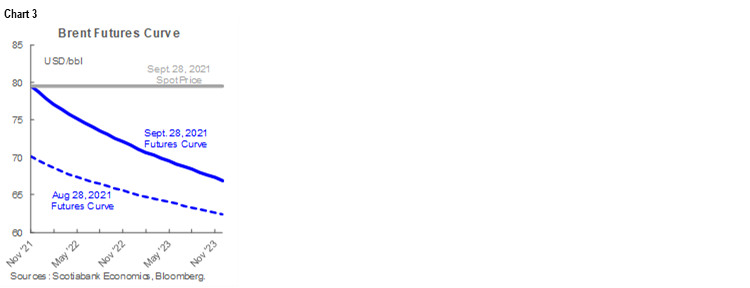
Light crude forward curves remain backwardated (Brent depicted in chart 3), having steepened and shifted higher since last month.
Western Canadian crude pricing softened to begin September—unsurprising given that USGC refineries shut down by the hurricane are a key source of marginal demand—but regained ground at month end. The rise in WCS values came as news broke of supply cuts via a shutdown of a major bitumen upgrading facility due to mechanical issues. Markets appear to be interpreting that event as an offset to the abundant flow of barrels from Canada’s oil-producing heartland. In August, crude output was well above pre-pandemic levels and drilling continued to climb in Alberta, and continued to rise significantly versus last year in Saskatchewan. Shut-ins in Canada and the USGC should ease in the coming months, with new support for egress capacity when the Line 3 pipeline enters service later this year.
CHINA POLLUTION CRACKDOWN UPENDS METALS MARKET BALANCES
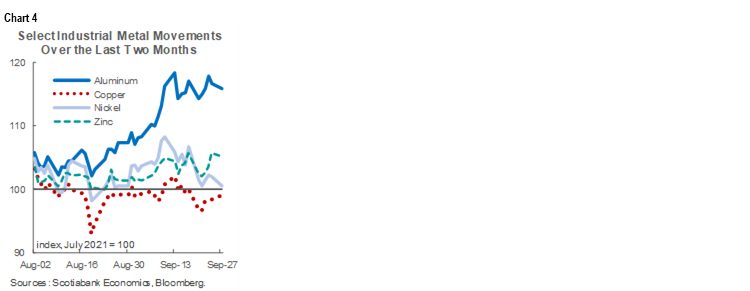
Copper prices once again averaged about 4.30 USD/lb in September—below the record highs attained earlier this year but still well above their historical mean. Evergrande-related jitters hurt risk sentiment—and values of the bellwether red metal by extension—in September (chart 4). However, towards month-end, low inventories—stemming from lower smelter activity via restrictions intended to curtail air pollution—supported market tightness and price gains.
Iron ore continues to bear the brunt of those emissions curtailment efforts. This month, it experienced a few ups and downs related to Evergrande news and sporadic jumps in domestic power prices and usage, but its trajectory is dominated by the more direct effect of restrictions on steel production that aim to curb pollution. A key input for that process, iron ore averaged 124 USD/t in September and closed as low as 103 USD/t. That is a far cry from the level above 220 USD/t achieved just two months ago.
For nickel, power restrictions thus far appear to have mostly impacted stainless steel factories. The alloy is one of nickel’s principal end-uses, and as such, prices for the metal have been under significant downward pressure over the last week and a half. Early this month, nickel prices eclipsed 9.20 USD/lb—the highest mark in more than 10 years—in large part because of strong demand for stainless steel products via some release of pent-up consumer spending. Signs of supply shortages also contributed.
Aluminum prices have fluctuated as well. Fears of a Chinese supply crunch lifted the metal’s value north of 1.30 USD/lb this month—its highest level since 2008.
GOLD BUYERS WATCH FED GUIDANCE
Bullion trended generally downward over the course of September. The yellow metal began the month trading north of 1,810 USD/oz but had gradually eased towards the 1,750 USD/oz mark. That trend reflects a rise in the US dollar amid weaker risk sentiment, as well as a response to communications that the US central bank will act to quell inflationary pressures, against which gold is traditionally seen as a hedge.
TECHNICAL NOTE
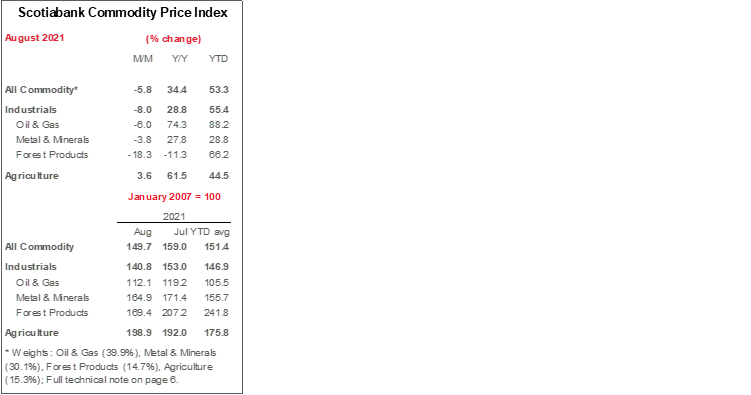
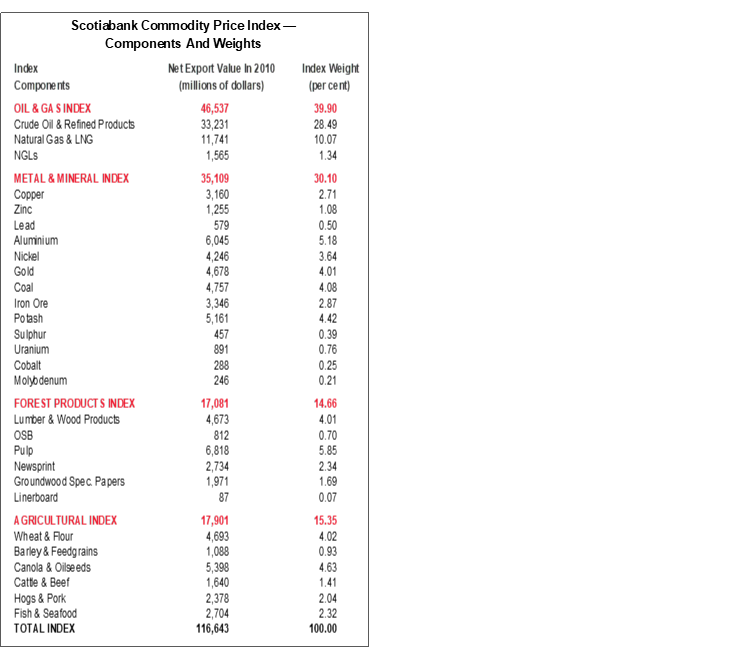
Scotiabank Commodity Price Index — Principal Canadian Exports
January 2007 = 100
This Index has been designed to track the spot or transactions prices paid in U.S. dollars for key Canadian commodities and resource-based manufactured goods in export markets. The weight of each component is based upon its net export value in 2010. Prior to January 2007, the weight of each component was based on its export value in 1995-97, except for crude oil & refined petroleum products, uncoated freesheet paper and linerboard, where net exports were used. Canada imports a significant quantity of these products, and use of their export value alone would have overstated the importance in Canada’s trade performance.
The following prices are included:
OIL & GAS
Crude Oil & Refined Petroleum Products (US$ per bbl) MSW light sweet crude oil at Edmonton (previously Edmonton Par crude) and Western Canadian Select heavy oil at Hardisty, Alberta; price differentials off WTI near-by futures from Bloomberg.
Natural Gas (US$ per mcf) Average export price quoted by the National Energy Board.
Natural Gas Liquids (NGLs – Propane, Butane, Ethane & Pentanes-Plus) (US$ per bbl), Propane at Edmonton & Sarnia.
METALS & MINERALS
Copper & Products (US$ per lb) LME official cash settlement price for grade A copper.
Zinc (US$ per lb) LME SHG cash settlement: prior to Sept 1990, U.S. producers’ price for high-grade zinc delivered.
Lead (US$ per lb) LME official cash settlement price; prior to Jan. 1991, U.S. producers’ price for common grade delivered.
Aluminium & Products (US$ per lb) since 1979, LME official cash settlement price.
Nickel (US$ per lb) since 1980, LME official cash settlement price.
Gold (US$ per oz) ‘LBMA Gold Price PM’ as of March 20, 2015.
Potash (US$ per tonne) Standard potassium chloride, spot price, FOB Vancouver.
Sulphur (US$ per tonne) Solid, spot price, FOB Vancouver.
Metallurgical Coal (US$ per tonne) Contract price for premium-grade hard coking coal, FOB Vancouver.
Iron Ore (US cents per dmtu) Spot price fines 62% Fe, CFR Qingdao, China; prior to Jan 2011, term-contract price for concentrates 66% Fe from Labrador/Quebec to Northern Europe (FOB Sept-Iles).
Uranium (US$ per lb) U3O8 near-by-futures from Bloomberg.
Molybdenum (US$ per lb) since March 1992, MW dealer oxide.
Cobalt (US$ per lb) MW dealer price.
FOREST PRODUCTS
Lumber & Wood Products, Western Spruce-Pine-Fir 2x4 No.2 & Btr (US$ per mfbm) FOB mill.
Oriented Strandboard (US$ per thousand sq. ft.), U.S. North Central region, 7/16 inch.
Pulp, Bleached Northern Softwood Kraft (US$ per tonne) Transactions price, delivery USA.
Newsprint (US$ per tonne) Average transactions price, 45 grams, delivery Eastern USA.
Groundwood Specialty Papers (US$ per ton) Supercalendered-A paper, 35 lb., delivery USA.
Linerboard (US$ per ton), delivery Eastern USA with zone discounts.
AGRICULTURE
Wheat & Flour (US$ per tonne), DNS No 1 14% protein Duluth, Minn; prior to April 2011 No.1 CWRS, 13.5% protein at St. Lawrence.
Barley (US$ per tonne), Manitoba Agriculture and Food No. 1 Canadian western barley aggregate spot price; historical data No. 1 at Lethbridge, Alberta.
Canola & Oilseeds (US$ per tonne) No.1 Canada, in store Vancouver.
Cattle & Beef (US$ per cwt) Steers over 1,051 pounds at Toronto; from Jan 1993, Ontario average.
Hogs & Pork (US$ per cwt) 100 Index Hogs at Toronto; from Jan 1993, Ontario average.
Fish & Seafood (US$ per lb) West Coast silver coho salmon; Atlantic lobster prices; prior to 1986 cod fillets & blocks.
DISCLAIMER
This report has been prepared by Scotiabank Economics as a resource for the clients of Scotiabank. Opinions, estimates and projections contained herein are our own as of the date hereof and are subject to change without notice. The information and opinions contained herein have been compiled or arrived at from sources believed reliable but no representation or warranty, express or implied, is made as to their accuracy or completeness. Neither Scotiabank nor any of its officers, directors, partners, employees or affiliates accepts any liability whatsoever for any direct or consequential loss arising from any use of this report or its contents.
These reports are provided to you for informational purposes only. This report is not, and is not constructed as, an offer to sell or solicitation of any offer to buy any financial instrument, nor shall this report be construed as an opinion as to whether you should enter into any swap or trading strategy involving a swap or any other transaction. The information contained in this report is not intended to be, and does not constitute, a recommendation of a swap or trading strategy involving a swap within the meaning of U.S. Commodity Futures Trading Commission Regulation 23.434 and Appendix A thereto. This material is not intended to be individually tailored to your needs or characteristics and should not be viewed as a “call to action” or suggestion that you enter into a swap or trading strategy involving a swap or any other transaction. Scotiabank may engage in transactions in a manner inconsistent with the views discussed this report and may have positions, or be in the process of acquiring or disposing of positions, referred to in this report.
Scotiabank, its affiliates and any of their respective officers, directors and employees may from time to time take positions in currencies, act as managers, co-managers or underwriters of a public offering or act as principals or agents, deal in, own or act as market makers or advisors, brokers or commercial and/or investment bankers in relation to securities or related derivatives. As a result of these actions, Scotiabank may receive remuneration. All Scotiabank products and services are subject to the terms of applicable agreements and local regulations. Officers, directors and employees of Scotiabank and its affiliates may serve as directors of corporations.
Any securities discussed in this report may not be suitable for all investors. Scotiabank recommends that investors independently evaluate any issuer and security discussed in this report, and consult with any advisors they deem necessary prior to making any investment.
This report and all information, opinions and conclusions contained in it are protected by copyright. This information may not be reproduced without the prior express written consent of Scotiabank.
™ Trademark of The Bank of Nova Scotia. Used under license, where applicable.
Scotiabank, together with “Global Banking and Markets”, is a marketing name for the global corporate and investment banking and capital markets businesses of The Bank of Nova Scotia and certain of its affiliates in the countries where they operate, including; Scotiabank Europe plc; Scotiabank (Ireland) Designated Activity Company; Scotiabank Inverlat S.A., Institución de Banca Múltiple, Grupo Financiero Scotiabank Inverlat, Scotia Inverlat Casa de Bolsa, S.A. de C.V., Grupo Financiero Scotiabank Inverlat, Scotia Inverlat Derivados S.A. de C.V. – all members of the Scotiabank group and authorized users of the Scotiabank mark. The Bank of Nova Scotia is incorporated in Canada with limited liability and is authorised and regulated by the Office of the Superintendent of Financial Institutions Canada. The Bank of Nova Scotia is authorized by the UK Prudential Regulation Authority and is subject to regulation by the UK Financial Conduct Authority and limited regulation by the UK Prudential Regulation Authority. Details about the extent of The Bank of Nova Scotia's regulation by the UK Prudential Regulation Authority are available from us on request. Scotiabank Europe plc is authorized by the UK Prudential Regulation Authority and regulated by the UK Financial Conduct Authority and the UK Prudential Regulation Authority.
Scotiabank Inverlat, S.A., Scotia Inverlat Casa de Bolsa, S.A. de C.V, Grupo Financiero Scotiabank Inverlat, and Scotia Inverlat Derivados, S.A. de C.V., are each authorized and regulated by the Mexican financial authorities.
Not all products and services are offered in all jurisdictions. Services described are available in jurisdictions where permitted by law.