SUMMARY
- We remain optimistic about economic growth this year and next as economies continue to reopen, but Delta-variant-related downside appears more likely and has impacted commodity market sentiment.
- Global crude benchmarks were casualties of risk-off sentiment, but were supported by Gulf Coast production shut-ins via Hurricane Ida.
- Copper and iron ore prices dropped but then regained some ground following labour unrest in Chile and local economic signals in China.
- Gold continued to track US monetary policy developments, creeping incrementally higher following Chairman Powell’s incrementally more dovish-than-anticipated announcement at Jackson Hole.
SIGNS OF SLOWING GROWTH
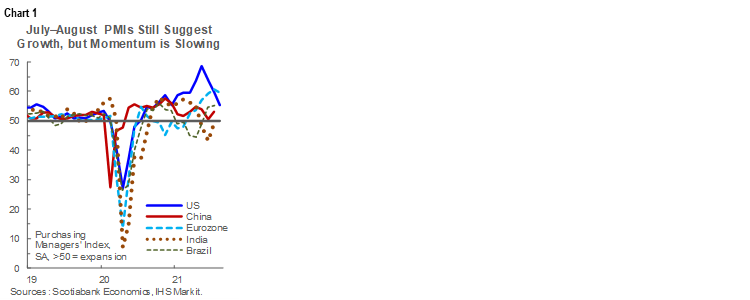
Although data still broadly point to a strong expansion in Q3-2021 across much of the world, August was a month of mixed global growth signals. Labour markets continue to recover and the latest PMI releases—most of which date from July—continue to point to expectations of solid expansion in H2-2021, though momentum has slowed in several countries (chart 1). However, the Delta variant of COVID-19 continues to spread rapidly across many countries, and the notion of slowing global growth was reinforced by signs of cooling industrial activity in China and signals that the Fed will wind down bond buying activity. Negative news culminated in an unexpected GDP decline in Canada in Q2-2021, which provides a soft handoff for the remainder of the year.
Markets clearly responded to negative data points and developments in August, and that dragged down commodity prices writ large. We still expect a very strong global expansion this year and our forecasts already include a negative Q3-2021 Delta variant impact, but further spread and negative market reaction may yield downward revisions.
OIL HIT BY SLOW GROWTH NARRATIVE, BUOYED BY HURRICANE
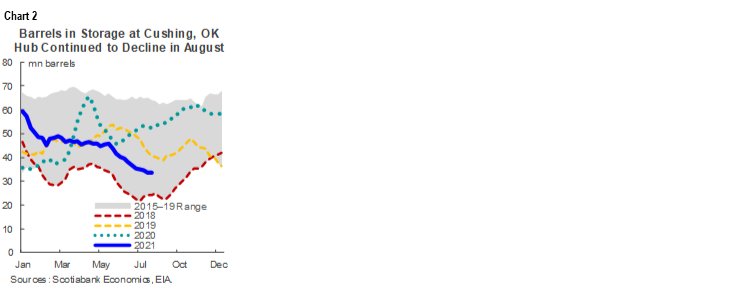
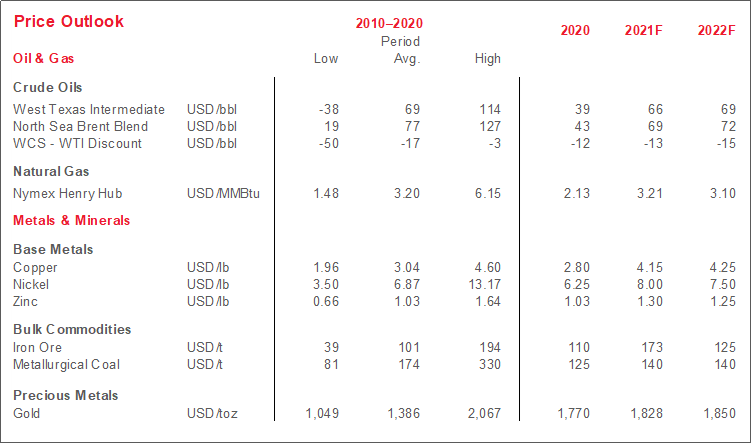
Oil prices were casualties of the broad dip in sentiment. At writing time, both Brent and WTI had averaged 4–5 USD/bbl lower than their July means in August—the steepest monthly dollar decline since April 2020—as investors shifted away from commodities to the safety of US bonds and the greenback. Fundamental data are more constructive—US fuel consumption is still up on a y/y basis and barrels in storage at the important Cushing, OK hub are at their lowest levels since October 2018 (chart 2, p.2). Still, amid expectations of softer near-term demand, news broke that OPEC+ may opt at its next meeting to hold back on the planned output increases announced last month.
However, crude values jumped higher late last week as Hurricane Ida hurtled towards the Gulf of Mexico. Significant shut-ins have already been announced in the US and Mexico; we may see more upward price pressures in the coming weeks if operations remain shuttered.
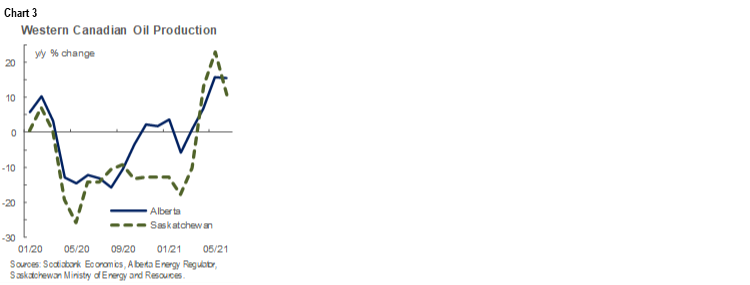
Like Brent and WTI, WCS averaged about 4 USD/bbl lower in August than in July, and experienced modest improvements towards the end of the month. Other Western Canadian oil sector developments were more auspicious. Alberta production was up 16% y/y for the second consecutive month and in line with pre-pandemic levels. Saskatchewan’s output rose versus year-earlier levels for the third consecutive month, having lagged early this year (chart 3). Perhaps even more positively, the Line 3 pipeline—needed for long-run US market access—cleared a critical legal hurdle in Minnesota and is on pace to begin operation in Q4 of this year.
COPPER, IRON ORE DROP, REGAIN SOME GROUND BY MONTH-END
Copper prices did fall for the third consecutive month, but were fairly flat relative to other key commodities with industrial applications. Values of the red metal—seen as a bellwether of global economic activity given its wide application in the construction and manufacturing sectors—continue to be weighed down by fears of a more moderate expansion. Signs of slowing investment (chart 4) and import activity in China—by far the world’s largest copper consumer—certainly contributed to that trend early in the month. Yet fears of supply constraints remain given ongoing labour unrest in the mining sector in Chile—the world’s largest producer. In the next five years, we expect tight demand-supply conditions to dominate the market with few major projects in the pipeline and as green energy-based consumption ramps up.

Supply disruptions also look to have lifted nickel prices. A number of major nickel producers reported lower-than-anticipated output in the second quarter of this year; amid those developments, the metal hovered near 9 USD/t for much of August. However, production is expected to be made up later this year and a strike was recently resolved at a major mine in Sudbury, ON; accordingly, yields should normalize as the year progresses. Over the medium-term, we expect surging nickel pig iron production out of Indonesia and Chinese advances with respect to nickel matte output to keep the market well-supplied. That should ultimately offset strong demand via electric vehicle manufacturing, and result in easing prices.
Alongside the general view that global growth may have peaked, iron ore prices have been particularly impacted by Chinese steel output guidance. In August, the 62% variety of the key ingredient in steel production fell towards 140 USD/t—an eight-month low and a far cry from the near-record heights north of 220 USD/t hit just last month. Given elevated output levels that began this year, meeting the levels targeted to improve air quality in Beijing before next year’s winter Olympics will require hefty production cuts in H2-2021. Iron ore regained some ground later in August amid a surge in local bond issuance—interpreted by some investors as a sign of stronger capital spending intentions—and good results with respect to COVID-19 containment. We expect the metal’s price to stabilize near 150 USD/t by year-end.
GOLD RANGEBOUND
Gold, as usual, tracked monetary policy developments. The yellow metal hovered in the 1,740–1,780 USD/oz range in the middle of August when market participants anticipated some withdrawal of monetary stimulus from the Fed. It then inched closer to the 1,800 USD/oz mark when Chairman Powell’s remarks at Jackson Hole proved incrementally more dovish than expected. With rates likely to hold until 2023, bullion should remain well-supported this year and next.
TECHNICAL NOTE
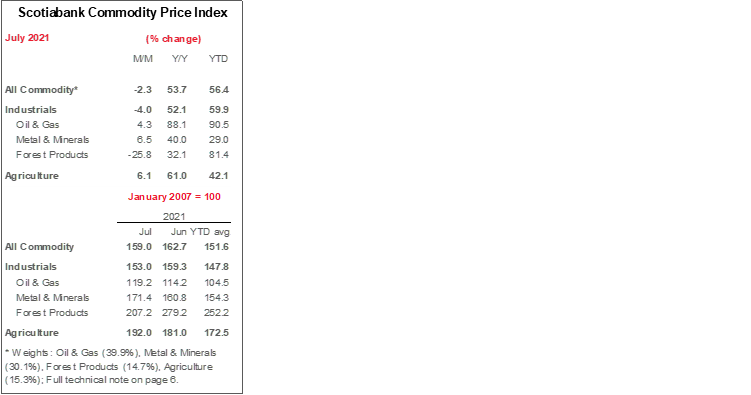
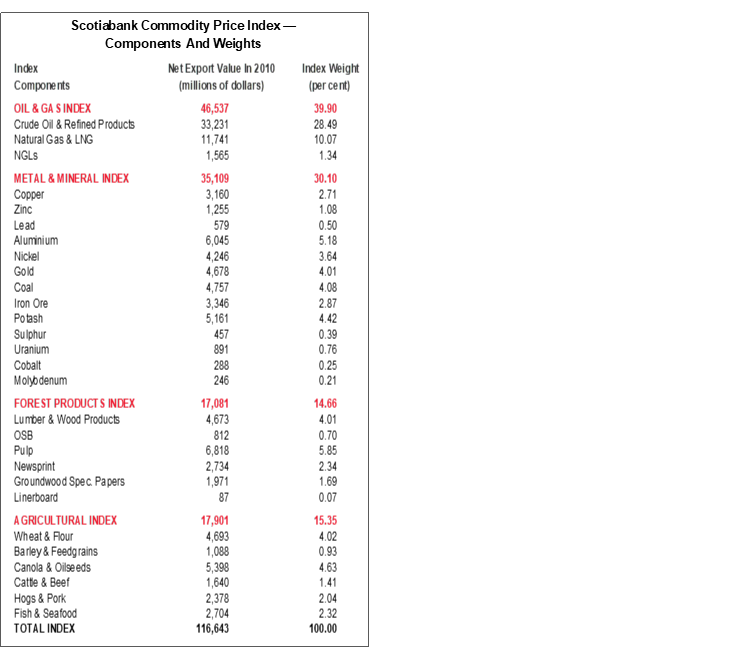
Scotiabank Commodity Price Index — Principal Canadian Exports
January 2007 = 100
This Index has been designed to track the spot or transactions prices paid in U.S. dollars for key Canadian commodities and resource-based manufactured goods in export markets. The weight of each component is based upon its net export value in 2010. Prior to January 2007, the weight of each component was based on its export value in 1995-97, except for crude oil & refined petroleum products, uncoated freesheet paper and linerboard, where net exports were used. Canada imports a significant quantity of these products, and use of their export value alone would have overstated the importance in Canada’s trade performance.
The following prices are included:
OIL & GAS
Crude Oil & Refined Petroleum Products (US$ per bbl) MSW light sweet crude oil at Edmonton (previously Edmonton Par crude) and Western Canadian Select heavy oil at Hardisty, Alberta; price differentials off WTI near-by futures from Bloomberg.
Natural Gas (US$ per mcf) Average export price quoted by the National Energy Board.
Natural Gas Liquids (NGLs – Propane, Butane, Ethane & Pentanes-Plus) (US$ per bbl), Propane at Edmonton & Sarnia.
METALS & MINERALS
Copper & Products (US$ per lb) LME official cash settlement price for grade A copper.
Zinc (US$ per lb) LME SHG cash settlement: prior to Sept 1990, U.S. producers’ price for high-grade zinc delivered.
Lead (US$ per lb) LME official cash settlement price; prior to Jan. 1991, U.S. producers’ price for common grade delivered.
Aluminium & Products (US$ per lb) since 1979, LME official cash settlement price.
Nickel (US$ per lb) since 1980, LME official cash settlement price.
Gold (US$ per oz) ‘LBMA Gold Price PM’ as of March 20, 2015.
Potash (US$ per tonne) Standard potassium chloride, spot price, FOB Vancouver.
Sulphur (US$ per tonne) Solid, spot price, FOB Vancouver.
Metallurgical Coal (US$ per tonne) Contract price for premium-grade hard coking coal, FOB Vancouver.
Iron Ore (US cents per dmtu) Spot price fines 62% Fe, CFR Qingdao, China; prior to Jan 2011, term-contract price for concentrates 66% Fe from Labrador/Quebec to Northern Europe (FOB Sept-Iles).
Uranium (US$ per lb) U3O8 near-by-futures from Bloomberg.
Molybdenum (US$ per lb) since March 1992, MW dealer oxide.
Cobalt (US$ per lb) MW dealer price.
FOREST PRODUCTS
Lumber & Wood Products, Western Spruce-Pine-Fir 2x4 No.2 & Btr (US$ per mfbm) FOB mill.
Oriented Strandboard (US$ per thousand sq. ft.), U.S. North Central region, 7/16 inch.
Pulp, Bleached Northern Softwood Kraft (US$ per tonne) Transactions price, delivery USA.
Newsprint (US$ per tonne) Average transactions price, 45 grams, delivery Eastern USA.
Groundwood Specialty Papers (US$ per ton) Supercalendered-A paper, 35 lb., delivery USA.
Linerboard (US$ per ton), delivery Eastern USA with zone discounts.
AGRICULTURE
Wheat & Flour (US$ per tonne), DNS No 1 14% protein Duluth, Minn; prior to April 2011 No.1 CWRS, 13.5% protein at St. Lawrence.
Barley (US$ per tonne), Manitoba Agriculture and Food No. 1 Canadian western barley aggregate spot price; historical data No. 1 at Lethbridge, Alberta.
Canola & Oilseeds (US$ per tonne) No.1 Canada, in store Vancouver.
Cattle & Beef (US$ per cwt) Steers over 1,051 pounds at Toronto; from Jan 1993, Ontario average.
Hogs & Pork (US$ per cwt) 100 Index Hogs at Toronto; from Jan 1993, Ontario average.
Fish & Seafood (US$ per lb) West Coast silver coho salmon; Atlantic lobster prices; prior to 1986 cod fillets & blocks.
DISCLAIMER
This report has been prepared by Scotiabank Economics as a resource for the clients of Scotiabank. Opinions, estimates and projections contained herein are our own as of the date hereof and are subject to change without notice. The information and opinions contained herein have been compiled or arrived at from sources believed reliable but no representation or warranty, express or implied, is made as to their accuracy or completeness. Neither Scotiabank nor any of its officers, directors, partners, employees or affiliates accepts any liability whatsoever for any direct or consequential loss arising from any use of this report or its contents.
These reports are provided to you for informational purposes only. This report is not, and is not constructed as, an offer to sell or solicitation of any offer to buy any financial instrument, nor shall this report be construed as an opinion as to whether you should enter into any swap or trading strategy involving a swap or any other transaction. The information contained in this report is not intended to be, and does not constitute, a recommendation of a swap or trading strategy involving a swap within the meaning of U.S. Commodity Futures Trading Commission Regulation 23.434 and Appendix A thereto. This material is not intended to be individually tailored to your needs or characteristics and should not be viewed as a “call to action” or suggestion that you enter into a swap or trading strategy involving a swap or any other transaction. Scotiabank may engage in transactions in a manner inconsistent with the views discussed this report and may have positions, or be in the process of acquiring or disposing of positions, referred to in this report.
Scotiabank, its affiliates and any of their respective officers, directors and employees may from time to time take positions in currencies, act as managers, co-managers or underwriters of a public offering or act as principals or agents, deal in, own or act as market makers or advisors, brokers or commercial and/or investment bankers in relation to securities or related derivatives. As a result of these actions, Scotiabank may receive remuneration. All Scotiabank products and services are subject to the terms of applicable agreements and local regulations. Officers, directors and employees of Scotiabank and its affiliates may serve as directors of corporations.
Any securities discussed in this report may not be suitable for all investors. Scotiabank recommends that investors independently evaluate any issuer and security discussed in this report, and consult with any advisors they deem necessary prior to making any investment.
This report and all information, opinions and conclusions contained in it are protected by copyright. This information may not be reproduced without the prior express written consent of Scotiabank.
™ Trademark of The Bank of Nova Scotia. Used under license, where applicable.
Scotiabank, together with “Global Banking and Markets”, is a marketing name for the global corporate and investment banking and capital markets businesses of The Bank of Nova Scotia and certain of its affiliates in the countries where they operate, including; Scotiabank Europe plc; Scotiabank (Ireland) Designated Activity Company; Scotiabank Inverlat S.A., Institución de Banca Múltiple, Grupo Financiero Scotiabank Inverlat, Scotia Inverlat Casa de Bolsa, S.A. de C.V., Grupo Financiero Scotiabank Inverlat, Scotia Inverlat Derivados S.A. de C.V. – all members of the Scotiabank group and authorized users of the Scotiabank mark. The Bank of Nova Scotia is incorporated in Canada with limited liability and is authorised and regulated by the Office of the Superintendent of Financial Institutions Canada. The Bank of Nova Scotia is authorized by the UK Prudential Regulation Authority and is subject to regulation by the UK Financial Conduct Authority and limited regulation by the UK Prudential Regulation Authority. Details about the extent of The Bank of Nova Scotia's regulation by the UK Prudential Regulation Authority are available from us on request. Scotiabank Europe plc is authorized by the UK Prudential Regulation Authority and regulated by the UK Financial Conduct Authority and the UK Prudential Regulation Authority.
Scotiabank Inverlat, S.A., Scotia Inverlat Casa de Bolsa, S.A. de C.V, Grupo Financiero Scotiabank Inverlat, and Scotia Inverlat Derivados, S.A. de C.V., are each authorized and regulated by the Mexican financial authorities.
Not all products and services are offered in all jurisdictions. Services described are available in jurisdictions where permitted by law.