SUMMARY
We again revised higher our global economic outlook in respect of additional US fiscal stimulus measures, rising COVID-19 vaccination rates, and signs that the worst of the second wave may be behind us.
Exit from emergency economic conditions and the prospect of a stimulus-led global recovery are feeding inflation expectations and devaluing the USD, supporting precious metals—especially silver.
Key industrial metals continue to reach new heights.
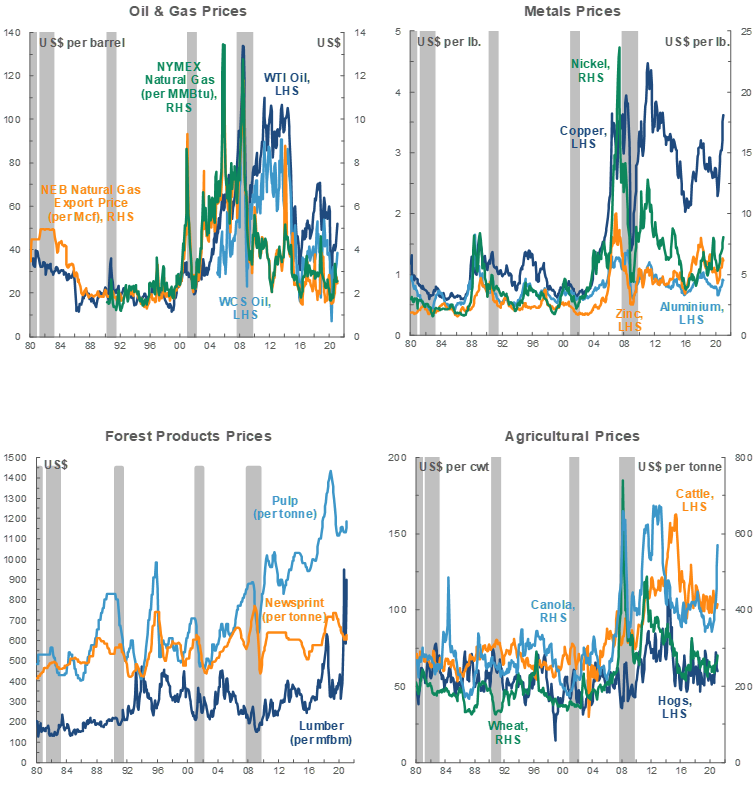
The recovery narrative, OPEC+ policy, and the effects of the winter storm in the US have juiced Brent and WTI; despite fundamental support, we expect some volatility going forward.
WCS prices are well-supported; the resulting jump in Western Canadian production has prompted a rise in crude-by-rail shipments.
Tight demand-supply conditions drove North American lumber prices to new record highs.
GLOBAL ECONOMY AND COMMODITY PRICING BACKDROP IMPROVE
In large part due to expectations of a considerably stronger US expansion, we once again raised our projections for 2021–22 global growth in our February Forecast Tables. The 5.8% surge now anticipated for the American economy in 2021 assumes USD 1.4 tn in fiscal stimulus, stronger-than-expected Q4-2020 growth, and future release of pent-up demand. China’s robust industrial-sector-led expansion likely paused this month—typical during observance of the February lunar holiday—but remains on solid footing.
The fact that COVID-19 infections are trending in the right direction (chart 1) in several major economies is reinforcing the quicker-than-anticipated rebound narrative alongside rising vaccination rates. We certainly are not out of the woods yet, and caseloads continue to vary by country, but second wave lockdown measures appear to be having their desired effect. This also augurs well for commodity demand and pricing writ large.

The US dollar index looks to have resumed its downward trend after briefly strengthening somewhat in response to disappointing labour market data. We expect the greenback to continue to depreciate as global economic conditions and risk sentiment improve, which should support the values of commodities priced in the world’s reserve currency.
SILVER OUTPACING GOLD
Inflation expectations—reflecting better economic conditions, global stimulus to bolster the recovery, and the prospect of slow potential growth amid reopening—continue to support precious metals prices. Read Derek Holt’s views on the prospects for price appreciation in Canada and the US here.
Rock-bottom interest rates and the Federal Reserve’s stated tolerance for above-target inflation continue to underpin prices for classic inflation hedge gold. Though the yellow metal is thus far down incrementally versus January, it remains at historically elevated levels; its mean near 1,850 USD/oz. so far this year—if maintained—would represent the highest-ever recorded annual average.
Bullion’s recent trajectory has been softer than it might otherwise have been in part because of the relative attractiveness of silver. Subject to the same inflation hedge drivers as gold, the white precious metal also has many industrial applications—ranging from metal bonding to electricity distribution—making it a hot commodity as stimulus ramps up. Its price hovered near eight-year highs for much of February. Silver’s use in solar panels and batteries may mean longer-run benefits from the decarbonization shift; in fact, we raised outer-year industrial metals price projections for most industrial metals as of our last forecast update. This month, the gold-silver price ratio fell below 64—its lowest level in almost seven years (chart 2).

ANOTHER MONTH, ANOTHER MULTI-YEAR HIGH FOR COPPER, IRON ORE
Optimism about the global economic recovery and the development of green technology continues to propel copper to new heights. This month, the bellwether red metal climbed north of 4 USD/lb. for the first time since 2011. Weaker-than-anticipated 2020 production estimates released by the US Geological Survey also contributed to price gains this month. We indicated as of our last update that we expect copper to remain well-supported throughout our forecast horizon.
Iron ore prices fell back this month, in part because consumption among steel end-users slowed during the mid-February Chinese Lunar New Year holiday, but have since climbed back above 170 USD/t. We continue to anticipate that market tightness—anchored by Chinese steel production, reinforced by only gradual South American output increases, and bolstered by the broader stimulus-led global recovery—will keep prices high this year.
OIL AND GAS: VOLATILITY LIKELY AHEAD
Three key factors underlie crude oil’s recent spike, and all three have the potential to either unwind in the coming months or fluctuate in response to short-run market movements. The first factor is the path of the global economic recovery, which is clearly improving but depends on continued success with respect to virus containment and stimulus rollout. The second is OPEC+ policy; elevated output quota compliance has supported crude values but Saudi Arabia’s plan to end its voluntary 1 mn bpd production cuts in April would bring more barrels online. Finally, the winter storm laying siege to the southern US has made fuel scarcer and shut production in, but those effects will eventually be unwound.
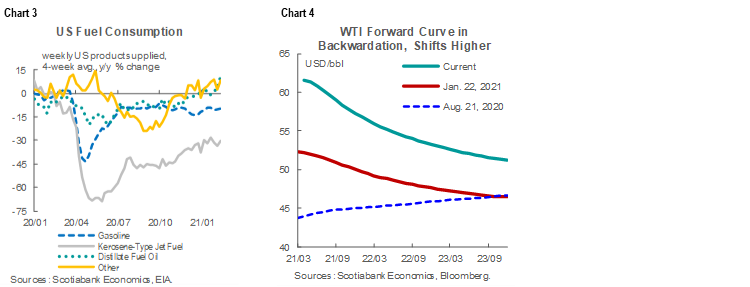
Still, the stronger-than-anticipated gains to date in the WTI and Brent benchmarks have support from fundamentals. US crude oil stocks have declined in 10 consecutive weeks, and reached their lowest level since March 2020 in the seven days to February 12, 2021. By the same token, barrels in storage at the key Cushing, OK hub have plunged by nearly one-quarter since the beginning of the year, and sit at their lowest levels since the end of last March. US fuel consumption—including that of beleaguered jet fuel—is improving (chart 3, p.2). Forward curves for both Brent and WTI are now firmly backwardated—in stark contrast to the contango witnessed last summer (chart 4, p.2)—which signifies market expectations of more tightness going forward.
US natural gas prices have seen particularly steep increases amid the increased heating demand and range of transportation issues brought about by the US storm. The key Henry Hub benchmark closed above 15 USD/Mmbtu last week as temperatures plunged and reports of frozen pipelines were received. In the seven days to February 12, natural gas inventories shrank by 237 bn cubic feet, with declines broad-based. That one-week drawdown was the largest since early 2018, but not one that left storage levels lower than recent seasonal norms (chart 5). In all likelihood, the storm’s effects will prove transitory, but should cold weather or infrastructure challenges persist, we could see more inventory drainage and price pressure.

For AECO prices, the month’s most significant development may have been the Canada Energy Regulator’s rejection of calls to extend the Temporary Service Protocol (TSP). The policy would have allowed continued priority access to natural gas storage during maintenance season; our January 2021 forecast assumed that it would be extended. Reasons guiding the decision are forthcoming; we expect a modest negative pricing impact. Other, more auspicious factors dominate the commodity’s medium-term outlook. These include: expansions of the NGTL pipeline system that are expected to help ease bottlenecks, planned retirement of Alberta coal plants, and—eventually—access to the Asian market via the LNG Canada export terminal.
News this month of a pickup in crude-by-rail shipments underscores what has been a volatile year for Western Canadian oil producers. WCS traded as low as 3 USD/bbl early last year; this week, it hit the 50 USD/bbl mark—the highest level since early 2019. The current discount to WTI near 11 USD/bbl—tighter than that consistent with quality and transportation costs—reflects limited heavy oil availability in the US Gulf Coast and spare egress capacity that developed when output was cut last year. Encouraged by price gains, Alberta crude output had risen on a y/y basis in two straight months as of December, apparently shrinking available pipeline space and prompting an increase in transportation by rail. Near-term, US storm-led weakness in refinery activity could hamper further gains. In Q4, the Line 3 conduit should add needed egress capacity.
STILL-TIGHT LUMBER MARKET DRIVES RECORD PRICES
Lumber prices continued to climb in February despite the cold weather witnessed across North America. Normally, such conditions could be expected to diminish housing market activity and demand for the commodity, but in the week to February 12, the North American composite lumber price rose about 3% to reach an all-time high of 966 USD/Mfbm. The Western and Eastern spruce-pine-fir indices hit 992 and 1,320 USD/Mfbm, respectively—also record highs. Reports of trim inventories continue to come in; peak homebuilding activity tends to occur in the spring, so lumber consumption and pricing may well see further gains in the coming months. Lagged Canadian production data available to November 2020 showed that lumber output continued to rise significantly from early-2020 troughs (chart 6).

TECHNICAL NOTE
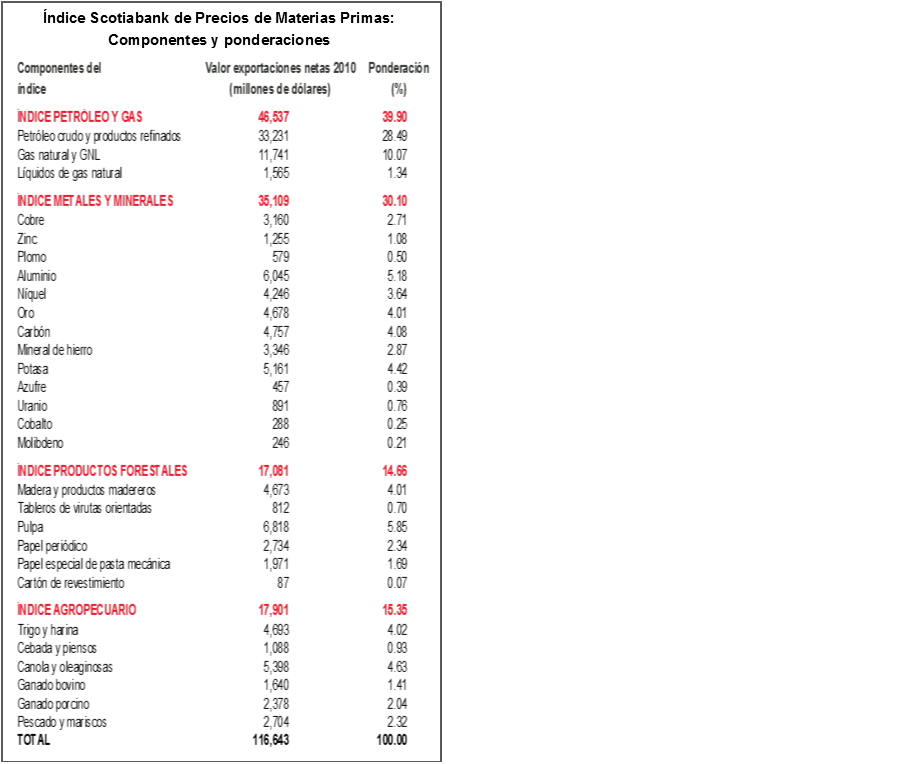
Scotiabank Commodity Price Index — Principal Canadian Exports
January 2007 = 100
This Index has been designed to track the spot or transactions prices paid in U.S. dollars for key Canadian commodities and resource-based manufactured goods in export markets. The weight of each component is based upon its net export value in 2010. Prior to January 2007, the weight of each component was based on its export value in 1995-97, except for crude oil & refined petroleum products, uncoated freesheet paper and linerboard, where net exports were used. Canada imports a significant quantity of these products, and use of their export value alone would have overstated the importance in Canada’s trade performance.
The following prices are included:
OIL & GAS
Crude Oil & Refined Petroleum Products (US$ per bbl) MSW light sweet crude oil at Edmonton (previously Edmonton Par crude) and Western Canadian Select heavy oil at Hardisty, Alberta; price differentials off WTI near-by futures from Bloomberg.
Natural Gas (US$ per mcf) Average export price quoted by the National Energy Board.
Natural Gas Liquids (NGLs – Propane, Butane, Ethane & Pentanes-Plus) (US$ per bbl), Propane at Edmonton & Sarnia.
METALS & MINERALS
Copper & Products (US$ per lb) LME official cash settlement price for grade A copper.
Zinc (US$ per lb) LME SHG cash settlement: prior to Sept 1990, U.S. producers’ price for high-grade zinc delivered.
Lead (US$ per lb) LME official cash settlement price; prior to Jan. 1991, U.S. producers’ price for common grade delivered.
Aluminium & Products (US$ per lb) since 1979, LME official cash settlement price.
Nickel (US$ per lb) since 1980, LME official cash settlement price.
Gold (US$ per oz) ‘LBMA Gold Price PM’ as of March 20, 2015.
Potash (US$ per tonne) Standard potassium chloride, spot price, FOB Vancouver.
Sulphur (US$ per tonne) Solid, spot price, FOB Vancouver.
Metallurgical Coal (US$ per tonne) Contract price for premium-grade hard coking coal, FOB Vancouver.
Iron Ore (US cents per dmtu) Spot price fines 62% Fe, CFR Qingdao, China; prior to Jan 2011, term-contract price for concentrates 66% Fe from Labrador/Quebec to Northern Europe (FOB Sept-Iles).
Uranium (US$ per lb) U3O8 near-by-futures from Bloomberg.
Molybdenum (US$ per lb) since March 1992, MW dealer oxide.
Cobalt (US$ per lb) MW dealer price.
FOREST PRODUCTS
Lumber & Wood Products, Western Spruce-Pine-Fir 2x4 No.2 & Btr (US$ per mfbm) FOB mill.
Oriented Strandboard (US$ per thousand sq. ft.), U.S. North Central region, 7/16 inch.
Pulp, Bleached Northern Softwood Kraft (US$ per tonne) Transactions price, delivery USA.
Newsprint (US$ per tonne) Average transactions price, 45 grams, delivery Eastern USA.
Groundwood Specialty Papers (US$ per ton) Supercalendered-A paper, 35 lb., delivery USA.
Linerboard (US$ per ton), delivery Eastern USA with zone discounts.
AGRICULTURE
Wheat & Flour (US$ per tonne), DNS No 1 14% protein Duluth, Minn; prior to April 2011 No.1 CWRS, 13.5% protein at St. Lawrence.
Barley (US$ per tonne), Manitoba Agriculture and Food No. 1 Canadian western barley aggregate spot price; historical data No. 1 at Lethbridge, Alberta.
Canola & Oilseeds (US$ per tonne) No.1 Canada, in store Vancouver.
Cattle & Beef (US$ per cwt) Steers over 1,051 pounds at Toronto; from Jan 1993, Ontario average.
Hogs & Pork (US$ per cwt) 100 Index Hogs at Toronto; from Jan 1993, Ontario average.
Fish & Seafood (US$ per lb) West Coast silver coho salmon; Atlantic lobster prices; prior to 1986 cod fillets & blocks.
DISCLAIMER
This report has been prepared by Scotiabank Economics as a resource for the clients of Scotiabank. Opinions, estimates and projections contained herein are our own as of the date hereof and are subject to change without notice. The information and opinions contained herein have been compiled or arrived at from sources believed reliable but no representation or warranty, express or implied, is made as to their accuracy or completeness. Neither Scotiabank nor any of its officers, directors, partners, employees or affiliates accepts any liability whatsoever for any direct or consequential loss arising from any use of this report or its contents.
These reports are provided to you for informational purposes only. This report is not, and is not constructed as, an offer to sell or solicitation of any offer to buy any financial instrument, nor shall this report be construed as an opinion as to whether you should enter into any swap or trading strategy involving a swap or any other transaction. The information contained in this report is not intended to be, and does not constitute, a recommendation of a swap or trading strategy involving a swap within the meaning of U.S. Commodity Futures Trading Commission Regulation 23.434 and Appendix A thereto. This material is not intended to be individually tailored to your needs or characteristics and should not be viewed as a “call to action” or suggestion that you enter into a swap or trading strategy involving a swap or any other transaction. Scotiabank may engage in transactions in a manner inconsistent with the views discussed this report and may have positions, or be in the process of acquiring or disposing of positions, referred to in this report.
Scotiabank, its affiliates and any of their respective officers, directors and employees may from time to time take positions in currencies, act as managers, co-managers or underwriters of a public offering or act as principals or agents, deal in, own or act as market makers or advisors, brokers or commercial and/or investment bankers in relation to securities or related derivatives. As a result of these actions, Scotiabank may receive remuneration. All Scotiabank products and services are subject to the terms of applicable agreements and local regulations. Officers, directors and employees of Scotiabank and its affiliates may serve as directors of corporations.
Any securities discussed in this report may not be suitable for all investors. Scotiabank recommends that investors independently evaluate any issuer and security discussed in this report, and consult with any advisors they deem necessary prior to making any investment.
This report and all information, opinions and conclusions contained in it are protected by copyright. This information may not be reproduced without the prior express written consent of Scotiabank.
™ Trademark of The Bank of Nova Scotia. Used under license, where applicable.
Scotiabank, together with “Global Banking and Markets”, is a marketing name for the global corporate and investment banking and capital markets businesses of The Bank of Nova Scotia and certain of its affiliates in the countries where they operate, including; Scotiabank Europe plc; Scotiabank (Ireland) Designated Activity Company; Scotiabank Inverlat S.A., Institución de Banca Múltiple, Grupo Financiero Scotiabank Inverlat, Scotia Inverlat Casa de Bolsa, S.A. de C.V., Grupo Financiero Scotiabank Inverlat, Scotia Inverlat Derivados S.A. de C.V. – all members of the Scotiabank group and authorized users of the Scotiabank mark. The Bank of Nova Scotia is incorporated in Canada with limited liability and is authorised and regulated by the Office of the Superintendent of Financial Institutions Canada. The Bank of Nova Scotia is authorized by the UK Prudential Regulation Authority and is subject to regulation by the UK Financial Conduct Authority and limited regulation by the UK Prudential Regulation Authority. Details about the extent of The Bank of Nova Scotia's regulation by the UK Prudential Regulation Authority are available from us on request. Scotiabank Europe plc is authorized by the UK Prudential Regulation Authority and regulated by the UK Financial Conduct Authority and the UK Prudential Regulation Authority.
Scotiabank Inverlat, S.A., Scotia Inverlat Casa de Bolsa, S.A. de C.V, Grupo Financiero Scotiabank Inverlat, and Scotia Inverlat Derivados, S.A. de C.V., are each authorized and regulated by the Mexican financial authorities.
Not all products and services are offered in all jurisdictions. Services described are available in jurisdictions where permitted by law.