SUMMARY
Additional US fiscal stimulus has led us to revise our economic forecasts higher and adds to a generally supportive pricing backdrop; additional policy support could drive commodity prices even higher.
A third pandemic wave—which has prompted fresh restrictions in some jurisdictions—presents downside risk and has already impacted some commodity prices.
Precious metals continued to ease on the back of broadly improving economic conditions and US dollar appreciation.
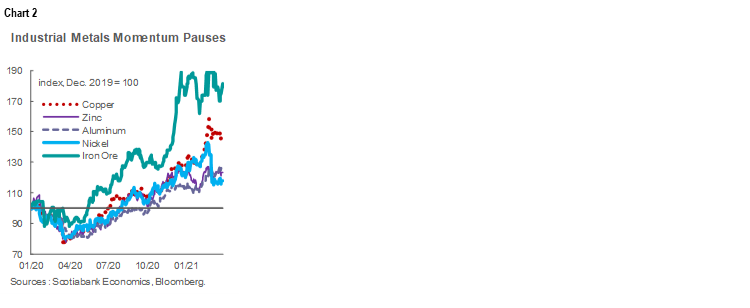
Industrial metals remain very well-supported, but saw momentum stall somewhat this month.
A volatile month for crude included blockage of the Suez Canal and a Supreme Court decision.
RECOVERY’S MOMENTUM CONTINUES
We have once more revised our global economic growth forecasts higher, building on the significant increase outlined last month. That reflects additional fiscal stimulus announced in the US that brings the total included in our projections to 1.9 tn USD. Consequently, our latest forecasts assume that the global economy will witness its fastest pace of expansion in at least 40 years in 2021. Under our base case forecast, the US economy will record its strongest annual advance since 1984 in 2021, and climb beyond the level predicted before COVID-19 by next year. Such a surge would have important growth impacts for many countries, including Canada.
The third pandemic wave—believed to have begun in some countries (chart 1) and having prompted new restrictions in others—remains pertinent, but we believe that the balance of risks is tilted to the upside. Incoming data suggest that economic growth has been fairly resilient to second wave restrictions in a number of jurisdictions. Our projections assume economic multipliers below the historical norm for US stimulus plans, and President Biden intends to announce an ambitious infrastructure plan very shortly. To the extent that our predictions come to fruition, there is potential for accelerating inflationary pressures and earlier-than-indicated withdrawal of global monetary stimulus.

PRECIOUS METALS AGAIN TREND LOWER
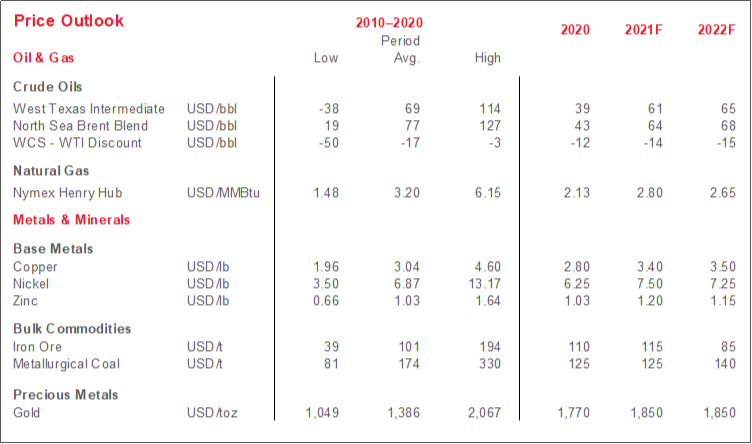
Bullion’s average close in March was just north of 1,720 USD/oz—about 90 USD/oz. lower than in the prior month and tracking the first quarterly decline since 2018. Some of the slide related to appreciation of the US dollar—sought out as a safe haven in response to a spike in US treasury yields. Going forward, inflationary fears related to President Biden’s stimulus package may engender new investor preference for gold as an inflation hedge.
Silver values have also been negatively impacted by a rising greenback and treasury yields. Prices for the metal have traded below 25 USD/oz in several recent sessions after consistently eclipsing the 27 USD/oz mark earlier this year. Unlike gold, however, silver has a wide range of industrial uses and is therefore poised to benefit so long as global construction and manufacturing activity gain as the global economic recovery progresses.
INDUSTRIAL METALS’ CLIMB STALLS
Though copper prices remain very well-supported, closing values of the red metal have fallen back somewhat since climbing north of 4.20 USD/lb in late February and early March. Strength in the US dollar and fears related to a third pandemic wave in Europe drove some of that retreat. Investors are also said to be weighing the possibility of demand-sapping tax hikes in the US, even with that country’s forthcoming infrastructure plan likely to offer a significant economic boost. From a fundamentals perspective, China—responsible for half of global copper consumption—is more important. We expect this week’s Chinese manufacturing PMI to show strong post-Lunar Holiday gains, and that industrial-sector-led growth in the Middle Kingdom to continue to support copper prices this year.
Like copper, iron ore’s price trajectory will depend in large part on the course of Chinese industrial activity, especially as it pertains to steel production. The release of Beijing’s latest Five-Year Plan—which called for reductions in carbon emissions intensity, of which steelmaking is a major source—caused some apprehension about the durability of the recent strength in iron ore values. While adaptation to climate targets will clearly be important for steel producers over the medium-term, we continue to anticipate that China’s stimulus measures will remain supportive of iron ore prices this year alongside reduced Brazilian output.
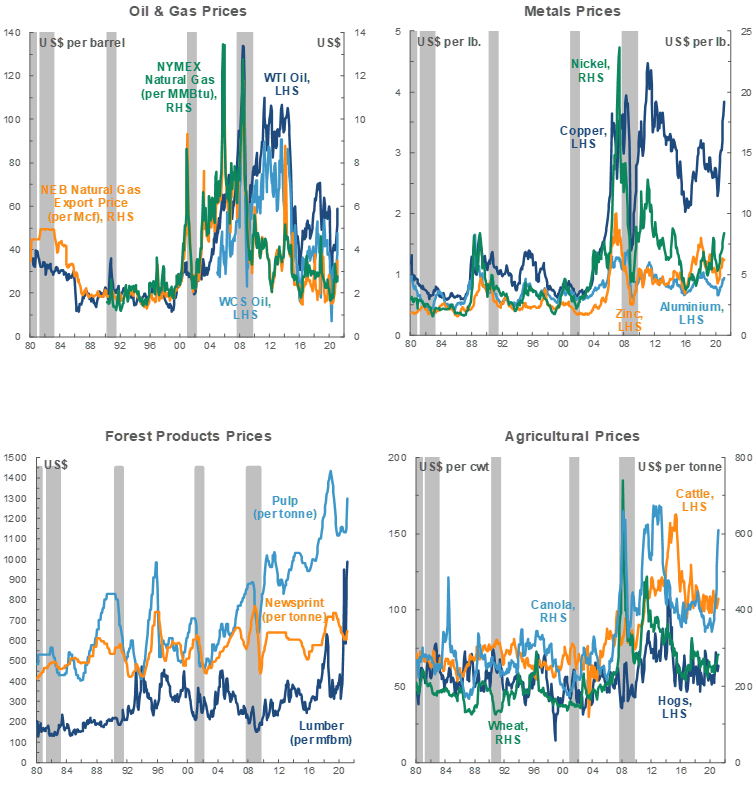
Nickel saw the steepest price contraction of the major industrial metals (chart 2) last month on the back of news that Chinese nickel and steel giant Tsingshan Holding Group would help boost supply of the metal for battery production. Alongside strong industrial sector activity, pricing had benefited from anxiety that output capacity would not be sufficient to meet the demand surge expected to come from widespread adoption of electric vehicles—batteries for which require nickel as a key component.
VOLATILE MONTH FOR CRUDE OIL
While WTI increased on average relative to February, its gains fell off towards the end of the month, and the key North American benchmark closed between 58 and 66 USD/bbl. A good deal of that volatility relates to uncertainty caused by the Ever Given container ship’s six-day blockage of the Suez Canal—through which about 10% of global seaborne crude is estimated to pass. The ship has been freed but backlogs and delivery delays are likely. However, before that incident, global crude values had already been under pressure as lockdowns in Europe to combat the third wave of the pandemic ignited fears of weaker fuel consumption. US oil stocks have also increased in recent weeks, in part due to lingering impacts from the cold spell that hammered Texas in February.
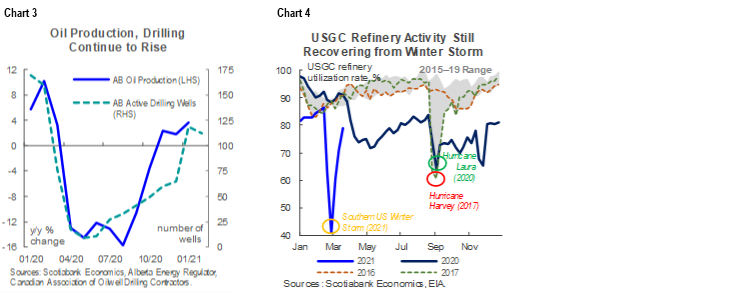
WCS largely followed WTI’s lead this month, but conditions in the Western Canadian oil patch generally continue to improve. Crude production is accelerating, having increased versus year-earlier levels in each of the three months to January 2021 and returned to pre-pandemic levels; wells drilled are also trending generally higher (chart 3, p.2). Though limited pipeline capacity has prompted some shipment by rail, construction of the Line 3 conduit—needed for long-run supply-demand balance and stable WCS pricing—is progressing on schedule and expected to come into service later this year. Activity at USGC refineries—the marginal consumers of Western Canadian crude barrels—is improving but still well below seasonal levels following last month’s Southern US storm (chart 4, p.2).
The Supreme Court of Canada’s affirmation of the constitutionality of the Federal Carbon Tax is less optimistic for Western Canadian producers, though the decision and its effects were likely already expected in the market. The ruling brings to an end a years long legal battle between the Federal Government and some provinces. Broadly, we anticipate that higher carbon taxes will weigh on oil sands and conventional producers’ bottom lines. Markets may see the ruling as supportive of renewables and of low carbon and zero-emission technologies.
TECHNICAL NOTE
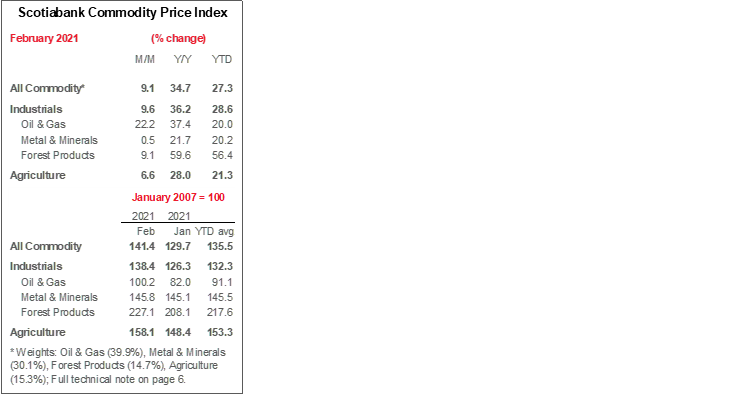
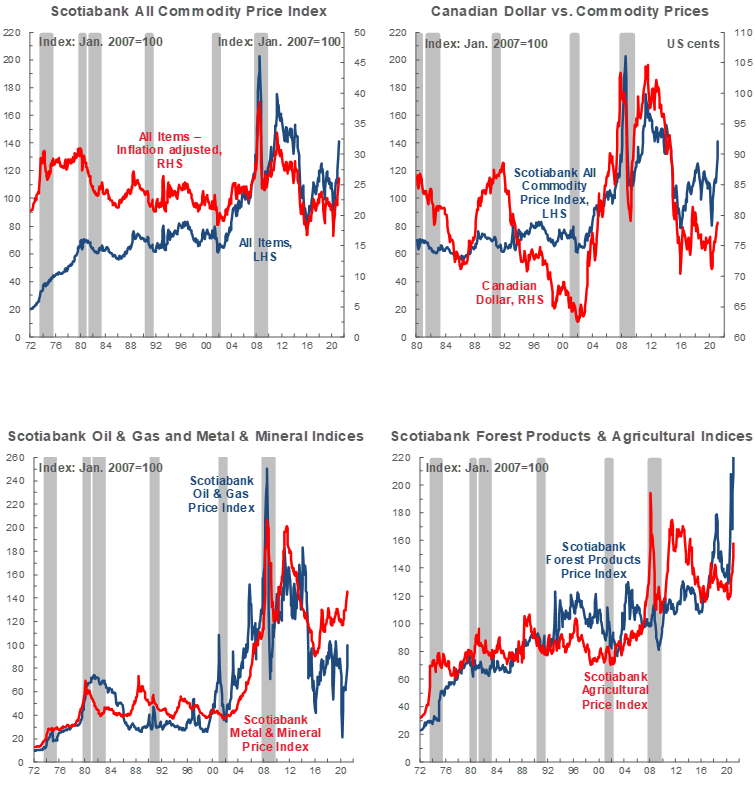
Scotiabank Commodity Price Index — Principal Canadian Exports
January 2007 = 100
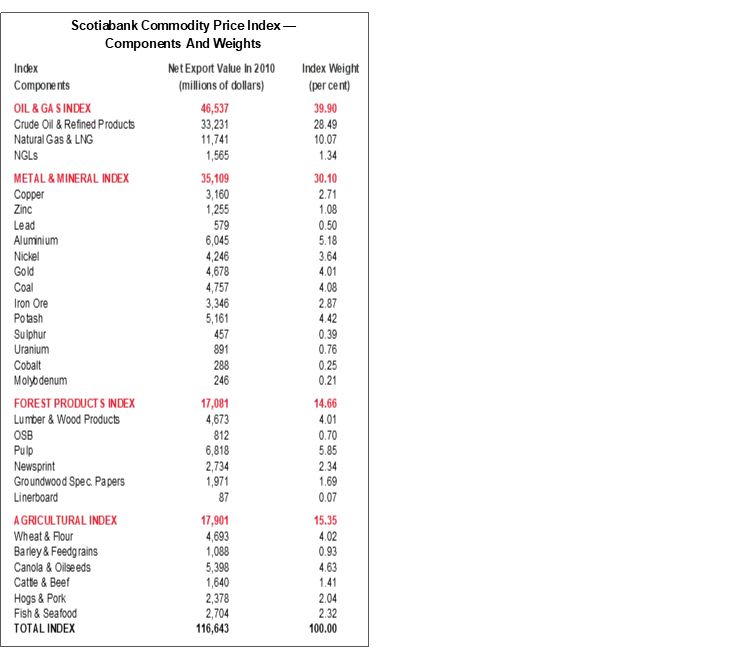
This Index has been designed to track the spot or transactions prices paid in U.S. dollars for key Canadian commodities and resource-based manufactured goods in export markets. The weight of each component is based upon its net export value in 2010. Prior to January 2007, the weight of each component was based on its export value in 1995-97, except for crude oil & refined petroleum products, uncoated freesheet paper and linerboard, where net exports were used. Canada imports a significant quantity of these products, and use of their export value alone would have overstated the importance in Canada’s trade performance.
The following prices are included:
OIL & GAS
Crude Oil & Refined Petroleum Products (US$ per bbl) MSW light sweet crude oil at Edmonton (previously Edmonton Par crude) and Western Canadian Select heavy oil at Hardisty, Alberta; price differentials off WTI near-by futures from Bloomberg.
Natural Gas (US$ per mcf) Average export price quoted by the National Energy Board.
Natural Gas Liquids (NGLs – Propane, Butane, Ethane & Pentanes-Plus) (US$ per bbl), Propane at Edmonton & Sarnia.
METALS & MINERALS
Copper & Products (US$ per lb) LME official cash settlement price for grade A copper.
Zinc (US$ per lb) LME SHG cash settlement: prior to Sept 1990, U.S. producers’ price for high-grade zinc delivered.
Lead (US$ per lb) LME official cash settlement price; prior to Jan. 1991, U.S. producers’ price for common grade delivered.
Aluminium & Products (US$ per lb) since 1979, LME official cash settlement price.
Nickel (US$ per lb) since 1980, LME official cash settlement price.
Gold (US$ per oz) ‘LBMA Gold Price PM’ as of March 20, 2015.
Potash (US$ per tonne) Standard potassium chloride, spot price, FOB Vancouver.
Sulphur (US$ per tonne) Solid, spot price, FOB Vancouver.
Metallurgical Coal (US$ per tonne) Contract price for premium-grade hard coking coal, FOB Vancouver.
Iron Ore (US cents per dmtu) Spot price fines 62% Fe, CFR Qingdao, China; prior to Jan 2011, term-contract price for concentrates 66% Fe from Labrador/Quebec to Northern Europe (FOB Sept-Iles).
Uranium (US$ per lb) U3O8 near-by-futures from Bloomberg.
Molybdenum (US$ per lb) since March 1992, MW dealer oxide.
Cobalt (US$ per lb) MW dealer price.
FOREST PRODUCTS
Lumber & Wood Products, Western Spruce-Pine-Fir 2x4 No.2 & Btr (US$ per mfbm) FOB mill.
Oriented Strandboard (US$ per thousand sq. ft.), U.S. North Central region, 7/16 inch.
Pulp, Bleached Northern Softwood Kraft (US$ per tonne) Transactions price, delivery USA.
Newsprint (US$ per tonne) Average transactions price, 45 grams, delivery Eastern USA.
Groundwood Specialty Papers (US$ per ton) Supercalendered-A paper, 35 lb., delivery USA.
Linerboard (US$ per ton), delivery Eastern USA with zone discounts.
AGRICULTURE
Wheat & Flour (US$ per tonne), DNS No 1 14% protein Duluth, Minn; prior to April 2011 No.1 CWRS, 13.5% protein at St. Lawrence.
Barley (US$ per tonne), Manitoba Agriculture and Food No. 1 Canadian western barley aggregate spot price; historical data No. 1 at Lethbridge, Alberta.
Canola & Oilseeds (US$ per tonne) No.1 Canada, in store Vancouver.
Cattle & Beef (US$ per cwt) Steers over 1,051 pounds at Toronto; from Jan 1993, Ontario average.
Hogs & Pork (US$ per cwt) 100 Index Hogs at Toronto; from Jan 1993, Ontario average.
Fish & Seafood (US$ per lb) West Coast silver coho salmon; Atlantic lobster prices; prior to 1986 cod fillets & blocks.
DISCLAIMER
This report has been prepared by Scotiabank Economics as a resource for the clients of Scotiabank. Opinions, estimates and projections contained herein are our own as of the date hereof and are subject to change without notice. The information and opinions contained herein have been compiled or arrived at from sources believed reliable but no representation or warranty, express or implied, is made as to their accuracy or completeness. Neither Scotiabank nor any of its officers, directors, partners, employees or affiliates accepts any liability whatsoever for any direct or consequential loss arising from any use of this report or its contents.
These reports are provided to you for informational purposes only. This report is not, and is not constructed as, an offer to sell or solicitation of any offer to buy any financial instrument, nor shall this report be construed as an opinion as to whether you should enter into any swap or trading strategy involving a swap or any other transaction. The information contained in this report is not intended to be, and does not constitute, a recommendation of a swap or trading strategy involving a swap within the meaning of U.S. Commodity Futures Trading Commission Regulation 23.434 and Appendix A thereto. This material is not intended to be individually tailored to your needs or characteristics and should not be viewed as a “call to action” or suggestion that you enter into a swap or trading strategy involving a swap or any other transaction. Scotiabank may engage in transactions in a manner inconsistent with the views discussed this report and may have positions, or be in the process of acquiring or disposing of positions, referred to in this report.
Scotiabank, its affiliates and any of their respective officers, directors and employees may from time to time take positions in currencies, act as managers, co-managers or underwriters of a public offering or act as principals or agents, deal in, own or act as market makers or advisors, brokers or commercial and/or investment bankers in relation to securities or related derivatives. As a result of these actions, Scotiabank may receive remuneration. All Scotiabank products and services are subject to the terms of applicable agreements and local regulations. Officers, directors and employees of Scotiabank and its affiliates may serve as directors of corporations.
Any securities discussed in this report may not be suitable for all investors. Scotiabank recommends that investors independently evaluate any issuer and security discussed in this report, and consult with any advisors they deem necessary prior to making any investment.
This report and all information, opinions and conclusions contained in it are protected by copyright. This information may not be reproduced without the prior express written consent of Scotiabank.
™ Trademark of The Bank of Nova Scotia. Used under license, where applicable.
Scotiabank, together with “Global Banking and Markets”, is a marketing name for the global corporate and investment banking and capital markets businesses of The Bank of Nova Scotia and certain of its affiliates in the countries where they operate, including; Scotiabank Europe plc; Scotiabank (Ireland) Designated Activity Company; Scotiabank Inverlat S.A., Institución de Banca Múltiple, Grupo Financiero Scotiabank Inverlat, Scotia Inverlat Casa de Bolsa, S.A. de C.V., Grupo Financiero Scotiabank Inverlat, Scotia Inverlat Derivados S.A. de C.V. – all members of the Scotiabank group and authorized users of the Scotiabank mark. The Bank of Nova Scotia is incorporated in Canada with limited liability and is authorised and regulated by the Office of the Superintendent of Financial Institutions Canada. The Bank of Nova Scotia is authorized by the UK Prudential Regulation Authority and is subject to regulation by the UK Financial Conduct Authority and limited regulation by the UK Prudential Regulation Authority. Details about the extent of The Bank of Nova Scotia's regulation by the UK Prudential Regulation Authority are available from us on request. Scotiabank Europe plc is authorized by the UK Prudential Regulation Authority and regulated by the UK Financial Conduct Authority and the UK Prudential Regulation Authority.
Scotiabank Inverlat, S.A., Scotia Inverlat Casa de Bolsa, S.A. de C.V, Grupo Financiero Scotiabank Inverlat, and Scotia Inverlat Derivados, S.A. de C.V., are each authorized and regulated by the Mexican financial authorities.
Not all products and services are offered in all jurisdictions. Services described are available in jurisdictions where permitted by law.