SUMMARY
News of effective COVID-19 vaccines and Joe Biden’s victory in the US presidential election underpinned a risk-on month and are generally positive for commodity pricing, though much remains uncertain.
Stronger appetite for risk weighed down precious metals prices.
Oil values gained momentum towards the end of the month and we remain bullish for next year, but market imbalances remain.
Chinese activity continues to anchor support for industrial metals prices; China’s latest five-year plan and new yuan-denominated copper futures contract have potentially significant long-term consequences.
VACCINE, US ELECTION RESULT BREED OPTIMISM, BUT...
The course of the COVID-19 pandemic and US political factors remain the principal risks to the economic and commodity price outlooks; there were significant developments on both fronts this month.
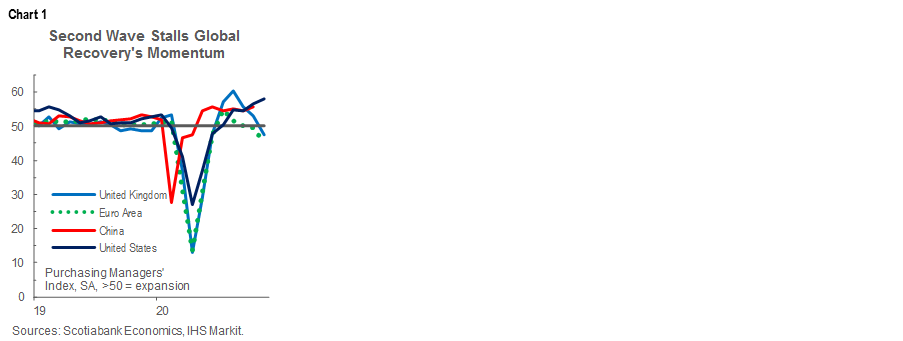
News in November of multiple effective COVID-19 vaccines was unquestionably positive for medium-term economic growth and contributed to improving risk sentiment. The announcement came slightly sooner than we previously anticipated, which augurs well for earlier production, distribution, and widespread inoculation and an eventual return to some form of economic normalcy. Nearer-term prospects are less optimistic because virus infection rates continue to surge dramatically across much of the world. Many nations have put in place stricter lockdown measures, which in some cases have reversed the economic momentum witnessed since reopening from the first wave (chart 1).
Joe Biden’s victory in the US presidential election should eventually result in some easing of the trade-related uncertainty that has plagued the global economy for the last several years, but much is still to be determined. The outcomes of two January 2021 runoff elections in Georgia will clarify the balance of power in the US Senate and determine whether a much-needed fiscal stimulus is passed or impeded by partisan gridlock. With respect to the energy sector, prices and activity will be at the intersection of fiscal policy, Iranian crude production in response to nuclear program negotiations, and efforts on the part of the new US administration to rein in carbon emissions.
GOLD, SILVER PRICES UNDER PRESSURE
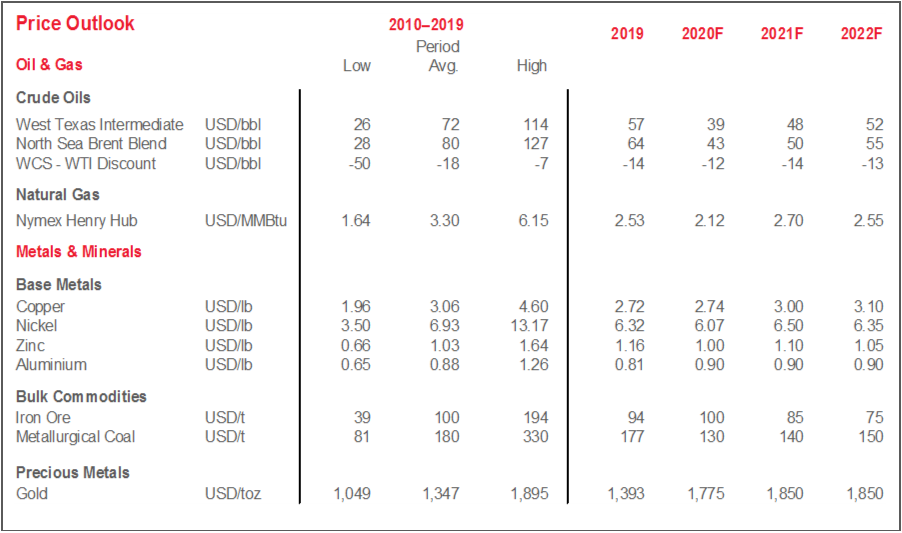
A broad increase in risk-on sentiment has gold prices on track to decline for the third consecutive month. The safe haven metal traded well below 1,900 USD/oz. for much of November—its lowest level since the summer. It appears to be responding to signs of greater political stability following reports that outgoing US president Trump will cooperate with Biden administration officials in the transition of power. Still, bullion remains on pace for a hefty annual price increase in the range of 25%—a rate not seen since the early 2010s—and should remain supported so long as uncertainty reigns. The Federal Reserve’s stated tolerance for inflation beyond the 2% target and US fiscal stimulus—to the extent that it generates price pressures—could also be constructive for the yellow metal.
Silver prices were fairly steady in November. As with gold, they lost momentum following positive vaccine news. Alongside inflation and the path of the US dollar, the shape of the recovery will influence silver prices given the metal’s range of industrial applications.
CRUDE VALUES RISING, BUT MARKET IMBALANCES REMAIN
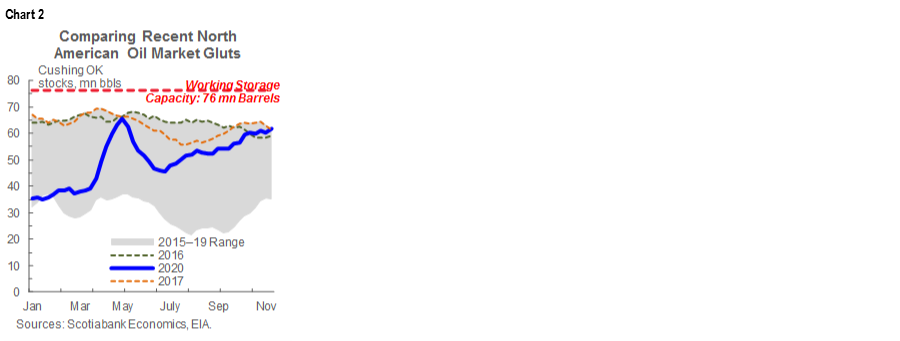
Light oil prices began November trending downward. The rapid spread of COVID-19’s second wave had been underpinning some bearish sentiment, which in turn prompted OPEC to revise downward its projections for global crude consumption. Against that backdrop, North American refineries are in the midst of regular seasonal maintenance, and reports of bloated inventories at the key Cushing, Oklahoma hub have once again surfaced. A severe crude overhang built up very rapidly amid first wave lockdowns and the Saudi-Russian oil price war, fell back significantly as fuel demand recovered post-reopening, and has since begun to accrue again (chart 2).
Since news of multiple effective vaccines broke, however, crude values have risen steadily higher. Anticipation of a broad improvement in demand contributed to the WTI benchmark’s leap to more than 45 USD/bbl from the 37–38 USD/bbl range earlier in the month. Signs of recovering Asian fuel demand—notably in China and India—has further supported upward price pressures, and OPEC+’s recent technical meeting yielded support for a three-month extension of the output cuts set to ease in January. We continue to expect further oil price growth in 2021 as the global recovery progresses and inventories draw down more meaningfully.
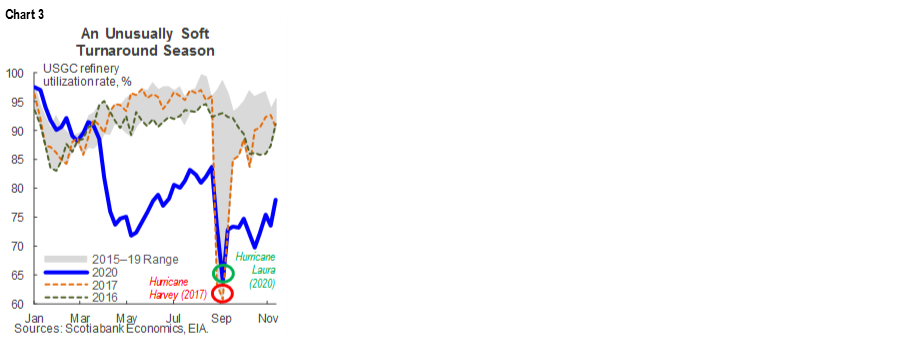
WCS has moved on a generally upward trajectory since the announcement of an effective vaccine mid-month. Late-month gains have not been as large as for WTI, likely influenced by still-unusually soft maintenance season activity at US Gulf Coast (USGC) refineries (chart 3)—the primary marginal consumers of heavy, sour Western Canadian oil. Still, the availability of comparable blends for upgrading remains limited in the USGC due to OPEC+ supply restrictions and Venezuelan sanctions, offering some pricing support for the Canadian benchmark. Moreover, with throttled-back oil sands drilling leaving spare pipeline capacity, and caps under the Alberta government’s curtailment program set to end in December, several major producers have announced plans to ramp output back up in 2021.
On the pipeline front, there was good news and bad news. The Michigan government’s latest attempt to shut down Enbridge’s Line 5 conduit, if successful, could reduce export capacity on the Mainline system. On the other hand, the company’s announcement that it has received all outstanding permits for its Line 3 replacement project should incrementally accelerate construction timelines.
MIDDLE KINGDOM CONTINUES TO LIFT INDUSTRIAL METALS
Copper prices remain well-supported. The bellwether metal’s climb since first wave restrictions began to be lifted has been remarkable. Trading near 2 USD/lb in late March, it has since surged more than 50% following eight consecutive monthly gains and closed near 3.30 USD/lb last week—one of the highest levels since 2014. Vaccine-related optimism was a significant driver of late November’s price jump, but fears of new supply disruptions have emerged given political instability in Peru and ongoing labour disputes in Chile. Those two countries are the top two producers globally.
Other industrial metals prices resumed their upward trajectory as Chinese economic activity continued to ramp up. In November, iron ore, nickel, and zinc prices were all on pace to set monthly average highs for 2020, each having risen by more than 40% since the nadirs reached during the peak lockdown period. Those gains followed some of the strongest readings in China’s industrial sector since before the pandemic (chart 4, p.2). Zinc prices also received support from the shutdown of the Gamsberg mine in South Africa.

From a longer-run perspective, two pertinent developments came out of China during the past month. The first was the outline of the latest five-year plan, which, among other pledges, reinforced the “dual circulation” policy that aims to shore up domestic supply chains while also cultivating niches in external markets. Alongside the recent Regional Comprehensive Economic Partnership (RCEP) trade agreement, this could help China offshore some production elsewhere and focus on developing its technology sector. The second was the rollout of a yuan-denominated copper futures contract, which seeks to improve China’s pricing power and bolster the yuan’s overseas influence. China’s status as the world’s largest metals consumer bodes well for the success of the venture, but restrictions on yuan convertibility may give investors pause.
TECHNICAL NOTE
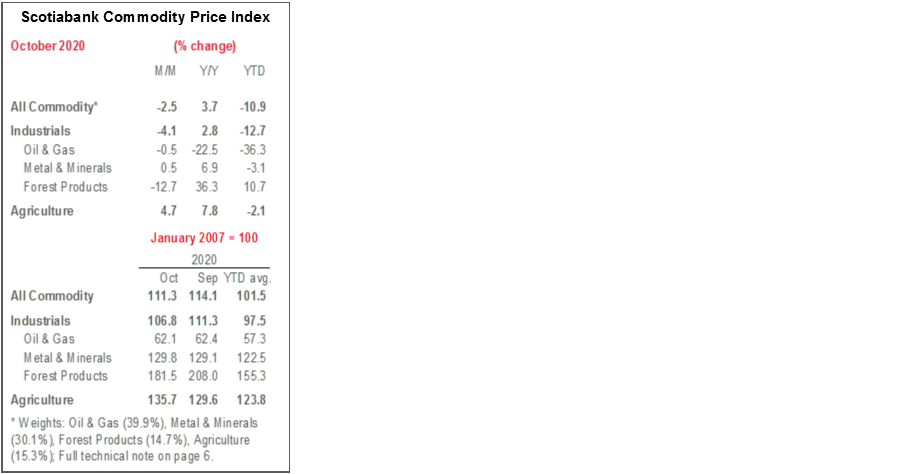
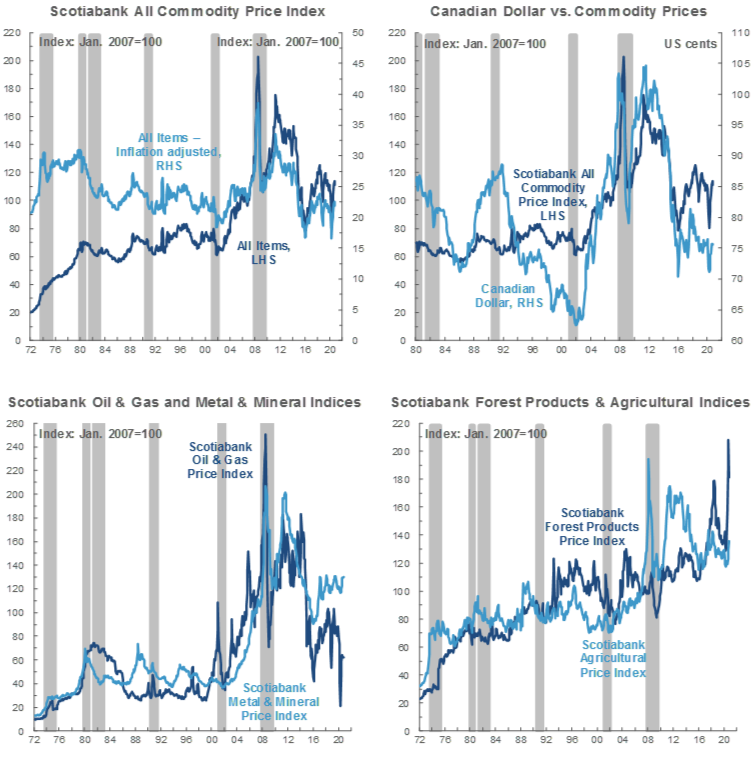
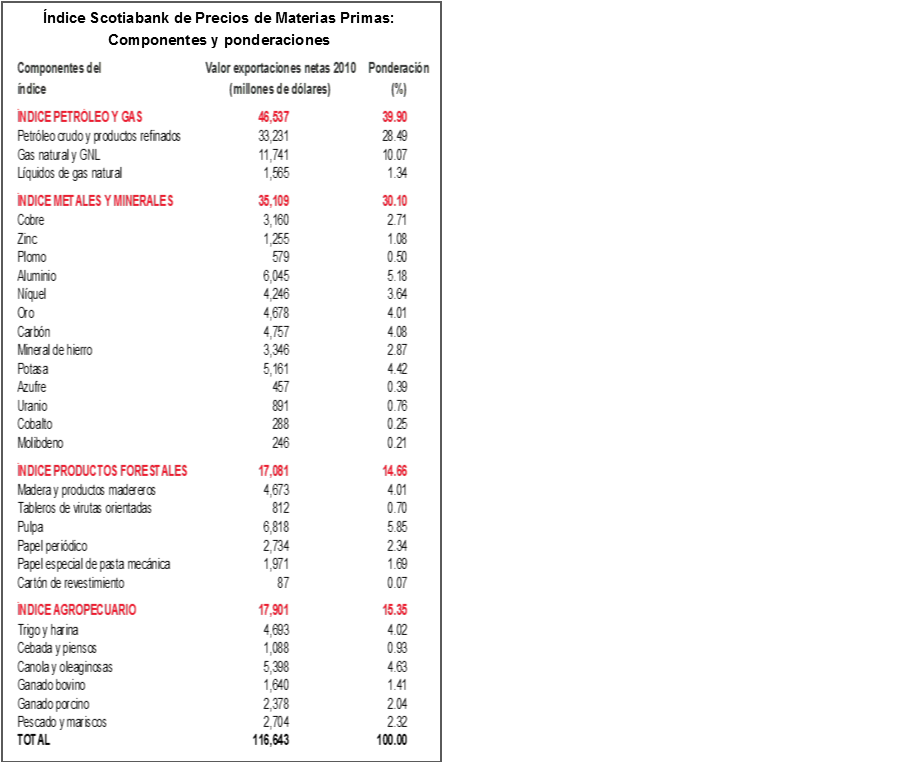
Scotiabank Commodity Price Index — Principal Canadian Exports
January 2007 = 100
This Index has been designed to track the spot or transactions prices paid in U.S. dollars for key Canadian commodities and resource-based manufactured goods in export markets. The weight of each component is based upon its net export value in 2010. Prior to January 2007, the weight of each component was based on its export value in 1995-97, except for crude oil & refined petroleum products, uncoated freesheet paper and linerboard, where net exports were used. Canada imports a significant quantity of these products, and use of their export value alone would have overstated the importance in Canada’s trade performance.
The following prices are included:
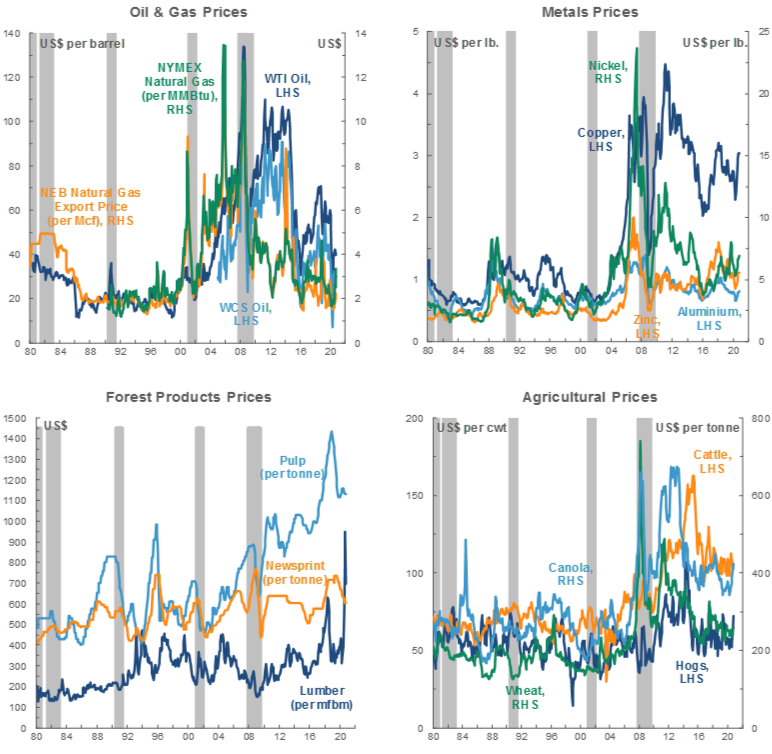
OIL & GAS
Crude Oil & Refined Petroleum Products (US$ per bbl) MSW light sweet crude oil at Edmonton (previously Edmonton Par crude) and Western Canadian Select heavy oil at Hardisty, Alberta; price differentials off WTI near-by futures from Bloomberg.
Natural Gas (US$ per mcf) Average export price quoted by the National Energy Board.
Natural Gas Liquids (NGLs – Propane, Butane, Ethane & Pentanes-Plus) (US$ per bbl), Propane at Edmonton & Sarnia.
METALS & MINERALS
Copper & Products (US$ per lb) LME official cash settlement price for grade A copper.
Zinc (US$ per lb) LME SHG cash settlement: prior to Sept 1990, U.S. producers’ price for high-grade zinc delivered.
Lead (US$ per lb) LME official cash settlement price; prior to Jan. 1991, U.S. producers’ price for common grade delivered.
Aluminium & Products (US$ per lb) since 1979, LME official cash settlement price.
Nickel (US$ per lb) since 1980, LME official cash settlement price.
Gold (US$ per oz) ‘LBMA Gold Price PM’ as of March 20, 2015.
Potash (US$ per tonne) Standard potassium chloride, spot price, FOB Vancouver.
Sulphur (US$ per tonne) Solid, spot price, FOB Vancouver.
Metallurgical Coal (US$ per tonne) Contract price for premium-grade hard coking coal, FOB Vancouver.
Iron Ore (US cents per dmtu) Spot price fines 62% Fe, CFR Qingdao, China; prior to Jan 2011, term-contract price for concentrates 66% Fe from Labrador/Quebec to Northern Europe (FOB Sept-Iles).
Uranium (US$ per lb) U3O8 near-by-futures from Bloomberg.
Molybdenum (US$ per lb) since March 1992, MW dealer oxide.
Cobalt (US$ per lb) MW dealer price.
FOREST PRODUCTS
Lumber & Wood Products, Western Spruce-Pine-Fir 2x4 No.2 & Btr (US$ per mfbm) FOB mill.
Oriented Strandboard (US$ per thousand sq. ft.), U.S. North Central region, 7/16 inch.
Pulp, Bleached Northern Softwood Kraft (US$ per tonne) Transactions price, delivery USA.
Newsprint (US$ per tonne) Average transactions price, 45 grams, delivery Eastern USA.
Groundwood Specialty Papers (US$ per ton) Supercalendered-A paper, 35 lb., delivery USA.
Linerboard (US$ per ton), delivery Eastern USA with zone discounts.
AGRICULTURE
Wheat & Flour (US$ per tonne), DNS No 1 14% protein Duluth, Minn; prior to April 2011 No.1 CWRS, 13.5% protein at St. Lawrence.
Barley (US$ per tonne), Manitoba Agriculture and Food No. 1 Canadian western barley aggregate spot price; historical data No. 1 at Lethbridge, Alberta.
Canola & Oilseeds (US$ per tonne) No.1 Canada, in store Vancouver.
Cattle & Beef (US$ per cwt) Steers over 1,051 pounds at Toronto; from Jan 1993, Ontario average.
Hogs & Pork (US$ per cwt) 100 Index Hogs at Toronto; from Jan 1993, Ontario average.
Fish & Seafood (US$ per lb) West Coast silver coho salmon; Atlantic lobster prices; prior to 1986 cod fillets & blocks.
DISCLAIMER
This report has been prepared by Scotiabank Economics as a resource for the clients of Scotiabank. Opinions, estimates and projections contained herein are our own as of the date hereof and are subject to change without notice. The information and opinions contained herein have been compiled or arrived at from sources believed reliable but no representation or warranty, express or implied, is made as to their accuracy or completeness. Neither Scotiabank nor any of its officers, directors, partners, employees or affiliates accepts any liability whatsoever for any direct or consequential loss arising from any use of this report or its contents.
These reports are provided to you for informational purposes only. This report is not, and is not constructed as, an offer to sell or solicitation of any offer to buy any financial instrument, nor shall this report be construed as an opinion as to whether you should enter into any swap or trading strategy involving a swap or any other transaction. The information contained in this report is not intended to be, and does not constitute, a recommendation of a swap or trading strategy involving a swap within the meaning of U.S. Commodity Futures Trading Commission Regulation 23.434 and Appendix A thereto. This material is not intended to be individually tailored to your needs or characteristics and should not be viewed as a “call to action” or suggestion that you enter into a swap or trading strategy involving a swap or any other transaction. Scotiabank may engage in transactions in a manner inconsistent with the views discussed this report and may have positions, or be in the process of acquiring or disposing of positions, referred to in this report.
Scotiabank, its affiliates and any of their respective officers, directors and employees may from time to time take positions in currencies, act as managers, co-managers or underwriters of a public offering or act as principals or agents, deal in, own or act as market makers or advisors, brokers or commercial and/or investment bankers in relation to securities or related derivatives. As a result of these actions, Scotiabank may receive remuneration. All Scotiabank products and services are subject to the terms of applicable agreements and local regulations. Officers, directors and employees of Scotiabank and its affiliates may serve as directors of corporations.
Any securities discussed in this report may not be suitable for all investors. Scotiabank recommends that investors independently evaluate any issuer and security discussed in this report, and consult with any advisors they deem necessary prior to making any investment.
This report and all information, opinions and conclusions contained in it are protected by copyright. This information may not be reproduced without the prior express written consent of Scotiabank.
™ Trademark of The Bank of Nova Scotia. Used under license, where applicable.
Scotiabank, together with “Global Banking and Markets”, is a marketing name for the global corporate and investment banking and capital markets businesses of The Bank of Nova Scotia and certain of its affiliates in the countries where they operate, including; Scotiabank Europe plc; Scotiabank (Ireland) Designated Activity Company; Scotiabank Inverlat S.A., Institución de Banca Múltiple, Grupo Financiero Scotiabank Inverlat, Scotia Inverlat Casa de Bolsa, S.A. de C.V., Grupo Financiero Scotiabank Inverlat, Scotia Inverlat Derivados S.A. de C.V. – all members of the Scotiabank group and authorized users of the Scotiabank mark. The Bank of Nova Scotia is incorporated in Canada with limited liability and is authorised and regulated by the Office of the Superintendent of Financial Institutions Canada. The Bank of Nova Scotia is authorized by the UK Prudential Regulation Authority and is subject to regulation by the UK Financial Conduct Authority and limited regulation by the UK Prudential Regulation Authority. Details about the extent of The Bank of Nova Scotia's regulation by the UK Prudential Regulation Authority are available from us on request. Scotiabank Europe plc is authorized by the UK Prudential Regulation Authority and regulated by the UK Financial Conduct Authority and the UK Prudential Regulation Authority.
Scotiabank Inverlat, S.A., Scotia Inverlat Casa de Bolsa, S.A. de C.V, Grupo Financiero Scotiabank Inverlat, and Scotia Inverlat Derivados, S.A. de C.V., are each authorized and regulated by the Mexican financial authorities.
Not all products and services are offered in all jurisdictions. Services described are available in jurisdictions where permitted by law.