Next Week's Risk Dashboard
• US nonfarm: more downside than upside?
• CDN jobs: more upside than downside?
• Evergrande & China’s holiday
• US debt ceiling countdown
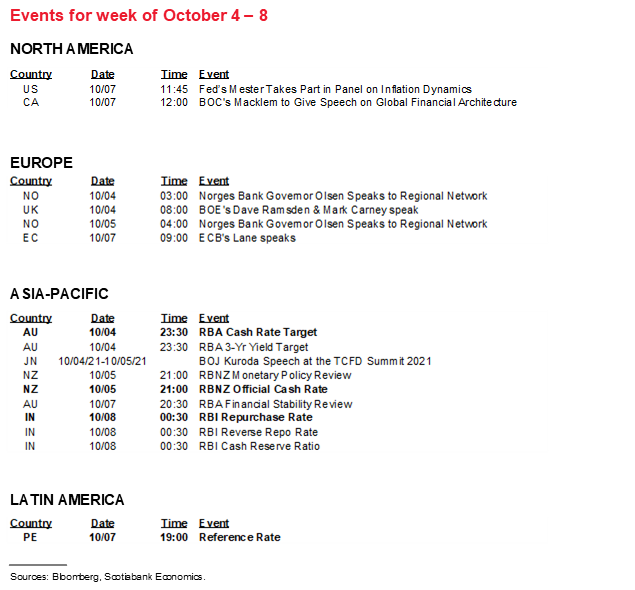
• BoC’s Macklem—sneak peek?
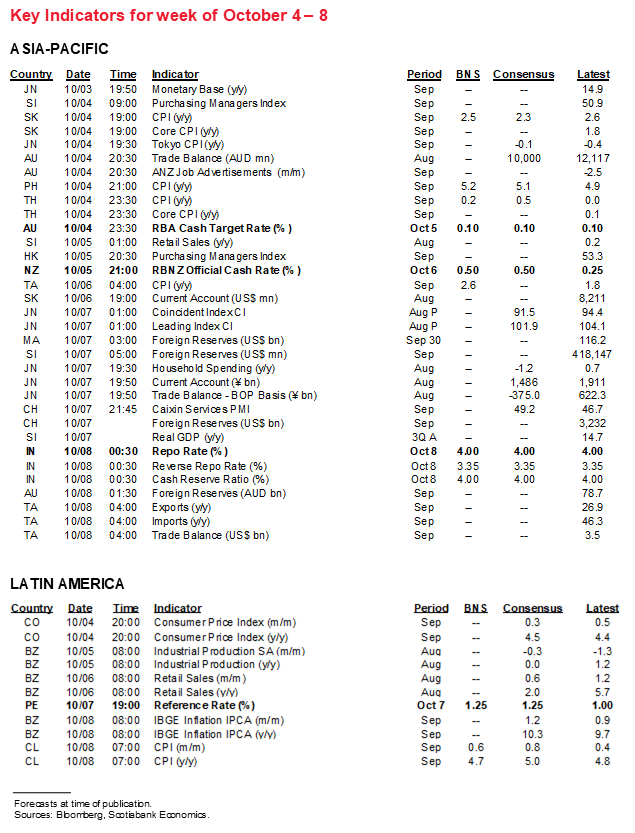
• CBs: RBA, RBNZ, RBI, Peru
• CPI: Asia & LatAm
• Other macro
Chart of the Week

WILL US NONFARM PASS THE FED’S TAPER TEST?
Far and away the main question over the coming week will be whether nonfarm payrolls will expand rapidly enough to meet the Fed’s conditional guidance to taper bond purchases ‘soon.’ They might, but the suite of available evidence leaves open the risk of disappointment.
Recall that the September FOMC statement indicated that “a moderation in the pace of asset purchases may soon be warranted.” There is wiggle room in that language, but ‘soon’ is usually the Fed’s imminent-sounding code language for the next meeting. The FOMC has indicated that they have achieved their inflation goals but are still ‘far, far away’ from full employment as Chair Powell put it in his recent Congressional testimony. That likely speaks more to rate hikes being some distance down the road whereas reducing bond purchases is a first step along that path toward ending them next summer.
Powell has also said, however, that “it would not take a knock-out jobs report to meet the test, only a reasonably good report” in reference to the pending payrolls number. So now the question is whether September payrolls will be “reasonably good” and keep the Fed on track, or whether it faces the risk of disappointment that could delay or derail taper plans, or whether the opposite risk might hold true if payrolls rip higher and feed expectations for a faster shutdown of purchases than next summer’s guidance and add to 2022 rate hike pricing.
When it comes to nonfarm, often it’s a case of ‘anything goes’! This time around has even greater than normal challenges associated with trying to estimate a reading. Because of the enormous uncertainty, I’m playing it cautiously with a modest guesstimated gain of just 250k but the scope for a downside miss may be greater than upside potential to this estimate.
Recall the two-pronged theory includes the thesis that parents going back to work when the little creatures scurried off to school could drive a large job gain. The added theory is that several jobless benefits either ended or were scaled back earlier this month and might have given millions no choice but to suddenly secure jobs. These changes included ending the extra $300/week of supplemental employment benefits, as well as ending the Pandemic Emergency Unemployment Compensation, Mixed Earners Unemployment Compensation and Pandemic Unemployment Assistance program.
But there are several reasons to think that another disappointment could be delivered. One is that there may be lags attached to both of these effects and there may be high caution around matters like assuming the kids will stay in school or that lost employment insurance benefits can’t be bridged for a time while assessing pandemic risks and launching a job search.
Further, we’re just not seeing enough evidence from the roughly half of US states that ended the supplemental $300/week unemployment benefits starting in July that they have seen a material pick-up in job growth to add to the theory that it will suddenly grip the entire nation this month.
In addition, chart 1 shows the results of the Census Bureau’s Household Pulse Survey. It doesn’t line up exactly to the nonfarm reference period which is the pay period including the 12th calendar day of each month. Comparing changes in responses between the August 4th – 16th period to the September 1st–13th period is still a reasonable proxy that offers at least a partial overlap into the nonfarm reference period and a complete overlap with the household survey that estimates jobs on the 12th day of each month.
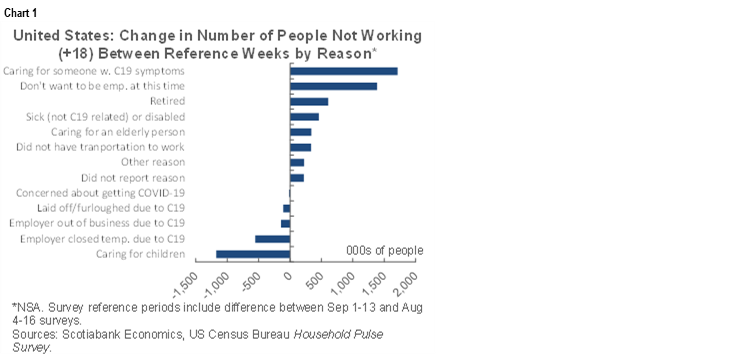
What the chart depicts are the changes in millions of respondents to various questions about why they didn’t work in September compared to August. Note the following:
- The long-hypothesized return of parents to the workforce is indeed happening with another 1.17 million parents returning to work in September. They also didn’t only wait until the kids went back to school as we’ve seen this number fall sharply over the summer months (chart 2). This effect may be maturing, however, as the figures hit the lowest of the pandemic to date. Still, what we can’t fully ascertain is how much of this is the usual seasonal effect for those types of jobs that involve taking the summer off with the kids, versus how much is seasonally unusual due to the nature of the pandemic.

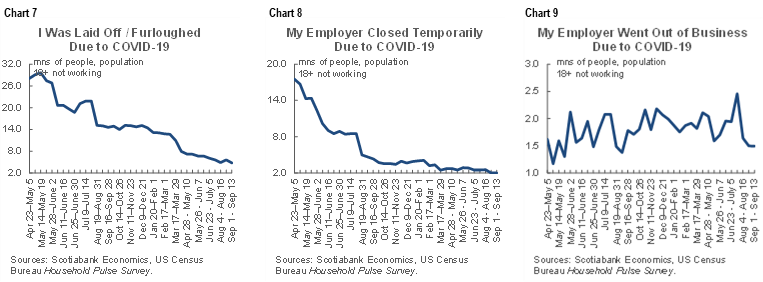
- There were also declines in the number of people who said they didn’t work in September because their employer temporarily shut due to the pandemic (-554k), the number who said they didn’t work because their employment went bust due to the pandemic (-144k) and the number who said they were laid off or furloughed due to the pandemic (-108k).
- That’s it for the goods news on jobs. The rest is more than offsetting. For instance, another 1.7 million more Americans said they didn’t work in September because they were caring for someone who was sick with COVID-19 (chart 3). Ouch. This corresponds with the outbreak of the Delta wave.

- Another almost 1.4 million more respondents simply said they didn’t want to work at this time (chart 4). Well then, must be nice!

- There has also been a recent up-tick in folks who say they aren’t working due to concern about getting or spreading COVID-19 (chart 5).

- There was an increase of 609k who retired. There is always some of this each month, but the numbers have been elevated for some time now (chart 6) and the increase in September was the biggest since early summer. Some of this trend is clearly due to the pandemic.

- Other readings, however, are generally indicating that businesses are not in lay-off or closure mode due to the pandemic (charts 7–9). They just can’t seem to find folks willing to work!
On net, 3.3 million people exited the workforce in September compared to August according to the Household Pulse Survey and not only due to the pandemic.
Since this is just a survey and with an imperfect mapping onto nonfarm to boot, we need to be careful with it and look at the broader set of limited evidence. Unfortunately, the other evidence also suggests we should be braced for more downside than upside risk.
- Job openings data lags behind, but the National Federation of Independent Business provides a ‘hard to fill’ reading that has moved up over the past two months up to August (chart 10). This is fresher than the more traditional ‘JOLTS’ job openings reading but even that hit a record high in the limited 20-year history of the report. It’s pretty apparent that employers want to hire but prospective employees have other things in mind. The recent ISM-manufacturing survey’s comments about increasingly strained supply chains and difficulty getting labour tend to confirm this.

- The stringency index of restrictions increased again (chart 11) which probably points toward reduced ability to fill vacant jobs.

- One proxy for the high-contact services sector is restaurant reservations. They’ve recently slipped again (chart 12), though some of this is also likely to be seasonal as family holidays end with the kids going back to school.

- The Conference Board’s ‘jobs plentiful’ measure was little changed in September compared to the prior month and is reasonably well correlated with nonfarm payrolls (chart 13).

- The number of initial jobless claims over the first few weeks of September was little changed compared to the number over the first few weeks of August.
- Unfortunately, we won’t get ADP or the ISM-services employment gauge until next week and so there are still some missing parts of the puzzle.
What we’re left with sounds to me like the best trading strategy could well involve getting out the hockey stick diagrams on payoff matrices around upside and downside disappointments perhaps more skewed toward downside risk.
Lastly, I’ll be keeping an eye on wage growth again. The average hourly earnings measure could accelerate toward a gain of 4.7% y/y as monthly average gains continue to exceed seasonal norms in the context of all of the challenges that we’re hearing about in terms of securing enough labour. It’s unclear this acceleration has been a compositional effect.
CANADIAN JOBS—UPSIDES AND DOWNSIDES
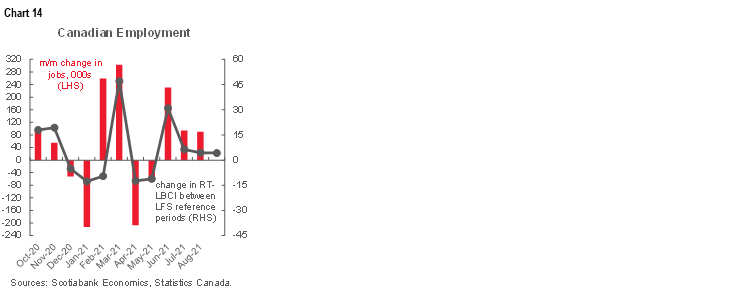
Canada also updates job market figures for September on Friday when the Labour Force Survey lands. Most of what can be pieced together in advance does not point to the same potential downside risk that US nonfarm payrolls may face. I went with +80k and another drop in the unemployment rate to 6.8% from 7.1%.
Chart 14 shows the connection between job growth and Statistics Canada’s timely composite of real-time local business conditions that we aggregate into a weighted national measure. It’s hardly an infallible relationship, but the reasonable correlations suggest that we could get a similar pace of increase in overall employment as we saw in the prior two months.
One rationale for expecting another solid gain is that restrictions have fallen to the lowest level of the pandemic thus far (chart 15). Much of the reason stems from the fact that Canada’s overall COVID-19 new cases per capita rate remains a fraction of what it is in the United States partly because of higher vaccination rates north of the border (chart 16). Furthermore, Canada is transitioning between unemployment support programs and did so right during the Labour Force Survey reference week which is the week including the 15th of each month. During the reference week, about 320,000 appear to have dropped off employment insurance benefits and some may have transitioned toward the Canada Emergency Response Benefit. Some may be forced to accept employment in jobs that may have lower or similar pay to their prior benefits, but it’s likely too soon for much of that to have happened so fast during the reference week.

What is unclear by way of potential downside risk is how much of the decline in measures like mobility trends across all major cities (chart 17) and restaurant bookings (chart 18) reflected pandemic concerns versus seasonal influences as the kids went back to school and summer holidays came to an end for many. Seasonal adjustments on mobility readings are somewhat of a mess and so we can’t be sure of what’s normal and what is not. It’s also likely that the accelerating wave of COVID-19 cases in Alberta and Saskatchewan will drive regionally weaker numbers with the larger provinces expected to carry the day toward a sizable employment gain.

Lastly there is the ongoing debate over wage growth. Also watch the month-over-month annualized rate of seasonally adjusted gains in wages from this report and how it has accelerated of late. There are compositional issues, but they don’t explain away the recent momentum. Also note that the lagging payrolls survey (SEPH) registered a 1% m/m seasonally adjusted non-annualized rise in average weekly earnings during August. The Bank of Canada’s preferred wage common composite is not exhibiting such upward momentum because it’s stale with most of the data still skewed toward Q2 during which much of the economy was in lockdown and contracting. If we want a measure of wage growth that captures the reopening frenzy to hire labour then we need the freshest available metric which comes from the Labour Force Survey as one input that bears continued monitoring in the context of tightening N.A. labour markets.
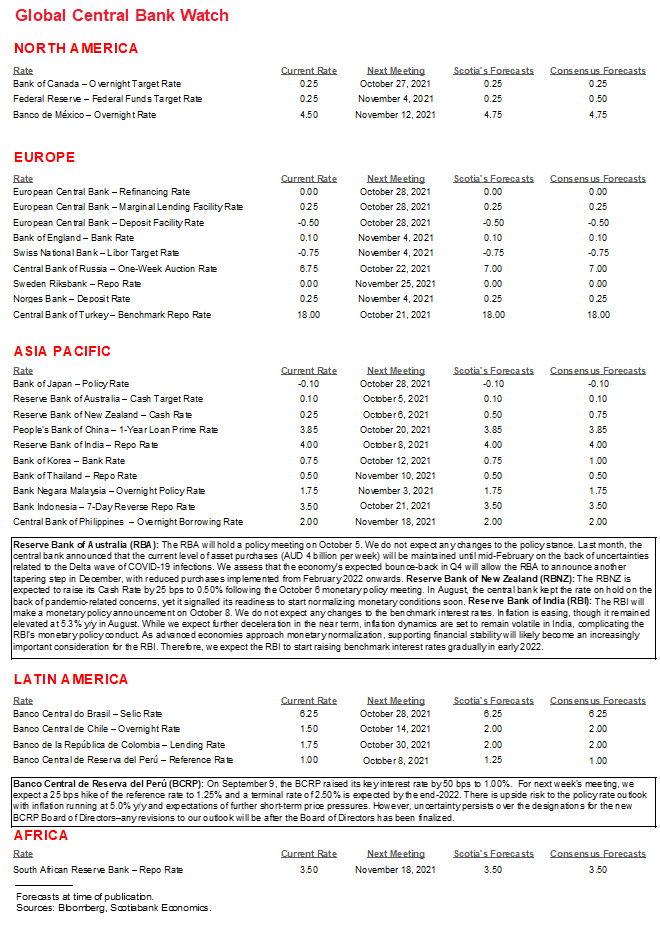
CENTRAL BANKS—TWO HIKES, A HOLD AND A MAYBE
While none of the central banks that will deliver decisions over the coming week are likely to have an effect on global markets, each of them could offer regional influences.
RBA (Monday 11:30pmET): No policy changes are expected at this meeting. The Reserve Bank of Australia reduced the weekly flow of purchases of Australian government bonds to A$4 billion/week from $5 billion at the meeting in September, but also extended the purchase period until “at least mid-February.” Having pre-committed to this purchase rate for five extra months doesn’t slam the door shut on further tapers before then as the RBA continues to review the bond purchase program, but it would appear to set a high bar against adjusting the program again before such time. In the meantime, the balance sheet continues to soar (chart 19).

RBNZ (Tuesday 10pmET): Shoulda coulda woulda. In the end, hiking the cash rate by a quarter point to 0.5% about seven weeks later instead of when they had previously guided they were likely to do so back on August 17th won’t matter a hill of beans to the economy and the RBNZ’s inflation target. Recall that the only reason the RBNZ did not hike as it basically pledged to do so at the August meeting was because of the single COVID-19 case that sprang up the night before the decision. Cases went gently higher thereafter but have since fallen back down again and so gone is the reason for temporarily holding off (chart 20). In fact, the tone of data since then has only reinforced the case for tightening policy as 2.8% GDP growth landed at more than twice consensus expectations for Q2. Recall that the August statement made it pretty clear that should the COVID case trend subside, then the RBNZ would likely hike:

“The Committee agreed that their least regrets policy stance is to further reduce monetary policy stimulus to reduce the risk that inflation expectations become unanchored. However in light of the current Level 4 lockdown and health uncertainty the Committee agreed to leave the OCR unchanged at this meeting.”
Peru (Thursday 7pmET): Will it be another 50bps move? Our Lima-based economist expects a 25bps rate hike to a 1.25% reference rate this week that would be the third hike of the cycle that began with the hike on August 12th and accelerated with the 50bps hike on September 9th. Some within consensus think they could hike by another 50bps this time. Back-to-back 50bps moves would be aggressive, but what could lean in that direction is another upside surprise to inflation that landed at 5.2% in September with core CPI rising to 2.6% y/y (chart 21).

RBI (Friday 12:30amET): When the Reserve Bank of India acted to withdraw liquidity from the market this past week it fanned speculation that the central bank was inching closer toward a rate hike. The RBI drained 1.97 trillion rupees from the market via 7-day repo at a higher cut off rate of 3.99% from 3.42% previously. It would surprise consensus if a hike were to be delivered at this meeting but watch for somewhat more hawkish forward guidance on the path to the next decision on December 7th. Ahead of the RBI keep an eye on PMIs for September on Tuesday.
EVERGRANDE—HOLIDAY SURPRISE?
Chinese markets are shut for Golden Week and will reopen on Friday. See last week’s Global Week Ahead for a discussion that is still relevant. Be on watch for potential restructuring arrangements while mainland and Hong Kong markets are closed. When markets return, they will move onto whether or not Evergrande will skip yet another coupon payment on Monday October 11th. Recall the coupon payment schedule in chart 22.

THE REST—WILL MACKLEM OFFER A SNEAK PEEK?
Bank of Canada Governor Tiff Macklem speaks on Thursday at 12pmET just before he sees jobs data. There will be published remarks on the topic of ‘global financial architecture.’ Macklem will also hold a press conference afterward. Landing just twenty days before the next BoC rate statement, Monetary Policy Report and full press conference could reduce the likelihood that he will provide any sneak peek, but it is obviously a risk. Canada also updates trade figures for August on Tuesday that rarely get anyone’s heartbeat up.
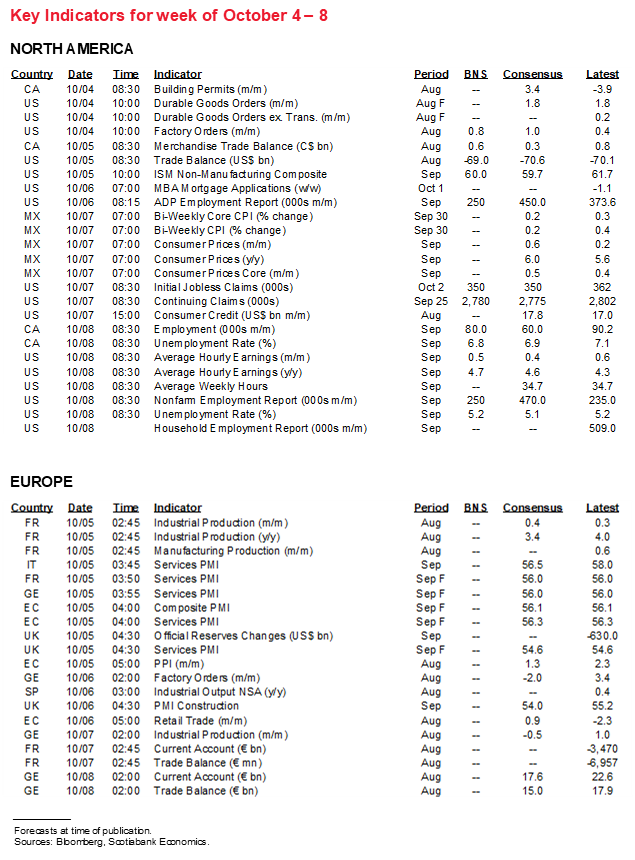
The rest of the US calendar will struggle to matter ahead of nonfarm payrolls. Instead, much of the focus will be off-calendar and focused upon ongoing negotiations within Congress and within the Democrats over the future of the US$1 trillion infrastructure bill, the $3.5 trillion families spending plan that seems likely to survive only in fractional form if at all, and the need to raise the debt ceiling before the October 18th X-date according to Treasury Secretary Yellen. Otherwise, ISM-services for September (Tuesday), factory orders during August (Monday), the updated trade deficit for August that probably narrowed a bit (Tuesday) and weekly jobless claims (Thursday) will offer a light line-up.
Several countries update CPI readings for September with a concentration upon Latin America and Asia-Pacific regions. Monday brings out Japan, South Korea, Philippines, Thailand and Colombia. Mexico updates on Thursday and then both Brazil and Chile release on Friday. The readings that may matter most to relative central bank views will be the Korean, Mexican, Brazilian and Chilean prints.
The main European releases will focus upon Germany when factory orders (Wednesday), industrial production (Thursday) and exports (Friday) arrive for the month of August.

DISCLAIMER
This report has been prepared by Scotiabank Economics as a resource for the clients of Scotiabank. Opinions, estimates and projections contained herein are our own as of the date hereof and are subject to change without notice. The information and opinions contained herein have been compiled or arrived at from sources believed reliable but no representation or warranty, express or implied, is made as to their accuracy or completeness. Neither Scotiabank nor any of its officers, directors, partners, employees or affiliates accepts any liability whatsoever for any direct or consequential loss arising from any use of this report or its contents.
These reports are provided to you for informational purposes only. This report is not, and is not constructed as, an offer to sell or solicitation of any offer to buy any financial instrument, nor shall this report be construed as an opinion as to whether you should enter into any swap or trading strategy involving a swap or any other transaction. The information contained in this report is not intended to be, and does not constitute, a recommendation of a swap or trading strategy involving a swap within the meaning of U.S. Commodity Futures Trading Commission Regulation 23.434 and Appendix A thereto. This material is not intended to be individually tailored to your needs or characteristics and should not be viewed as a “call to action” or suggestion that you enter into a swap or trading strategy involving a swap or any other transaction. Scotiabank may engage in transactions in a manner inconsistent with the views discussed this report and may have positions, or be in the process of acquiring or disposing of positions, referred to in this report.
Scotiabank, its affiliates and any of their respective officers, directors and employees may from time to time take positions in currencies, act as managers, co-managers or underwriters of a public offering or act as principals or agents, deal in, own or act as market makers or advisors, brokers or commercial and/or investment bankers in relation to securities or related derivatives. As a result of these actions, Scotiabank may receive remuneration. All Scotiabank products and services are subject to the terms of applicable agreements and local regulations. Officers, directors and employees of Scotiabank and its affiliates may serve as directors of corporations.
Any securities discussed in this report may not be suitable for all investors. Scotiabank recommends that investors independently evaluate any issuer and security discussed in this report, and consult with any advisors they deem necessary prior to making any investment.
This report and all information, opinions and conclusions contained in it are protected by copyright. This information may not be reproduced without the prior express written consent of Scotiabank.
™ Trademark of The Bank of Nova Scotia. Used under license, where applicable.
Scotiabank, together with “Global Banking and Markets”, is a marketing name for the global corporate and investment banking and capital markets businesses of The Bank of Nova Scotia and certain of its affiliates in the countries where they operate, including; Scotiabank Europe plc; Scotiabank (Ireland) Designated Activity Company; Scotiabank Inverlat S.A., Institución de Banca Múltiple, Grupo Financiero Scotiabank Inverlat, Scotia Inverlat Casa de Bolsa, S.A. de C.V., Grupo Financiero Scotiabank Inverlat, Scotia Inverlat Derivados S.A. de C.V. – all members of the Scotiabank group and authorized users of the Scotiabank mark. The Bank of Nova Scotia is incorporated in Canada with limited liability and is authorised and regulated by the Office of the Superintendent of Financial Institutions Canada. The Bank of Nova Scotia is authorized by the UK Prudential Regulation Authority and is subject to regulation by the UK Financial Conduct Authority and limited regulation by the UK Prudential Regulation Authority. Details about the extent of The Bank of Nova Scotia's regulation by the UK Prudential Regulation Authority are available from us on request. Scotiabank Europe plc is authorized by the UK Prudential Regulation Authority and regulated by the UK Financial Conduct Authority and the UK Prudential Regulation Authority.
Scotiabank Inverlat, S.A., Scotia Inverlat Casa de Bolsa, S.A. de C.V, Grupo Financiero Scotiabank Inverlat, and Scotia Inverlat Derivados, S.A. de C.V., are each authorized and regulated by the Mexican financial authorities.
Not all products and services are offered in all jurisdictions. Services described are available in jurisdictions where permitted by law.